Effect of Mg substitution on LaTi1−xMgxO3+δ catalysts for improving the C2 selectivity of the oxidative coupling of methane†
Larissa B.
Lopes
 a,
Luiz H.
Vieira
 a,
José M.
Assaf
b and
Elisabete M.
Assaf
 *a
*a
aUniversity of São Paulo, São Carlos Institute of Chemistry, Av. Trabalhador Sãocarlense, 400, 13560-970 São Carlos, Brazil. E-mail: eassaf@iqsc.usp.br
bFederal University of São Carlos, Rod. W. Luiz, km. 235, São Carlos, SP, Brazil
First published on 13th November 2020
Abstract
This study investigated the effect of the partial substitution of Ti by Mg on the La2Ti2O7 perovskite-type structure towards improvements in the selective results of OCM reactions. The LaTi1−xMgxO3+δ catalysts were prepared with x = 0, 0.25 and 0.50 according to a polymer complexing method. XPS analysis showed a surface reconstruction with Mg addition, increasing the formation of oxygen vacancies in the interface formed by La–O–Mg and with an Mg-enriched surface compared to bulk compositions. DRIFTS results presented spectra more restricted to mono- and bidentate carbonate bands with the Mg load increasing, which significantly influence the OCM reaction. Differences in the M–O bonding force were demonstrated by XPS, FTIR, and Raman analysis, which result in the change of the catalyst basicity with the Mg addition. The M–O bond force constants (k) were calculated and showed a linear correlation with C2 selectivity. The catalytic results showed that methane conversion and C2 selectivity increased as a function of the Mg amount. Changes in the reaction conditions confirmed that both CH4/O2 feed ratio and reaction temperature are important parameters for the OCM reaction. The best catalytic reaction conditions were WHSV = 30![[thin space (1/6-em)]](https://www.rsc.org/images/entities/char_2009.gif) 000 mL gcat−1 h−1, CH4/O2 = 8 and T = 800 °C for LaTi0.5Mg0.5O3 (LTMO-50) catalyst, which achieved 51.4% C2 selectivity. The catalyst remained thermally stable under such conditions even after 24 h of reaction, which has proven the advantage of Mg substitution in this catalyst structure.
000 mL gcat−1 h−1, CH4/O2 = 8 and T = 800 °C for LaTi0.5Mg0.5O3 (LTMO-50) catalyst, which achieved 51.4% C2 selectivity. The catalyst remained thermally stable under such conditions even after 24 h of reaction, which has proven the advantage of Mg substitution in this catalyst structure.
Introduction
Methane has shown great potential as a reactant in several chemical processes due to its low cost and widespread availability.1,2 However, high-cost transportation to industrial plants has restricted its application mainly to energy production by combustion processes.3,4 A solution is to convert it into more valuable compounds, such as fuels and chemical reagents of industrial interest.5 Although its application as a reactant has advanced, the high stability of its bonds has remained a challenge in obtaining the desired products.3 High temperatures are required for the breakage of the C–H bond, and the reaction may follow a radical mechanism that leads to low selectivity results.6Ethylene is a promising product derived from methane, which has a high industrial demand7–10 for the production of polymers, fibers, and other organic compounds.11 It is currently produced by steam and thermal cracking of crude oil. However, more sustainable long-term approaches, e.g., reactions that use methane as the carbon source, are under development.7,10,12
The oxidative coupling of methane (OCM) to C2 hydrocarbons (ethane and ethylene) occurs through a direct pathway in the presence of oxygen, according to eqn (1) and (2).6 Possible reaction by-products include COX (CO and CO2) and higher hydrocarbons (C3+).13 The OCM process must achieve higher values of methane conversion and C2 selectivity for industrial application, close to the thermodynamic limit of 25% C2 yield.14,15 However, achieving this yield is a challenge and depends on the development of more selective and stable catalysts which can withstand deactivation over time due to the reaction conditions necessary for methane activation.16,17
 | (1) |
| 2 CH4 + O2 → C2H4 + 2 H2O ΔH° = −1163 kJ mol−1 (1073 K) | (2) |
The active sites required for methane activation in the OCM reaction can be attributed to oxygen species at the catalyst surface. The specific nature of these species is still unclear but may include chemisorbed oxygen (O2−), dissociative adsorbed oxygen (O−), adsorbed oxygen ions (O2−), and lattice oxygen (O2−).8,9 During the OCM reaction, these species are regenerated through a cycle that includes oxygen vacancies and the gas-phase oxygen.9
A surface enriched with weakly bound oxygen species can present a faster regeneration cycle, which leads to a more active catalyst for the OCM reaction.8,18 An alternative to decrease this bond strength is to alter the oxide structure by replacing lattice cations. Substituted oxides have improved parameters which influence the electronic structure.19 The synergy between the host and the substituted cation increases this effect, especially if the substituted cation has a low valence,20 thus lowering the coordination number between oxygen and the lattice cations.8
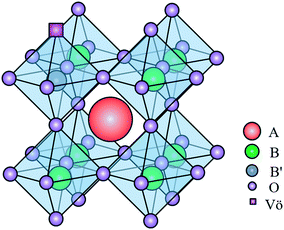
The application of perovskite-type oxides as catalysts for the OCM reaction is an emerging field of research. Perovskite is a mixed-oxide structure of ABO3 stoichiometry, whose A site and B site cations show different sizes and are coordinated by oxygen anions21 (see Fig. 1). Such oxides have shown great potential as catalysts for OCM reactions due to their defined stoichiometry and appropriate structure, which enable substitutions on the A and B sites.22,23 Moreover, perovskite-type oxides show high thermal stability and low energy requirement for oxygen vacancy formation, and favor surface reconstruction, making the catalyst more suitable to the OCM reaction.23–26
Ivanov et al. investigated SrTiO3 and Sr2TiO4 oxides substituted with Mg, Al, Ca, Ba, and Pb and observed an improvement in the catalytic activity by these oxides in comparison to the pure ones.23 Fakhroueian et al. analyzed the promotion of BaSrTiO3 with Mg, Li, and Na and observed enhanced basicity on the catalyst surface, thus improving the OCM results.27 Kim et al. investigated LaAlO3, LaFeO3, and LaNiO3 catalysts over the OCM reaction and proved that different cations in B sites led to different electronic features of the surface lattice oxides, which indicates that the OCM results are strongly affected by the B site component.9
Our study investigates the application of LaTi1−xMgxO3+δ perovskite-type catalysts for the OCM reaction, evaluating the effect of Mg substitution to improve the C2 selectivity.
Experimental
Catalyst synthesis
LaTi1−xMgxO3+δ (LTMO) catalysts were prepared by a polymerized complexing method.28 Adequate amounts of titanium isopropoxide (Ti[OCH(CH3)2]4, 97% Aldrich), lanthanum nitrate (La(NO3)3·6H2O, 99% Vetec), and magnesium nitrate (Mg(NO2)2·6H2O, 98% Alfa Aesar) were added to a solution of ethylene glycol (C2H6O2, P.A. Synth) and anhydrous citric acid (C6H8O7, P.A. Synth) under constant stirring at ambient temperature. The molar ratios for ethylene glycol/citric acid/total amount of cation were 10![[thin space (1/6-em)]](https://www.rsc.org/images/entities/char_2009.gif) :
:![[thin space (1/6-em)]](https://www.rsc.org/images/entities/char_2009.gif) 4
4![[thin space (1/6-em)]](https://www.rsc.org/images/entities/char_2009.gif) :
:![[thin space (1/6-em)]](https://www.rsc.org/images/entities/char_2009.gif) 1. After dissolution, the solution was stirred for 30 min and then transferred to a glycerol bath at 120 °C, where it remained under stirring until complete polymerization. The polymer was calcined at 300 °C for 2 h, macerated, and calcined at 800 °C for 4 h. The Mg substitutions were performed at x = 0, 0.25 and 0.5, and the catalysts were labeled LTMO-0, LTMO-25 and LTMO-50, respectively.
1. After dissolution, the solution was stirred for 30 min and then transferred to a glycerol bath at 120 °C, where it remained under stirring until complete polymerization. The polymer was calcined at 300 °C for 2 h, macerated, and calcined at 800 °C for 4 h. The Mg substitutions were performed at x = 0, 0.25 and 0.5, and the catalysts were labeled LTMO-0, LTMO-25 and LTMO-50, respectively.
Characterization
X-ray powder diffraction (XRD) analyses were performed in a Rigaku Multiflex 600 system of 40 kV acceleration voltage, 15 mA emission current, Cu Kα (λ = 1.5405 Å) as the radiation source, 2θ gap of 10–80°, and 0.02° s−1 scanning rate. Rietveld refinements based on XRD data and average crystallite sizes were obtained using TOPAS V.5 software. Scanning electron microscopy (SEM) analyses were conducted on ZEISS LEO 440 equipment and an OXFORD 7060 detector coupled to an energy-dispersive X-ray spectroscope (EDS) using EDX LINK ANALYTICAL equipment with a SiLi pentafet detector and 60 eV resolution. X-ray photoelectron spectroscopy (XPS) analysis was carried out in an ultra-high vacuum chamber at a pressure of 2 × 10⁻⁷ Pa using a commercial spectrometer (ScientaOmicron ESCA+). The monochromatic Al Kα line was used, and the analyzer pass energy was set to 50 eV. Details of the data treatment are described in the ESI.† Transmission electron microscopy (TEM) analyses were performed on JEOL 2100 equipment coupled to an EDS by Thermo Scientific. CO2 temperature-programmed desorption (CO2-TPD) analyses were conducted on a Micromeritics ChemiSorb 2750 instrument and were performed according to the procedure described in the ESI.† Fourier transform infrared spectroscopy (FT-IR) analyses were performed on Shimadzu IRPrestige-21 equipment by averaging 256 sequentially collected scans at a resolution of 4 cm−1 in the absorption mode: (i) the catalyst spectra were collected at room temperature in the 4000–400 cm−1 spectral range with KBr as background; (ii) in situ CO2 chemisorption spectra recorded in diffuse reflectance mode (DRIFTS) were collected in the 2000–1000 cm−1 spectral range. The analyses were carried out as described in the ESI.† Micro-Raman spectroscopy analyses were performed on B&W Tek Raman BWS 415-785H equipment of 3.5 cm−1 wavenumber resolution, 785 nm excitation wavelength, 60 s integration time, and laser power ranging from 60 to 100 mW. The data were treated using B&WSpec 4.03_23_C software. The specific surface areas were measured according to the BET method on Quantachrome NOVA 1000e equipment. Coke on spent catalysts was quantified by elemental analysis technique on Thermoscientific FlashSmart equipment.Catalytic tests
The oxidative coupling of methane reactions were performed in a quartz tube packed-bed reactor with 150 mg of catalyst and 200 mg of ground quartz. A cold trap collected the water vapor produced during the reaction, and the gaseous products were analyzed using an online gas chromatography system (Varian Chrompack 3800) with a molecular sieve 13× and Porapak N columns and equipped with a thermal conductivity detector (TCD). The catalytic activity was calculated by eqn (3)–(5), which represent methane conversion (XCH4), C2 selectivity (SC2), and COx selectivity (SCOx), respectively. Due to the difficulty of quantifying coke over the reaction time, the selectivities were calculated based on moles of CH4 consumed during the reaction, as previously reported for the OCM reaction.22,27,29 | (3) |
 | (4) |
 | (5) |
Results and discussion
Surface and bulk properties of catalysts
Fig. 2 shows the XRD patterns of pure and Mg-substituted catalysts refined by the Rietveld method. LTMO-0 shows the characteristic diffraction peaks of La2Ti2O7 pure phase (PDF No. 28-517), whereas LTMO-25 and LTMO-50 are similar to the perovskite phase LaTi0.5Mg0.5O3 (PDF No. 89-5628). Pure catalyst LTMO-0 has a monoclinic phase (P1121 space group) and lattice parameters similar to those reported30–32 for the same structure (a = 7.82 Å, b = 12.97 Å, c = 5.53 Å and γ = 98.43°). The Mg insertion in the lattice induced a change in the crystalline system from monoclinic to orthorhombic (Pbnm space group). LTMO-25 and LTMO-50 showed similar lattice parameters, with a small increase in c value (7.84 Å and 7.88 Å, respectively), which indicates that the desired crystalline phase was formed at 800 °C. No additional peaks attributable to individual metal oxides, such as La2O3, TiO2, and MgO, were identified.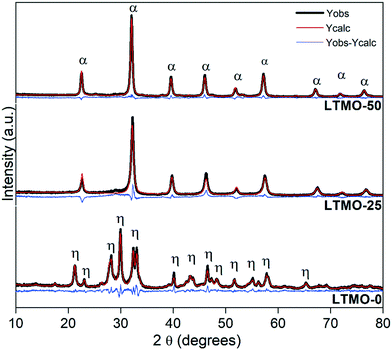 | ||
| Fig. 2 Rietveld refinement of LTMO X-ray diffraction patterns. η and α peaks are relative to the La2Ti2O7 and LaTi0.5Mg0.5O3 phases, respectively. | ||
Table 1 shows the lattice parameters of the catalysts (fresh and spent) and the reliability factors of the fit obtained by Rietveld refinement via TOPAS software. The partial substitution of the Ti4+ lattice cation for Mg2+ (0.605 Å and 0.720 Å ionic radii, respectively) changed the crystalline system from monoclinic to orthorhombic, which decreased the unit cell volume. However, a small increase was observed between LTMO-25 and LTMO-50. This change is probably due to the difference in the ionic radii of the cations since Mg2+ shows a larger ionic radius than Ti4+. The strength of bond between the metal and oxygen (M–O) of the structure should also be considered. A decrease in the M–O bond strength results in a longer bond length, thus increasing the unit cell volume.
| Catalyst | Lattice parameters | V (Å3) | Cryst. size (nm) | Fit parameters | |||||
|---|---|---|---|---|---|---|---|---|---|
| a (Å) | b (Å) | c (Å) | γ (°) | GOFb | R exp | R wp | |||
a LTMO-50 catalyst spent in the OCM reaction under the following conditions: CH4/O2 = 8, WHSV = 30![[thin space (1/6-em)]](https://www.rsc.org/images/entities/char_2009.gif) 000 mL gcat−1 h−1, T = 800 °C and t = 24 h.
b GOF – goodness of fit.
c
R
exp – expected R-factor.
d
R
wp – weighted-profile R-factor. 000 mL gcat−1 h−1, T = 800 °C and t = 24 h.
b GOF – goodness of fit.
c
R
exp – expected R-factor.
d
R
wp – weighted-profile R-factor.
|
|||||||||
| LTMO-0 | 7.82 | 12.97 | 5.53 | 98.43 | 554.9 | 13.0 | 5.47 | 1.86 | 10.16 |
| LTMO-25 | 5.55 | 5.58 | 7.84 | — | 242.7 | 20.0 | 8.50 | 1.94 | 16.47 |
| LTMO-50 | 5.55 | 5.58 | 7.88 | — | 243.9 | 23.7 | 5.70 | 1.95 | 11.09 |
| LTMO-50Sa | 5.57 | 5.57 | 7.88 | — | 244.6 | 26.4 | 1.65 | 4.79 | 7.93 |
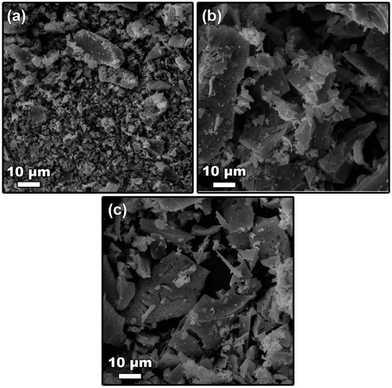
Fig. 3 shows the microstructures of LTMO catalysts prepared by the polymerized complexing method. The SEM images show a non-uniform morphology and a varying particle size. The Mg addition to the structure increased the agglomeration degree; however, the microstructures showed good similarity in the set of the Mg-substituted catalysts.
SEM/EDS was used to analyze the bulk chemical composition of the catalysts (see Table 2). The La, Ti, and Mg ratios show similarity with the perovskite oxide structure (ABO3) for all catalysts. According to the results, the molar number of B site cations (Ti and Mg) is close to the molar number of A site cations (La), which agrees with the expected structure (A site and B site ratios of 1![[thin space (1/6-em)]](https://www.rsc.org/images/entities/char_2009.gif) :
:![[thin space (1/6-em)]](https://www.rsc.org/images/entities/char_2009.gif) 1). The results also show that the Mg amount per total number of B site cations agrees with the ratio expected for each substituted catalyst (25% and 50%). These results, in addition to the XRD results and the changes in the unit cell volume parameters, indicated that the Mg substitution was successfully achieved.19
1). The results also show that the Mg amount per total number of B site cations agrees with the ratio expected for each substituted catalyst (25% and 50%). These results, in addition to the XRD results and the changes in the unit cell volume parameters, indicated that the Mg substitution was successfully achieved.19
| Catalyst | Bulk compositiona | Surface compositionb | ||||||||
|---|---|---|---|---|---|---|---|---|---|---|
| La (%) | Ti (%) | Mg (%) | La/(Mg + Ti) | Mg/(Mg + Ti) | La (%) | Ti (%) | Mg (%) | La/(Mg + Ti) | Mg/(Mg + Ti) | |
| a Determined by SEM/EDS analysis. The error estimated for the SEM/EDS analysis is in the 1–5% range for all elements. b Determined by XPS analysis. The atomic composition of the surface layer (<5 nm) estimated with an error of ±5%. | ||||||||||
| LTMO-0 | 47.7 | 52.3 | 0.0 | 0.9 | 0.00 | 51.4 | 48.6 | 0.0 | 1.1 | 0.00 |
| LTMO-25 | 54.3 | 32.8 | 12.9 | 1.2 | 0.28 | 45.5 | 23.9 | 30.6 | 0.8 | 0.56 |
| LTMO-50 | 52.6 | 23.1 | 24.3 | 1.1 | 0.51 | 35.5 | 16.2 | 48.3 | 0.5 | 0.75 |
The as-prepared materials were analyzed by X-ray photoelectron spectroscopy (XPS) to gain deep insights into the surface properties of LTMO catalysts. The representative survey spectra of LTMO-0, LTMO-25, and LTMO-50 catalysts in Fig. 4(a) reveal the presence of the main peaks related to La, Ti, O, and C elements in all samples, with additional Mg 2s, Mg 2p, and Mg KLL Auger peak contributions in LTMO-25 and LTMO-50 catalysts. According to the surface composition determined by XPS and presented in Table 2, an Mg enrichment is observed in the surface in relation to bulk composition, which is responsible for relevant changes in the surface properties. The high-resolution O 1s spectra in Fig. 4(b) revealed the contributions of three main components at around 529.3, 531.2, and 533 eV, related to lattice oxygen (O2−), hydroxyl and carbonate groups (OH−/CO32−), and adsorbed water (OH2), respectively.33 The presence of hydroxyl and bidentate carbonate groups is frequently related to dissociative adsorption of H2O and adsorption of CO2 on the structural defects created by oxygen vacancies.34,35 The increase in the ratio of hydroxyl/carbonate oxygen and lattice oxygen (AOH/CO3/AO2−) from 2.10 in LTMO-0 to 2.54 and 2.63 in LTMO-25 and LTMO-50, respectively, indicates the generation of a high density of extra oxygen vacancies36 in the surface of Mg-doped perovskite-based catalysts. Additionally, a shift to lower binding energies was noted by increasing the Mg content on the catalysts, probably associated with the contribution of O–Mg2+ in the structure, since it is known that lattice oxygen on magnesium oxides has a lower binding energy (∼529.4 eV (ref. 37)) than that on the corresponding titanium oxides (∼530 eV (ref. 38)).
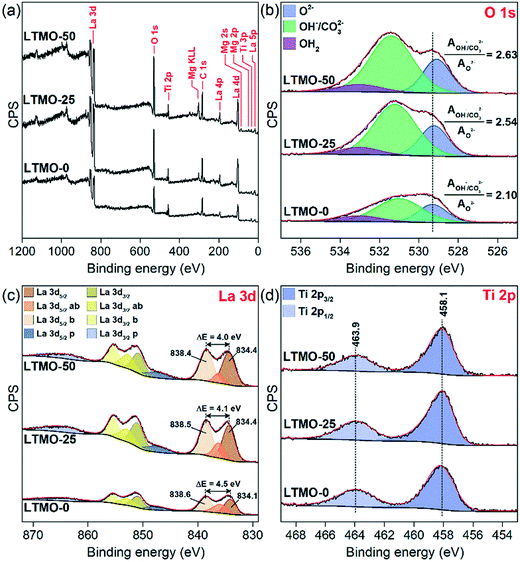 | ||
| Fig. 4 XPS spectra of LTMO catalysts. (a) Survey scan, (b) O 1s level, (c) La 3d level, and (d) Ti 2p level. | ||
The La 3d spectra in Fig. 4(c) show four peak contributions for each spin-orbit component (3d5/2 and 3d3/2): two main peaks (dark yellow and dark orange) corresponding to 3d94f0 occupation, four peaks (yellow, light yellow, orange, and light orange) corresponding to bonding (b) and antibonding (ab) satellites due to charge transfer 3d94f1L, and two plasmon (p) peaks (blue and light blue).39 The magnitude (ΔE) of multiplet splitting between the main and the satellite peaks in the La 3d spectra strongly depends on the type of lanthanum compounds, with typical values of 4.6, 3.9, and 3.5 eV, for pure La2O3, La(OH)3, and La2(CO3)3, respectively.40 In our catalysts, we noticed a decrease in ΔE from 4.5 eV in LTMO-0 to 4.1 and 4.0 eV in LTMO-25 and LTMO-50, respectively, indicating that the presence of Mg is inducing the increase of hydroxyl and carbonate formation close to La3+ in the structure. Considering the changes evidenced by O 1s and La 3d spectra, and since no considerable changes are noted in Ti coordination with Mg addition to the structure, as shown by Ti 2p spectra in Fig. 4(d), extra oxygen defect sites created in the structure are probably occurring preferentially in the Mg–O–La interface than in the Ti–O–La or Mg–O–Ti interface.
The TEM/EDS images of LTMO catalysts in Fig. 5 show irregular aggregates of variable particle sizes, which reach 1 μm in length. The polymerized complexing method exerts no influence on the morphology of the synthesized materials, which is consistent with the acquired images. In addition, at higher calcination temperatures, the degree of agglomeration increased and led to the formation of larger particles. However, this synthesis method enables a more homogeneous dispersion of the cations in the structure,41 which is essential for obtaining a more uniform Mg substitution. The images revealed a good dispersion of La, Ti, and Mg cations in the catalyst lattice, confirming such expectations.
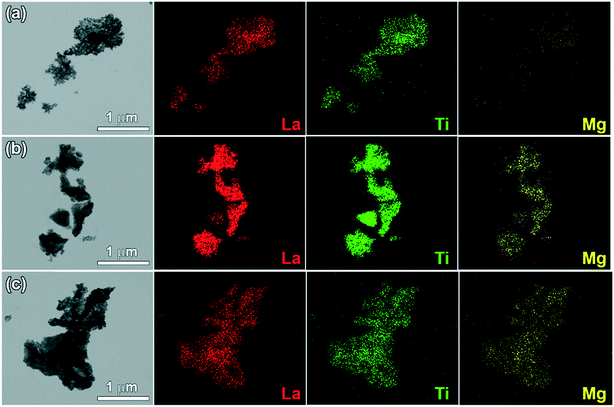 | ||
| Fig. 5 TEM/EDS mapping images of (a) LTMO-0, (b) LTMO-25 and (c) LTMO-50 catalysts. Red dots refer to La cations, green dots refer to Ti cations, and yellow dots refer to Mg cations. | ||
The specific surface areas obtained by the BET method were 9, 12, and 5 m2 g−1 for LTMO-0, LTMO-25, and LTMO-50, respectively, which agree with the results obtained by similar synthesis methods.42,43
CO2-TPD analyses were performed between 30 °C and 800 °C towards investigating the consequences of surface changes induced by Mg addition in the basicity of catalysts. The desorption profiles are shown in Fig. 6, and the quantitative data of the basic-site distributions are shown in Table 3. The strength of the basic sites may be assigned to three different categories according to the CO2-desorption temperature ranges. Desorption below 300 °C, in the 300–500 °C range and above 500 °C can be associated with weak, moderate, and strong basic sites, respectively.
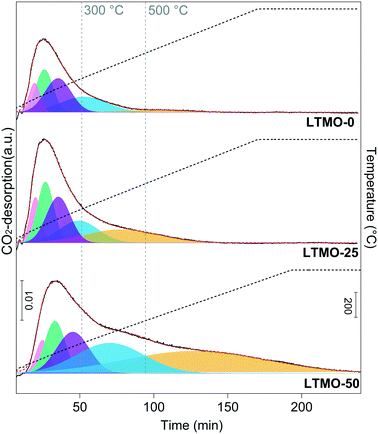 | ||
| Fig. 6 CO2-TPD profile of pure and Mg-substituted catalysts. The basic-site strength is assigned as weak (desorption below 300 °C), moderate (in the 300 to 500 °C range), and strong (above 500 °C). | ||
As shown in Fig. 6, the total amount of basic sites increases with the Mg load in the catalysts mainly due to the moderate and strong sites. Table 3 shows that the weak basic sites decrease from 71.3% to 39.9%, and the moderate and strong basic sites increase from 28.7% to 60.1% for LTMO-0 and LTMO-50, respectively. The strength of the basic sites can exert a stronger influence on the catalyst performance than their total amount. Weak sites show a weaker interaction for C–H bond cleavage than moderate and strong sites, while the latter may exhibit a high level of poisoning during the reaction with the formation of CO2 as a by-product.44 Therefore, catalysts with a higher amount of moderate sites in their surface show advantages regarding the OCM.45 Among the catalysts tested, the amount of moderate basic sites increases with the Mg amount; LTMO-50 is the most promising catalyst, with 19.5 mmol g−1 of basic sites with moderate strength.
Although the presence of basic sites is directly associated with catalytic activity in the OCM,29,44–47 recent studies48,49 revealed that molecular and electronic structural properties induced by changes in the surface of catalysts are determinant for improving C2 selectivity, and basicity is not necessarily the controlling factor. For example, Kiani et al.48 recently showed that the less basic NaWOx–SiO2 catalyst, with a Na/W ratio of 0.4, is more selective to C2 compounds (∼71%) when compared to catalysts with a Na/W ratio of 2.0, which achieved a C2 selectivity of ∼58%. In the case of LTMO catalysts presented in this work, the differences in the total amount and strength distribution of the basic sites are consistent with the changes in the active-site distribution promoted by Mg addition as shown in XPS analyses, indicating that the restructuring of the surface is directly affecting basicity, allowing a direct correlation between these properties and catalytic data. The additional oxygen-defect sites, identified mainly in the Mg–O–La interface by XPS, are probably promoting the increase of CO2 adsorbed to form bidentate carbonates on these sites, which are desorbing on moderate and high temperatures as evidenced by TPD profiles.
Infrared spectroscopy analyses checked the influence of the Mg insertion on the metal–oxygen bond strength of the catalyst structure. A weaker metal–oxygen bond results in lower energy for oxygen removal, which enhances catalyst activity. Fig. 7(a) and (b) show the infrared spectra of pure and Mg-substituted catalysts. According to Souza et al., the band with a low intensity at approximately 1480 cm−1 may be attributed to carbonates.50 The bands around 1630 cm−1 and 3500 cm−1 correspond to the O–H bond.50 These vibration bands can be related to water adsorbed on the surface of the material. According to Furuya,51 for complex perovskite structures, the bands around 200–800 cm−1 can be attributed to vibration modes related to the B site cations of the perovskite structure and oxygen. For LTMO-0, the band at 466 cm−1 is assigned to the Ti–O bending vibration.52 It should be noted that there is a redshift of this band (to 455 and 449 cm−1) with the addition of Mg, indicating a weakening in the M–O (metal–oxygen) bond strength.53 The bands at 553, 624, and 779 cm−1, observed for LTMO-0, are assigned to Ti–O stretching vibration.52 For LTMO-25 and LTMO-50, a single band is observed at 611 and 607 cm−1, respectively. Such a spectral alteration is achieved by a change in the active vibration modes of the M–O bond due to the contribution of Ti–O and Mg–O bonds.51 Finally, the band at 624 cm−1 also shifts to lower wavenumbers.
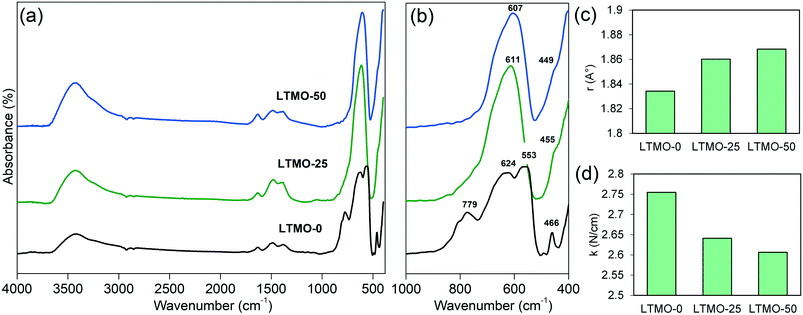 | ||
| Fig. 7 Infrared spectra of LTMO catalysts between (a) 4000–400 cm−1 and (b) 1000–400 cm−1 range. (c) Average bond length and (d) bond force constant of M–O for LTMO catalysts. | ||
The bond force constant (k) and average bond length (r) were calculated using eqn (6)–(8)52 towards quantifying the influence of the Mg insertion on the weakening of M–O.
 | (6) |
 | (7) |
 | (8) |
The calculated bond force constant and average bond length for LTMO catalysts are shown in Fig. 7(c) and (d). A decrease in the bond force constant, from 2.75 N cm−1 to 2.64 and 2.61 N cm−1 was observed for LTMO-0, LTMO-25 and LTMO-50, respectively. Moreover, the average bond length increased from 1.83 Å to 1.86 and 1.87 Å as the Mg amount in the catalysts increased.
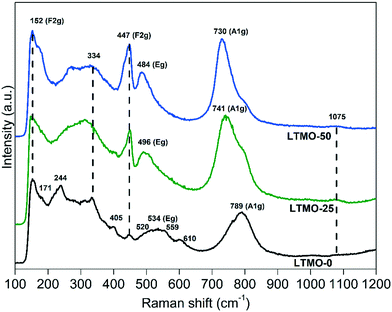
Fig. 8 displays the Raman spectra for pure and Mg-substituted catalysts. LTMO-0 shows more active Raman modes, theoretically calculated, than LTMO-25 and LTMO-50 (36 active modes for LTMO-0 and 24 active modes for LTMO-25 and LTMO-50).45,54 Such a difference is shown in the spectral alteration for the Mg-substituted catalysts compared to the pure one, as seen in Fig. 8. The bands at 334, 405, 447, 520, 534, 559, 610, and 793 cm−1 in the pure catalyst are typical of layered perovskite structure La2Ti2O7.45 The bands at 171, 244, and 334 cm−1 are most probably related to La–O bond vibration, whereas 152, 447, 534, 610 and 789 cm−1 may be assigned to O–Ti–O stretching bond vibration.45,55 The band at 1075 cm−1 can be attributed to lanthanum carbonate mode.56 The more prominent presence of this band in LTMO-25 and LTMO-50 is in agreement with the XPS data (see Fig. 4), which indicated an increase in the presence of surface carbonate groups close to La atoms by Mg addition.
The Raman spectra show four bands with F2g, Eg, and A1g modes.57 The higher frequency modes, A1g (789 cm−1) and Eg (534 cm−1), are assigned to symmetric and antisymmetric breathing of oxygen octahedra, respectively, whereas the lower frequency modes (152 and 447 cm−1) are assigned to F2g related to oxygen atoms perpendicular to O–B–O bonds.57
For Mg-substituted catalysts, the bands assigned to Eg and A1g modes show a shift to lower frequencies due to the increase in the Mg amount. The Eg mode shifts from 534 cm−1 for LTMO-0 to 496 and 484 cm−1 for LTMO-25 and LTMO-50, respectively. Similar behavior is observed for the A1g mode, which shifts from 789 cm−1 to 741 and 730 cm−1. This result is consistent with the data obtained by infrared spectroscopy and indicates a weakening in the M–O bond strength influenced by Ti4+ and Mg2+ cations' interaction. In addition, a residual pure TiO6 mode can be seen at 789 cm−1, with decreasing intensity as the Mg amount increases.
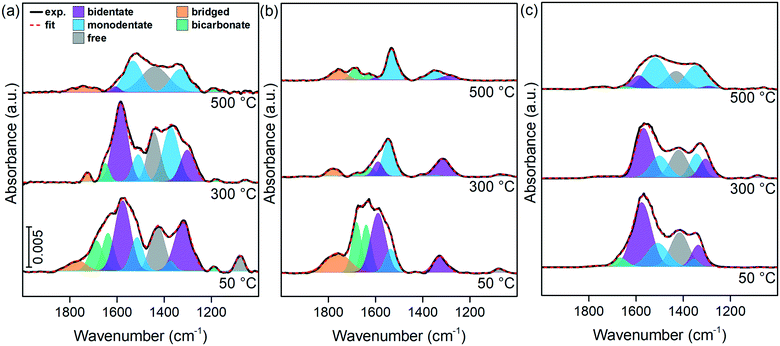
The distinction among different surface oxygen species was studied by in situ DRIFTS. The spectra of LTMO after CO2 chemisorption were performed at different temperatures, and the results are presented in Fig. 9. During chemisorption, the oxide and hydroxide sites interact with CO2 molecules to form carbonate and bicarbonate structures, respectively.58 The carbonate structures may appear coordinated in several ways to the catalyst surface depending on the active site they show. The mono- and bidentate carbonates are the most important structures formed from the CO2 interaction with basic oxide sites.59
A coordinated carbonate shows lower molecular symmetry than free carbonate ion, which causes a split in the 1415 cm−1 band assigned to the C![[double bond, length as m-dash]](https://www.rsc.org/images/entities/char_e001.gif) O symmetrical stretching vibration. As bidentate carbonates are produced on less basic surfaces than monodentate carbonates and generate larger splits, a correlation between the split values and the strength of the basic site can be established.59
O symmetrical stretching vibration. As bidentate carbonates are produced on less basic surfaces than monodentate carbonates and generate larger splits, a correlation between the split values and the strength of the basic site can be established.59
The analysis of the spectra (Fig. 9) identified the following bands: symmetric stretching of monodentate carbonate species (νs) at 1370 cm−1 and antisymmetric stretching (νas) at 1515 cm−1, bidentate carbonate species (νs) at 1315 cm−1 and (νas) at 1578 cm−1, bridged carbonate species (νas) at 1722 cm−1, bicarbonate species (νs) at 1420 cm−1, (νas) at 1620 cm−1, and O–H bending vibration (γOH) at 1184 cm−1. The band at 1420 cm−1 can also be assigned to free carbonate species (νas), similarly to the band at 1078 cm−1 (νs).60,61
The spectra show differences in the distribution of the bands due to temperature and composition. All spectra collected at the highest temperature also show several bands related to chemisorbed CO2. This result agrees with data from CO2-TPD and indicates the presence of moderate and strong basic sites on the catalyst surface.
When chemisorption was carried out at 50 °C, the resulting spectra showed predominant contributions of bands related to bidentate carbonates. The increase in the CO2 chemisorption temperature led to a decrease in their intensity, and the monodentate carbonate related bands increased their relative areas. At 500 °C, monodentate carbonates are the dominant species in the spectra. These changes in the spectra are probably caused by the breakage of one of the carbonate structure bonds as the thermal energy increases, thus forming monodentate carbonates from bidentate ones.59
Bicarbonate bands were formed at a lower intensity than carbonate bands and decreased the intensity as the temperature increased. The band at 1184 cm−1, observed for LTMO-0 (Fig. 9(a)), disappeared for LTMO-25 (Fig. 9(b)) and all the bands assigned to bicarbonate species disappeared for LTMO-50 (Fig. 9(c)), which implies that no hydroxyl group is present on this catalyst surface. Free and bridged carbonate bands were formed at a lower intensity than the former bands and decreased significantly as the temperature increased.
The split values for monodentate carbonate bands were evaluated by in situ DRIFTS after CO2 chemisorption at 500 °C. The shift length decreased from 200 cm−1 to 181 and 172 cm−1 for LTMO-0, LTMO-25, and LTMO-50, respectively. These results, associated with CO2-TPD data, confirmed the relevant changes in properties caused by the enrichment of the LaTi1−xMgxO3+δ surface with Mg. This Mg enrichment generated additional active sites in the La–O–Mg interface responsible for stabilizing CO2 at high temperatures, keeping the same coordination with the surface but different bond strengths.
Catalytic performance in oxidative coupling of methane
Table 4 shows the catalytic performance of LTMO over the OCM reaction. Results are given as methane conversion (XCH4%), C2 selectivity (SC2%), COX selectivity (SCOx%), C2H4/C2H6 ratio, and CO/CO2 ratio. All catalytic tests of this work showed complete O2 conversion. The results follow the order LTMO-50 > LTMO-25 > LTMO-0. LTMO-50 showed 25.3% methane conversion and 45.1% C2 selectivity, a higher ratio of C2H4/C2H6 formed, and a smaller CO/CO2 one. In contrast, LTMO-0 showed the worst catalytic performance, with 21.6% methane conversion and 39.1% selectivity to C2 products.| Catalysts | X CH4 (%) | S C2 (%) | S COx (%) | C2H4/C2H6 | CO/CO2 |
|---|---|---|---|---|---|
Reaction conditions: T = 800 °C, CH4/O2 = 3.5, WHSV = 30![[thin space (1/6-em)]](https://www.rsc.org/images/entities/char_2009.gif) 000 mL gcat−1 h−1 and t = 5 h. 000 mL gcat−1 h−1 and t = 5 h.
|
|||||
| LTMO-0 | 21.6 ± 0.1 | 39.1 ± 0.7 | 57.8 ± 0.3 | 1.35 ± 0.01 | 0.21 ± 0.01 |
| LTMO-25 | 25.0 ± 0.2 | 43.2 ± 0.6 | 52.5 ± 0.5 | 1.58 ± 0.02 | 0.25 ± 0.02 |
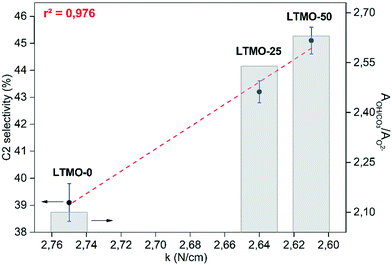
| LTMO-50 | 25.3 ± 0.1 | 45.1 ± 0.5 | 48.1 ± 0.1 | 1.77 ± 0.16 | 0.16 ± 0.01 |
Better catalytic performance for LTMO-50 can be related to the changes in the catalyst surface observed in the XPS analysis. An Mg-enriched surface and an increase in the number of oxygen vacancies created a more reactive surface for the OCM reaction. Derk et al. and Cheng et al.62,63 showed, via DFT studies, that lower energies for hydrogen abstraction of the C–H bond are obtained with the increase of the number of oxygen vacancies. In addition, Bai et al. and Kiani et al. show correlations between better C2 selectivity and a surface enriched with cations with basic intrinsic properties (Sr2+ and Na+, respectively)48,64
In addition, LTMO-50 activity can also be related to changes in the amount and strength of the basic sites with an increase of Mg loading, as shown in several recent studies.45,47,64 The modifications in the active-site basicity can be caused by changes in the catalyst surface, especially the M–O lower binding force. The decrease of the bond force constant, as evidenced by XPS, FTIR, and Raman analysis, can be seen as an increase in the ionic degree of the metal–oxygen bond. According to Fajans' rules,65 cations with a higher oxidation state and smaller ionic radii show greater polarizing power. When bonds with the same anion are compared, the polarizing power of the respective cations is responsible for the degree of covalence of the bond. Given that Ti4+ has an ionic radius smaller than that of Mg2+, it can be concluded that the insertion of Mg, partially replacing Ti, decreased the global polarizing power of the catalyst bonds. Thus, the ionic nature of these bonds increases and the electronic density is shifted towards the most electronegative atom, i.e., the oxygen. As a consequence, the active site becomes more basic due to the higher electron availability and thus more susceptible to C2 formation.
Thus, a correlation was established between C2 selectivity, the bond force constant, and the ratio of hydroxyl/carbonate oxygen and lattice oxygen (AOH/CO3/AO2−) (see Fig. 10). The bond force constant (obtained from M–O stretching bands) showed a linear correlation with C2 selectivity and r2 = 0.976. In addition, the AOH/CO3/AO2− also showed a linear correlation with the bond force constant and r2 = 0.996 (see Fig. S1†). The results strongly suggest a causal effect of the M–O bonding strength to increase the number of oxygen vacancies on the catalyst surface and, consequently, the C2 selectivity. Further evaluations must be conducted towards the understanding of the extent of this effect on the OCM results.
In Table 5 are shown the results of LTMO-50 and its respective pure oxides in the OCM reaction. A physical mixture (PM) of La2O3, TiO2, and MgO oxides in the 2![[thin space (1/6-em)]](https://www.rsc.org/images/entities/char_2009.gif) :
:![[thin space (1/6-em)]](https://www.rsc.org/images/entities/char_2009.gif) 1
1![[thin space (1/6-em)]](https://www.rsc.org/images/entities/char_2009.gif) :
:![[thin space (1/6-em)]](https://www.rsc.org/images/entities/char_2009.gif) 1 molar proportion was also tested for reproducing the amount of each cation in LTMO-50. The reaction conditions employed were T = 800 °C, CH4/O2 = 3.5, WHSV = 30
1 molar proportion was also tested for reproducing the amount of each cation in LTMO-50. The reaction conditions employed were T = 800 °C, CH4/O2 = 3.5, WHSV = 30![[thin space (1/6-em)]](https://www.rsc.org/images/entities/char_2009.gif) 000 mL gcat−1 h−1 and t ≅ 5 h. Details of the synthesis method and characterization performed for pure oxides are provided in the ESI† (see Fig. S2).
000 mL gcat−1 h−1 and t ≅ 5 h. Details of the synthesis method and characterization performed for pure oxides are provided in the ESI† (see Fig. S2).
| Catalysts | X CH4 (%) | S C2 (%) | S COx (%) | C2H4/C2H6 | CO/CO2 |
|---|---|---|---|---|---|
Reaction conditions: T = 800 °C, CH4/O2 = 3.5, WHSV = 30![[thin space (1/6-em)]](https://www.rsc.org/images/entities/char_2009.gif) 000 mL gcat−1 h−1 and t ≅ 5 h.
a The catalyst prepared by a physical mixture of La2O3, TiO2, and MgO oxides in the 2 000 mL gcat−1 h−1 and t ≅ 5 h.
a The catalyst prepared by a physical mixture of La2O3, TiO2, and MgO oxides in the 2![[thin space (1/6-em)]](https://www.rsc.org/images/entities/char_2009.gif) : :![[thin space (1/6-em)]](https://www.rsc.org/images/entities/char_2009.gif) 1 1![[thin space (1/6-em)]](https://www.rsc.org/images/entities/char_2009.gif) : :![[thin space (1/6-em)]](https://www.rsc.org/images/entities/char_2009.gif) 1 molar proportion. 1 molar proportion.
|
|||||
| La2O3 | 23.7 | 34.5 | 57.9 | 1.21 | 0.19 |
| TiO2 | 15.0 | 11.8 | 37.5 | 0.76 | 2.46 |
| MgO | 10.2 | 28.4 | 43.8 | 0.90 | 2.89 |
| PMa | 22.8 | 33.8 | 60.4 | 1.15 | 0.24 |
| LTMO-50 | 25.3 | 45.1 | 48.1 | 1.77 | 0.16 |
La2O3 showed a catalytic activity similar to that of LTMO-50, with close methane conversion, whereas TiO2 and MgO showed less meaningful results. The methane conversion for the PM catalyst was close to those of La2O3, which shows that this cation exerts some influence on the methane activation. Regarding C2 selectivity, LTMO-50 was above 10% more selective than the pure oxides and showed more favorable C2H4/C2H6 and CO/CO2 ratios. All catalysts showed a stable activity under OCM conditions during the tests (see Fig. S3†).
The LTMO-50 catalyst was tested in different reaction conditions for improving the C2 selectivity results. The CH4/O2 feed ratio, the weight hourly space velocity (WHSV) of reactants, and reaction temperature were varied, as shown in Table 6. First, the CH4/O2 feed ratio effect was studied, while the reaction temperature and WHSV were kept constant (T = 800 °C and WHSV = 30![[thin space (1/6-em)]](https://www.rsc.org/images/entities/char_2009.gif) 000 mL gcat−1 h−1). The CH4/O2 feed ratio was varied from the stoichiometric ratio (CH4/O2 = 2) until a condition with methane excess (CH4/O2 = 8). A new parameter, i.e., the number of moles of CH4 consumed for each mole of O2 converted (CH4/O2conv.), was included in the results.
000 mL gcat−1 h−1). The CH4/O2 feed ratio was varied from the stoichiometric ratio (CH4/O2 = 2) until a condition with methane excess (CH4/O2 = 8). A new parameter, i.e., the number of moles of CH4 consumed for each mole of O2 converted (CH4/O2conv.), was included in the results.
| CH4/O2 | WHSV (mL gcat−1 h−1) | T (°C) | X CH4 (%) | CH4/O2conv. | S C2 (%) | S COx (%) | C2H4/C2H6 | CO/CO2 |
|---|---|---|---|---|---|---|---|---|
| 2.0 | 30![[thin space (1/6-em)]](https://www.rsc.org/images/entities/char_2009.gif) 000 000 |
800 | 32.6 | 0.76 | 34.3 | 54.9 | 1.60 | 0.21 |
| 3.5 | 30![[thin space (1/6-em)]](https://www.rsc.org/images/entities/char_2009.gif) 000 000 |
800 | 25.3 | 0.87 | 45.1 | 48.1 | 1.77 | 0.16 |
| 5 | 30![[thin space (1/6-em)]](https://www.rsc.org/images/entities/char_2009.gif) 000 000 |
800 | 22.1 | 1.05 | 48.2 | 44.4 | 1.16 | 0.21 |
| 6.5 | 30![[thin space (1/6-em)]](https://www.rsc.org/images/entities/char_2009.gif) 000 000 |
800 | 19.4 | 1.26 | 49.4 | 35.6 | 1.06 | 0.23 |
| 8 | 30![[thin space (1/6-em)]](https://www.rsc.org/images/entities/char_2009.gif) 000 000 |
800 | 17.3 | 1.40 | 51.4 | 30.7 | 0.97 | 0.23 |
| 8 | 18![[thin space (1/6-em)]](https://www.rsc.org/images/entities/char_2009.gif) 000 000 |
800 | 14.9 | — | 45.7 | 37.6 | 1.19 | 0.27 |
| 8 | 24![[thin space (1/6-em)]](https://www.rsc.org/images/entities/char_2009.gif) 000 000 |
800 | 16.8 | — | 42.8 | 32.9 | 1.18 | 0.23 |
| 8 | 36![[thin space (1/6-em)]](https://www.rsc.org/images/entities/char_2009.gif) 000 000 |
800 | 16.5 | — | 46.8 | 31.1 | 1.21 | 0.37 |
| 8 | 30![[thin space (1/6-em)]](https://www.rsc.org/images/entities/char_2009.gif) 000 000 |
700 | 16.3 | — | 38.0 | 36.7 | 0.64 | 0.31 |
| 8 | 30![[thin space (1/6-em)]](https://www.rsc.org/images/entities/char_2009.gif) 000 000 |
750 | 17.3 | — | 45.4 | 31.5 | 0.80 | 0.22 |
| 8 | 30![[thin space (1/6-em)]](https://www.rsc.org/images/entities/char_2009.gif) 000 000 |
850 | 19.3 | — | 37.2 | 30.4 | 2.52 | 0.40 |
| 8 | 30![[thin space (1/6-em)]](https://www.rsc.org/images/entities/char_2009.gif) 000 000 |
900 | 21.9 | — | 19.3 | 33.0 | 10.11 | 0.93 |
Table 6 shows the methane conversion decreases with less amount of oxygen fed, as expected. The O2 fed acts on the regeneration of catalyst-surface vacancies via the Eley–Rideal mechanism, thus creating active sites for the cleavage of the C–H bond during the methane activation.8 On the other hand, CH4/O2conv increases when the O2 fed is limited, and the conversion approaches the stoichiometric ratio of the reaction (CH4/O2 = 2). Such results show that the vacancy regeneration is more favored under O2-limited conditions than other reaction paths that depend on O2 (gas-phase reactions, deeper oxidation of the C2 products to CO and CO2, etc.).4 If deep oxidation becomes less favored, the C2 selectivity increases as a function of the limitation of O2 available. Moreover, reactions for the production of ethane and ethylene demand less O2 than those for CO and CO2 formation, as shown in eqn (9) and (10) in comparison to eqn (1) and (2). However, the C2H4/C2H6 ratio decreased, probably due to the reduction in the ethyl radical formation. This radical is an intermediate for ethylene formation and depends on the O2 available in the gas phase.66
 | (9) |
| CH4 + 2 O2 → CO2 + 2 H2O | (10) |
A reaction performed at WHSV = 30![[thin space (1/6-em)]](https://www.rsc.org/images/entities/char_2009.gif) 000 mL gcat−1 h−1, CH4/N2 = 8 feed ratio, T = 800 °C, and without fed oxidant was planned to evaluate the effect of O2 feed limitation on the catalytic activity. No methane conversion was detected, which indicates that the lattice oxygen species did not contribute to the start of the OCM reaction for LTMO-50, and oxygen supply from an external source is required. Therefore, the lower the amount of oxygen feed, the greater the C2 selectivity; however, it seriously compromises the methane conversion.
000 mL gcat−1 h−1, CH4/N2 = 8 feed ratio, T = 800 °C, and without fed oxidant was planned to evaluate the effect of O2 feed limitation on the catalytic activity. No methane conversion was detected, which indicates that the lattice oxygen species did not contribute to the start of the OCM reaction for LTMO-50, and oxygen supply from an external source is required. Therefore, the lower the amount of oxygen feed, the greater the C2 selectivity; however, it seriously compromises the methane conversion.
The influence of variations in WHSV on the catalyst activity was also evaluated, as shown in Table 6. Reactions were performed at T = 800 ° C, CH4/O2 = 8, and WHSV ranged between 18![[thin space (1/6-em)]](https://www.rsc.org/images/entities/char_2009.gif) 000 and 36
000 and 36![[thin space (1/6-em)]](https://www.rsc.org/images/entities/char_2009.gif) 000 mL gcat−1 h−1. The results show no significant variation in methane conversion and C2 selectivity with the WHSV increasing. Similar behavior was previously reported for OCM and oxidative dehydrogenation (ODH) of ethane.67,68 Stansch et al. reported that methane conversion remained constant with contact time when complete oxygen conversion was achieved.68 The same trend was observed in Table 6, in which the oxygen conversion was complete even at the lowest WHSV values. The small influence of WHSV variation on C2 selectivity may be due to the homogeneous step of the OCM mechanism,67 which is a fast kinetic reaction and independent of contact time once the radical chain reaction is initiated.
000 mL gcat−1 h−1. The results show no significant variation in methane conversion and C2 selectivity with the WHSV increasing. Similar behavior was previously reported for OCM and oxidative dehydrogenation (ODH) of ethane.67,68 Stansch et al. reported that methane conversion remained constant with contact time when complete oxygen conversion was achieved.68 The same trend was observed in Table 6, in which the oxygen conversion was complete even at the lowest WHSV values. The small influence of WHSV variation on C2 selectivity may be due to the homogeneous step of the OCM mechanism,67 which is a fast kinetic reaction and independent of contact time once the radical chain reaction is initiated.
The effect of the reaction temperature, which ranged between 700 and 900 °C, was evaluated (see Table 6) at WHSV = 30![[thin space (1/6-em)]](https://www.rsc.org/images/entities/char_2009.gif) 000 mL gcat−1 h−1 and CH4/O2 = 8 feed ratio. The methane conversion increased with the reaction temperature due to the higher energy available for the breakage of the C–H bond. However, the C2 selectivity reached a maximum at T = 800 °C. The C2 formation decreasing is a consequence of the energetic favoring of endothermic reactions at higher temperatures, such as methane reforming (as shown in eqn (11)–(13)).69 Another sign of syngas formation is the CO/CO2 ratio increase between 800 and 900 °C.
000 mL gcat−1 h−1 and CH4/O2 = 8 feed ratio. The methane conversion increased with the reaction temperature due to the higher energy available for the breakage of the C–H bond. However, the C2 selectivity reached a maximum at T = 800 °C. The C2 formation decreasing is a consequence of the energetic favoring of endothermic reactions at higher temperatures, such as methane reforming (as shown in eqn (11)–(13)).69 Another sign of syngas formation is the CO/CO2 ratio increase between 800 and 900 °C.
| CH4 + H2O → CO + 3 H2 ΔH° = 206 kJ mol−1 | (11) |
| CH4 + CO2 → 2 CO + 2 H2 ΔH° = 247 kJ mol−1 | (12) |
 | (13) |
In contrast, the C2H4/C2H6 ratio increases from 0.64 to 10.11 as the temperature increases, probably due to the ODH reaction, i.e., a parallel reaction that can occur in the same catalytic reactor of OCM, in which C2H6 is converted into C2H4 by a dehydrogenative route. However, its contribution is more evident at higher temperatures because its optimum condition is approximately 50–100 ° C higher than that of the OCM reaction. The ODH is a good complement for the OCM in industrial applications since it promotes a higher selectivity towards ethylene and reduces the capital investment for its purification.15 The results for the LTMO-50 catalyst under optimized conditions – in which the highest C2 selectivity was achieved – are relevant compared with perovskite-based catalysts previously reported in the literature (Table S1†). Along with those in Ivanov's work,23 which uses catalysts based on Sr and Ti, the LTMO-50 catalyst presented one of the best C2 selectivities for this class of materials working under acceptable reaction conditions. Among the perovskite-type materials based on lanthanum, LTMO-50 showed the best specific productivities in mol of C2 compounds formed by mass (molC2 g−1 h−1) or surface area units (molC2 m−2 h−1) of catalyst. Thereby, it can be concluded that modifications in the catalyst composition and the reaction conditions showed positive effects for better applicability of the structure in the OCM reaction.
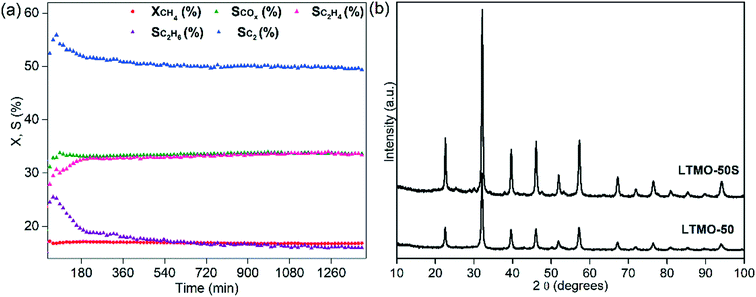
Finally, the optimized reaction conditions for a higher C2 selectivity (WHSV = 30![[thin space (1/6-em)]](https://www.rsc.org/images/entities/char_2009.gif) 000 mL gcat−1 h−1, CH4/O2 = 8 feed ratio and T = 800 °C) were tested in a 24 h reaction for the evaluation of LTMO-50 stability (see Fig. 11(a)). Throughout the analysis time, the catalyst showed high stability, with the methane conversion remaining practically constant, despite the catalyst being exposed to harsh catalytic conditions for an extended period. The COX selectivity also remained consistent (approximately 33%) throughout the 24 h. The C2 selectivity slightly decreased in the first 3 h of reaction (from 55% to 52%) and remained at around 50% until the end of the 24 h. Similar behavior was observed for the ethane selectivity, which decreased more drastically over the first 3 h (from 26% to 19%) and reached 16% at the end of the test.
000 mL gcat−1 h−1, CH4/O2 = 8 feed ratio and T = 800 °C) were tested in a 24 h reaction for the evaluation of LTMO-50 stability (see Fig. 11(a)). Throughout the analysis time, the catalyst showed high stability, with the methane conversion remaining practically constant, despite the catalyst being exposed to harsh catalytic conditions for an extended period. The COX selectivity also remained consistent (approximately 33%) throughout the 24 h. The C2 selectivity slightly decreased in the first 3 h of reaction (from 55% to 52%) and remained at around 50% until the end of the 24 h. Similar behavior was observed for the ethane selectivity, which decreased more drastically over the first 3 h (from 26% to 19%) and reached 16% at the end of the test.
The ethylene selectivity, however, showed a different behavior over time. During the first 3 h, it increased from 29% to 33% and reached 34% at the end of the test. The results indicate that the catalytic system may require at least 3 h to stabilize. This effect may be due to the activation process of the chain-reaction mechanism, which is the slower step of the process and must occur twice (methane and ethane activation) to form ethylene.
After the 24 h test, the LTMO-50S catalyst was analyzed to verify changes in the crystalline structure, as shown in Fig. 11(b). Its diffraction patterns were maintained after the catalytic test, with no bands attributable to the coke or pure oxide phases. However, an increase in crystallinity was observed compared to LTMO-50 due to the agglomeration of the catalyst particles after exposure to the reaction temperature for an extended period. Table 1 shows the average crystallite sizes of these two catalysts obtained by Rietveld refinement. According to the results, after exposure to reaction conditions, the average crystallite size increased from 23.7 ± 0.9 to 26.4 ± 0.7 nm. The result of the elemental analyses indicates the formation of 7.8 × 10⁻² μmolC gcat−1 h−1 (or approximately 1 μgC gcat−1 h−1). The amount of coke formed was minimal and evidenced the high stability of the catalyst over the reaction time.
Conclusion
LTMO (LaTi1−xMgxO3) catalysts were prepared and characterized for correlating their physical–chemical properties to their activity in the OCM reaction. Surface analysis by XPS indicated an enrichment of Mg in the surface in relation to nominal and bulk compositions. The presence of high amounts of Mg on the surface increased the incidence of defective sites in the interface formed by La–O–Mg. The distinct surface properties resulted from the insertion of Mg in the structure and directly affected the total basicity of the catalysts, especially concerning strong and moderate strength sites, as evidenced by CO2-TPD analysis. Changes in the amount of oxygen vacancy formation can be attributable to the decrease of the M–O bonding force, as demonstrated by XPS, FTIR, and Raman analysis. In addition, with the increase of Mg loading, the DRIFTS results presented spectra more restricted to mono- and bidentate carbonate bands, which significantly influence the OCM reaction. The catalytic activity follows the order LTMO-50 > LTMO-25 > LTMO-0, which is the same as that of the Mg amount increase. The study of the reaction conditions for LTMO-50 showed that the CH4/O2 feed ratio and the reaction temperature are important parameters for obtaining higher C2 selectivity. The best conditions were WHSV = 30![[thin space (1/6-em)]](https://www.rsc.org/images/entities/char_2009.gif) 000 mL gcat−1 h−1, CH4/O2 = 8 feed ratio and T = 800 °C, which achieved 51.4% C2 selectivity. Finally, LTMO-50 exhibits high thermal stability in the OCM reaction according to the 24 h stability test. Thus, although the La2Ti2O7 structure already has important characteristics for the OCM reaction, the Mg substitution allowed complementing and improving these features, which increased the performance of the catalyst. Similar behavior can be replicated for other catalyst structures that could use this strategy to enhance the physical–chemical properties of their active sites, leading to better C2 selectivity and ethylene formation.
000 mL gcat−1 h−1, CH4/O2 = 8 feed ratio and T = 800 °C, which achieved 51.4% C2 selectivity. Finally, LTMO-50 exhibits high thermal stability in the OCM reaction according to the 24 h stability test. Thus, although the La2Ti2O7 structure already has important characteristics for the OCM reaction, the Mg substitution allowed complementing and improving these features, which increased the performance of the catalyst. Similar behavior can be replicated for other catalyst structures that could use this strategy to enhance the physical–chemical properties of their active sites, leading to better C2 selectivity and ethylene formation.
Conflicts of interest
There are no conflicts to declare.Acknowledgements
The authors acknowledge the Sao Paulo Research Foundation (FAPESP, grants #2017/03623-0, #2015/06246-7 and #2018/12021-6) and the National Council for Scientific and Technological Development (CNPq, grant #304883/2016-6) for their financial support, and Professor Dr. Renato Lajarim Carneiro and Benedito Roberto de Alvarenga Junior for the micro-Raman analyses.References
- R. Horn and R. Schlögl, Catal. Lett., 2015, 145, 23–39 CrossRef CAS.
- S. Nahreen, S. Praserthdam, S. Perez Beltran, P. B. Balbuena, S. Adhikari and R. B. Gupta, Energy Fuels, 2016, 30, 2584–2593 CrossRef CAS.
- P. Schwach, X. Pan and X. Bao, Chem. Rev., 2017, 117, 8497–8520 CrossRef CAS.
- D. Kiani, S. Sourav, J. Baltrusaitis and I. E. Wachs, ACS Catal., 2019, 9, 5912–5928 CrossRef CAS.
- K. Takanabe, J. Jpn. Pet. Inst., 2012, 55, 1–12 CrossRef CAS.
- A. I. Olivos-Suarez, À. Szécsényi, E. J. M. Hensen, J. Ruiz-Martinez, E. A. Pidko and J. Gascon, ACS Catal., 2016, 6, 2965–2981 CrossRef CAS.
- A. Galadima and O. Muraza, J. Ind. Eng. Chem., 2016, 37, 1–13 CrossRef CAS.
- Y. Gambo, A. A. Jalil, S. Triwahyono and A. A. Abdulrasheed, J. Ind. Eng. Chem., 2018, 59, 218–229 CrossRef CAS.
- I. Kim, G. Lee, H. Bin Na, J. M. Ha and J. C. Jung, Mol. Catal., 2017, 435, 13–23 CrossRef CAS.
- V. I. Alexiadis, M. Chaar, A. van Veen, M. Muhler, J. W. Thybaut and G. B. Marin, Appl. Catal., B, 2016, 199, 252–259 CrossRef CAS.
- M. Albrecht, U. Rodemerck, D. Linke and E. V. Kondratenko, React. Chem. Eng., 2018, 3, 151–154 RSC.
- V. Lomonosov, Y. Gordienko, E. Ponomareva and M. Sinev, Chem. Eng. J., 2019, 370, 1210–1217 CrossRef CAS.
- C. Karakaya, H. Zhu, B. Zohour, S. Senkan and R. J. Kee, ChemCatChem, 2017, 9, 4538–4551 CrossRef CAS.
- Z. Li, L. He, S. Wang, W. Yi, S. Zou, L. Xiao and J. Fan, ACS Comb. Sci., 2017, 19, 15–24 CrossRef CAS.
- A. T. Penteado, M. Kim, H. R. Godini, E. Esche and J. Repke, Front. Chem. Sci. Eng., 2018, 12, 598–618 CrossRef CAS.
- V. R. Choudhary and B. S. Uphade, Catal. Surv. Asia, 2004, 8, 15–25 CrossRef CAS.
- Y. Mahmut, J. Ind. Eng. Chem., 2019, 76, 488–499 CrossRef.
- Y. Gordienko, T. Usmanov, V. Bychkov, V. Lomonosov, Z. Fattakhova, Y. Tulenin, D. Shashkin and M. Sinev, Catal. Today, 2016, 278, 127–134 CrossRef CAS.
- E. W. McFarland and H. Metiu, Chem. Rev., 2013, 113, 4391–4427 CrossRef CAS.
- B. L. Farrell, V. O. Igenegbai and S. Linic, ACS Catal., 2016, 6, 4340–4346 CrossRef CAS.
- J. Zhu, H. Li, L. Zhong, P. Xiao, X. Xu, X. Yang, Z. Zhao and J. Li, ACS Catal., 2014, 4, 2917–2940 CrossRef CAS.
- G. Lee, I. Kim, I. Yang, J. M. Ha, H. Bin Na and J. C. Jung, Appl. Surf. Sci., 2018, 429, 55–61 CrossRef CAS.
- D. V. Ivanov, L. A. Isupova, E. Y. Gerasimov, L. S. Dovlitova, T. S. Glazneva and I. P. Prosvirin, Appl. Catal., A, 2014, 485, 10–19 CrossRef CAS.
- S. Royer, D. Duprez, F. Can, X. Courtois, C. Batiot-Dupeyrat, S. Laassiri and H. Alamdari, Chem. Rev., 2014, 114, 10292–10368 CrossRef CAS.
- V. Fung, F. Polo-Garzon, Z. Wu and D. Jiang, Catal. Sci. Technol., 2018, 8, 702–709 RSC.
- F. Polo-Garzon, V. Fung, X. Liu, Z. D. Hood, E. E. Bickel, L. Bai, H. Tian, G. S. Foo, M. Chi, D. E. Jiang and Z. Wu, ACS Catal., 2018, 8, 10306–10315 CrossRef CAS.
- Z. Fakhroueian, F. Farzaneh and N. Afrookhteh, Fuel, 2008, 87, 2512–2516 CrossRef CAS.
- M. M. Milanova, M. Kakihana, M. Arima, M. Yashima and M. Yoshimura, J. Alloys Compd., 1996, 242, 6–10 CrossRef CAS.
- W. Jeon, J. Y. Lee, M. Lee, J. W. Choi, J. M. Ha, D. J. Suh and I. W. Kim, Appl. Catal., A, 2013, 464–465, 68–77 CrossRef CAS.
- F. X. Zhang, J. Lian, U. Becker, R. C. Ewing, L. M. Wang, J. Hu and S. K. Saxena, J. Solid State Chem., 2007, 180, 571–576 CrossRef CAS.
- S. Havelia, K. R. Balasubramaniam, S. Spurgeon, F. Cormack and P. A. Salvador, J. Cryst. Growth, 2008, 310, 1985–1990 CrossRef CAS.
- L. Gao, Z. Ma, S. Wang, F. Wang and C. Yang, Materials, 2014, 7, 4982–4993 CrossRef CAS.
- J. M. López, A. L. Gilbank, T. García, B. Solsona, S. Agouram and L. Torrente-Murciano, Appl. Catal., B, 2015, 174–175, 403–412 CrossRef.
- R. Schaub, P. Thostrup, N. Lopez, E. Lægsgaard, I. Stensgaard, J. K. Nørskov and F. Besenbacher, Phys. Rev. Lett., 2001, 87, 266104 CrossRef CAS.
- B. Liu, C. Li, G. Zhang, X. Yao, S. S. C. Chuang and Z. Li, ACS Catal., 2018, 8, 10446–10456 CrossRef CAS.
- N. I. Kim, Y. J. Sa, T. S. Yoo, S. R. Choi, R. A. Afzal, T. Choi, Y. S. Seo, K. S. Lee, J. Y. Hwang, W. S. Choi, S. H. Joo and J. Y. Park, Sci. Adv., 2018, 4, eaap9360 CrossRef.
- A. Le Febvrier, J. Jensen and P. Eklund, J. Vac. Sci. Technol., A, 2017, 35, 021407 CrossRef.
- A. Wiatrowski, M. Mazur, A. Obstarczyk, D. Wojcieszak, D. Kaczmarek, J. Morgiel and D. Gibson, Coatings, 2018, 8, 412 CrossRef.
- D. G. Popescu, N. Barrett, C. Chirila, I. Pasuk and M. A. Husanu, Phys. Rev. B: Condens. Matter Mater. Phys., 2015, 92, 235442 CrossRef.
- J. P. H. Li, X. Zhou, Y. Pang, L. Zhu, E. I. Vovk, L. Cong, A. P. Van Bavel, S. Li and Y. Yang, Phys. Chem. Chem. Phys., 2019, 21, 22351–22358 RSC.
- M. Kakihana and M. Yoshimura, Bull. Chem. Soc. Jpn., 1999, 72, 1427–1443 CrossRef CAS.
- K. Onozuka, Y. Kawakami, H. Imai, T. Yokoi, T. Tatsumi and J. N. Kondo, J. Solid State Chem., 2012, 192, 87–92 CrossRef CAS.
- Z. Wang, K. Teramura, S. Hosokawa and T. Tanaka, Appl. Catal., B, 2015, 163, 241–247 CrossRef CAS.
- F. Papa, D. Gingasu, L. Patron, A. Miyazaki and I. Balint, Appl. Catal., A, 2010, 375, 172–178 CrossRef CAS.
- J. Xu, Y. Zhang, X. Xu, X. Fang, R. Xi, Y. Liu, R. Zheng and X. Wang, ACS Catal., 2019, 7, 4030–4045 CrossRef.
- T. Jiang, J. Song, M. Huo, N. Yang, J. Liu, J. Zhang, Y. Sun and Y. Zhu, RSC Adv., 2016, 6, 34872–34876 RSC.
- R. Xi, J. Xu, Y. Zhang, Z. Zhang, X. Xu, X. Fang and X. Wang, Catal. Today, 2020 DOI:10.1016/j.cattod.2020.04.010 , in press.
- D. Kiani, S. Sourav, I. E. Wachs and J. Baltrusaitis, Catal. Sci. Technol., 2020, 10, 3334–3345 RSC.
- G. Koch, M. Hävecker, D. Teschner, S. J. Carey, Y. Wang, P. Kube, W. Hetaba, T. Lunkenbein, G. Auffermann, O. Timpe, F. Rosowski, R. Schlögl and A. Trunschke, ACS Catal., 2020, 10, 7007–7020 CrossRef CAS.
- A. E. Souza, S. R. Teixeira, C. M. Santos, W. H. Schreiner, P. N. L. Filho and E. Longoe, J. Mater. Chem. C, 2014, 2, 7056–7070 RSC.
- M. Furuya, J. Appl. Phys., 1999, 3, 1–6 Search PubMed.
- M. K. Trivedi, G. Nayak, S. Patil, R. M. Tallapragada, O. Latiyal and S. Jana, Ind. Eng. Manage., 2015, 4(3), 1000166 Search PubMed.
- X. Jim, D. Sun, M. Zhang, Y. Zhu and J. Qian, J. Electroceram., 2009, 285–290 Search PubMed.
- I. Levin, T. A. Vanderah, T. G. Amos and J. E. Maslar, Chem. Mater., 2005, 17, 3273–3280 CrossRef CAS.
- C. Chen, Z. Gao, H. Yan and M. J. Reece, J. Am. Ceram. Soc., 2016, 99, 523–530 CrossRef CAS.
- J. Cui and G. A. Hope, J. Spectrosc., 2015, 2015, 1–8 CrossRef CAS.
- G. S. Babu, V. Subramanian, V. R. K. Murthy, I.-N. Lin, C. Chia and H.-L. Liu, J. Appl. Phys., 2007, 102, 0–7 CrossRef CAS.
- T. W. Elkins, B. Neumann, M. Baumer and H. E. Hagelin-Weaver, ACS Catal., 2014, 4, 1972–1990 CrossRef CAS.
- G. Busca and V. Lorenzelli, Mater. Chem., 1982, 7, 89–126 CrossRef CAS.
- W. Su, J. Zhang, Z. Feng, T. Chen, P. Ying and C. Li, J. Phys. Chem. C, 2008, 112, 7710–7716 CrossRef CAS.
- R. J. Walker, A. Pougin, F. E. Oropeza, I. J. Villar-garcia, M. P. Ryan, J. Strunk and D. J. Payne, Chem. Mater., 2016, 28, 90–96 CrossRef CAS.
- A. R. Derk, B. Li, S. Sharma, G. M. Moore and E. W. Mcfarland, Catal. Lett., 2013, 143, 406–410 CrossRef CAS.
- Z. Cheng, L. Qin, M. Guo, M. Xu, J. A. Fan and L.-S. Fan, Phys. Chem. Chem. Phys., 2016, 18, 32418–32428 RSC.
- L. Bai, F. Polo-garzon, Z. Bao, S. Luo and B. M. Moskowitz, ChemCatChem, 2019, 11, 2107–2117 CrossRef CAS.
- K. Fajans, Degrees of Polarity and Mutual Polarization of Ions in the Molecules of Alkali Fluorides, SrO, and BaO, 1967 Search PubMed.
- J. H. Lunsford, Angew. Chem., Int. Ed. Engl., 1995, 34, 970–980 CrossRef CAS.
- P. Ciambelli, L. Lisi, R. Pirone, G. Ruoppolo and G. Russo, Catal. Today, 2000, 61, 317–323 CrossRef CAS.
- Z. Stansch, L. Mleczko and M. Baerns, Ind. Eng. Chem. Res., 1997, 36, 2568–2579 CrossRef CAS.
- A. Varma, A. S. Mukasyan, A. S. Rogachev and K. V. Manukyan, Chem. Rev., 2016, 116, 14493–14586 CrossRef CAS.
Footnote |
| † Electronic supplementary information (ESI) available: Synthesis procedure and characterization of pure oxide catalysts, detailed information on characterization procedures, catalyst performance in the OCM reaction. See DOI: 10.1039/d0cy01783c |
| This journal is © The Royal Society of Chemistry 2021 |

