
 Open Access Article
 This Open Access Article is licensed under a
 Creative Commons Attribution 3.0 Unported Licence
Advances in multiplexed techniques for the detection and quantification of microRNAs
Thomas
Jet
ab,
Guillaume
Gines
*b,
Yannick
Rondelez
 b and
Valérie
Taly
*a
b and
Valérie
Taly
*a
aCentre de Recherche des Cordeliers, INSERM, Sorbonne Université, Université de Paris, CNRS SNC5096, Equipe Labellisée Ligue Nationale Contre le Cancer, F-75006 Paris, France. E-mail: valerie.taly@parisdescartes.fr; Tel: +33 170 649 954
bLaboratoire Gulliver, UMR7083 CNRS, ESPCI Paris, Université Paris Sciences et Lettres, 10 Rue Vauquelin, 75005 Paris, France. E-mail: guillaume.gines@espci.fr
First published on 4th February 2021
Abstract
MicroRNA detection is currently a crucial analytical chemistry challenge: almost 2000 papers were referenced in PubMed in 2018 and 2019 for the keywords “miRNA detection method”. MicroRNAs are potential biomarkers for multiple diseases including cancers, neurodegenerative and cardiovascular diseases. Since miRNAs are stably released in bodily fluids, they are of prime interest for the development of non-invasive diagnosis methods, such as liquid biopsies. Their detection is however challenging, as high levels of sensitivity, specificity and robustness are required. The analysis also needs to be quantitative, since the aim is to detect miRNA concentration changes. Moreover, a high multiplexing capability is also of crucial importance, since the clinical potential of miRNAs probably lays in our ability to perform parallel mapping of multiple miRNA concentrations and recognize typical disease signature from this profile. A plethora of biochemical innovative detection methods have been reported recently and some of them provide new solutions to the problem of sensitive multiplex detection. In this review, we propose to analyze in particular the new developments in multiplexed approaches to miRNA detection. The main aspects of these methods (including sensitivity and specificity) will be analyzed, with a particular focus on the demonstrated multiplexing capability and potential of each of these methods.
 Thomas Jet | Thomas Jet obtained his chemical engineering degree from ESPCI Paris in 2016. He completed a MS in biochemistry at Paris Diderot University and Pasteur Institute in 2017. He is now a PhD student at Université de Paris and ESPCI Paris. His research focuses on microRNA detection using DNA-based chemical networks. |
 Guillaume Gines | Guillaume Gines received his PhD in chemical biology in 2013, working on the development of biosensors of DNA repair enzymes. Until 2016, he was a postdoctoral fellow in the Fujii laboratory (U. Tokyo), investigating the emergence of collective behaviors in large populations of DNA-programmed particles. He then moved to Paris to work on the development of microRNA detection technologies, spanning concepts from molecular programming combined with microfluidics. Since 2020, he owns a CNRS research position at ESPCI Paris, PSL Research University. His research revolves around DNA nanotechnology and molecular programming, from their fundamental demonstrations to applications in diagnostics and biotechnology. |
 Yannick Rondelez | Yannick Rondelez has a background in chemistry, single molecule biophysics, microfluidic and enzymology. He develops new approaches to manipulate information in molecular systems, including those with non-linear dynamics, or implementing neural architectures. He is an expert in new chemical approaches based on synthetic DNA, high throughput methods using micro-compartmentalization and sequencing, and complex bio-processes. He currently works on the applications of artificial molecular circuits, including advanced diagnostics and artificial evolution. |
 Valérie Taly | V. Taly is a CNRS research director, group leader of the Translational Research And Microfluidics group and deputy director of the MEPPOT team (personalized medicine, pharmacogenomics and therapeutic optimization) in the Cordeliers Research Center. Her group performs interdisciplinary researches aiming at developing and validating microfluidic tools for cancer research in close collaboration with clinicians and researchers in oncology. Her research is dedicated to the development of original tools and procedures, with a specific focus on droplet-based microfluidics, for the non-invasive detection of cancer biomarkers and the highlighting of new Biomarkers with applications in personalized medicine, cancer recurrence detection and diagnostics. |
1 Interest and challenges of miRNA detection
MicroRNAs (miRNAs) are a class of short non-coding RNAs of about 19 to 25 nucleotides. They were first discovered in 1993 in Caenorhabditis elegans1 and are said to be responsible for the post-transcriptional gene expression regulation of more than 60% of human protein-coding genes.2 This regulatory process, called RNA interference (RNAi), was first described in 1998 by Andrew Fire and Craig Mello,3 who were awarded the 2006 Nobel Prize in Medicine and Physiology.In order to regulate gene expression, miRNAs form complexes with protein GW182 and one of the proteins of the Argonaute (AGO) family.4,5 This complex is known as the miRNA-Induced Silencing Complex (miRISC). In this complex, the miRNA is used for target recognition through base pairing, whereas proteins actively induce repression.6 Two main mechanisms of the miRISC complex are proposed (Fig. 1): in most cases, the miRNA binds the 3′ untranslated region (UTR) thanks to a region known as the miRNA “seed”, located between the second and the seventh nucleotides. The RISC proteins then recruit factors inhibiting mRNA translation and promoting mRNA deadenylation.4 Another mechanism of action of miRISC involves the complete binding of the miRNA inside the coding region of the gene, which leads to mRNA cleavage by the AGO protein.7 The shortness of the miRNA-recognition site on the 3′ UTR of the mRNAs explains how only a few thousands miRNAs can regulate the expression of more than half of human genes.
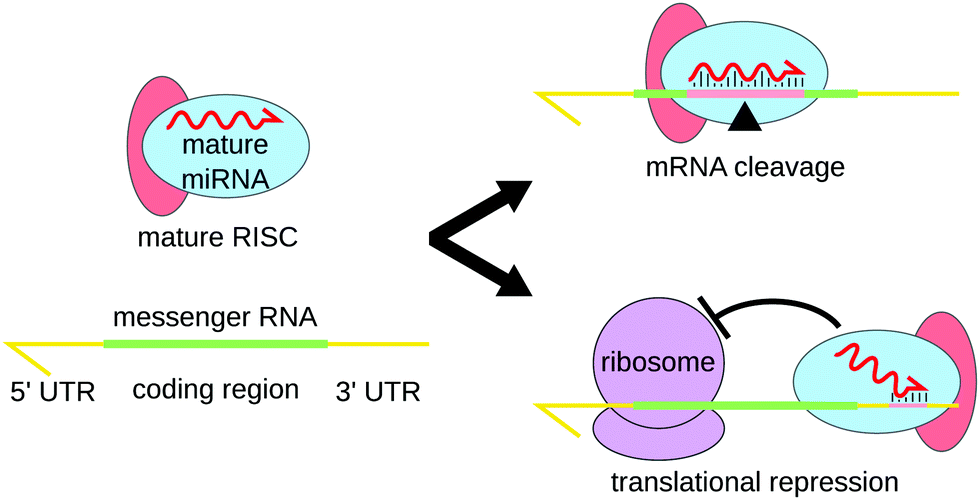 | ||
| Fig. 1 The two main miRNA-induced pathways for post-transcriptional regulation. Complete binding of the miRNA to the coding region of the mRNA leads to the cleavage of the mRNA by the proteins of the RISC complex. Alternatively, the “seed” region of the miRNA, typically located between the second and seventh nucleotide hybridizes to one of the untranslated regions (most commonly 3′ UTR). This partial binding triggers the recruitment of translation-inhibiting factors and/or destabilizes the mRNA by promoting its deadenylation. | ||
The biogenesis of miRNAs is initiated in the nucleus, as miRNA genes are transcribed by RNA polymerase II into a primary miRNA (pri-miRNA) (Fig. 2). The pri-miRNA is generally over 1 kb long and partially hairpin-shaped, with single-stranded 3′ and 5′ ends. The mature miRNA sequence is part of the stem. Still inside the nucleus, this pri-miRNA undergoes maturation by the Microprocessor complex composed of nuclear RNase III Drosha and cofactor DGCR8.6 Drosha cleaves the pri-miRNA and releases a 65 bases long hairpin-shaped RNA called precursor-miRNA (pre-miRNA). The pre-miRNA is exported in the cytoplasm, where it undergoes a second maturation step by Dicer endonuclease. Dicer cleaves pre-miRNA near both ends of the loop, releasing a duplex of small RNAs. This duplex is loaded onto an AGO protein to form a pre-RISC. The duplex is then unwinded by a helicase and only one of the RNAs remains in the complex, forming a mature RNA-induced silencing complex. For a more complete overview of miRNA biogenesis and physiological role, we refer the reader to other reviews.6,8,9
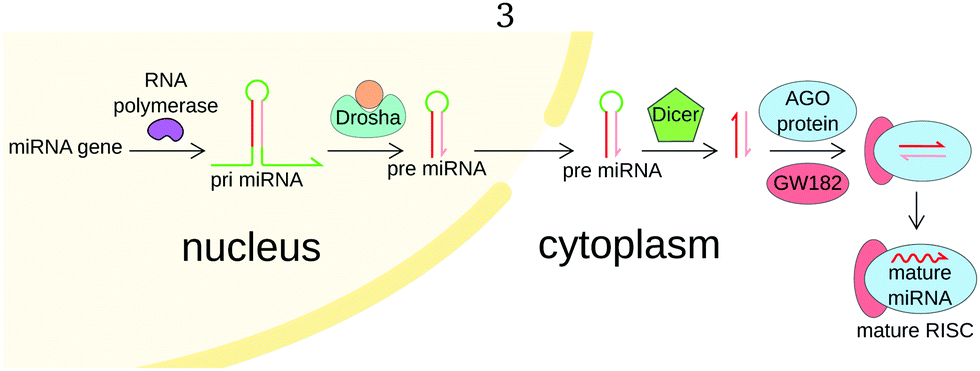 | ||
| Fig. 2 Simplified miRNA biogenesis pathway. The miRNA gene is transcribed into a 1 kb-long primary miRNA (pri-miRNA). The pri-miRNA then undergoes two successive maturations, first forming an hairpin-shaped precursor miRNA (pre-miRNA) and then an RNA duplex composed of the miRNA and its complementary sequence. The complex binds a protein of the Argonaute (AGO) family and is unwinded by a helicase, releasing the complementary strand. The mature miRNA remains bound to the complex composed of AGO and other proteins, such as GW182, called the miRNA-induced silencing complex (miRISC). | ||
The role of miRNAs in cancer was first evidenced by Croce's group in 2002 when they discovered that a genomic region on which were located two miRNA genes was commonly deleted in chronic lymphocytic leukemia.10 Since then, a plethora of disease-related miRNA dysregulations have been reported, not only in cancer,11 but also for Parkinson's disease,12 diabetes13 and cardiovascular diseases,14 among others. The causes of these dysregulations are for example gene deletions10,15 or amplifications16,17 and defects in miRNA transcriptional control18–20 or biogenesis machinery.21,22 In cancer, due to their gene expression-regulating role, miRNA dysregulations could contribute to most of the cancer hallmarks. Among countless examples, miR92a's upregulation has been described as promoting cell proliferation,23 miR21 was found upregulated in lung cancer and inducing apoptosis resistance,24 whereas miR203 downregulation was observed in metastatic breast cancer cells.11
Tumor tissue biopsy is currently the main biomarker analysis method for cancer diagnostics. This procedure however presents serious drawbacks, such as limited capacities to recapitulate tumor heterogeneity, high cost and invasiveness. Moreover it is also not appropriate for tumor real time characterization, which could be of great interest for patient follow up and treatment management. To circumvent these limitations, liquid biopsies are being developed. Liquid biopsy relies on the analysis of circulating biomarkers (including circulating tumor DNA, circulating tumor cells, proteins and miRNAs) in bodily fluids, such as blood or urine. MiRNAs have been shown to be released by healthy and tumor cells in the bloodstream and other biofluids.25 These circulating miRNAs are thought to be not only passively released by apoptotic or necrotic cells, as it has mainly been described for ctDNA, but also actively secreted by living cells in extracellular vesicles. Studies suggest that secreted miRNAs could be addressed and delivered to specific cells. Once inside target cells, recovered miRNAs would modify the gene expression pattern, thus playing a long distance cell-to-cell signaling role.26 Moreover, released miRNAs are protected, by conjugation to RNA-binding proteins such as AGO2 or high-density lipoprotein (HDL),5 and are thus very stable even under harsh conditions.27 These characteristics make miRNAs very promising biomarkers for liquid biopsy strategies.
1.1 Challenges for miRNA detection
In spite of their attractiveness as biomarkers, several challenges need to be addressed in order to apply miRNA detection to cancer diagnosis. First, miRNAs are very short sequences, displaying a high level of homology, especially if they belong to the same family: the Let-7 miRNA family, involved in numerous pathologies including cancers, is comprised of 10 miRNAs sharing the same seed and most other nucleotides.28 Let-7a and Let-7e, for example, are perfectly identical with the exception of their 9th nucleotide. Hence, a very high level of specificity is required to selectively quantify each miRNA.MiRNAs only represent 0.01% of total RNA mass,29 and additionally need to be detected from highly complex media. In blood plasma, the concentrations of miRNAs are in the sub-picomolar (pM) range.27,30 In addition to sufficient sensitivity, miRNA detection methods need to display a dynamic range spanning at least four orders of magnitude.
The aim of a miRNA-based liquid biopsy is to detect miRNA concentrations changes, as both healthy and tumor cells release miRNAs, but in different relative quantities. Since these dysregulations may be subtle, the accuracy and precision of the assay is thus of utmost importance.
1.2 Importance of multiplexed detection
The study of the dysregulation of single miRNAs is, in most cases, insufficient for a reliable diagnosis. Some members of the Let-7 family, which work as inhibitors of cell growth, are down-regulated in different cancers, such as lung, breast and cervical cancers.31 Similarly, miR-21, an apoptosis inhibitor, is found upregulated in glioblastoma, B-cell lymphoma and ovarian cancer, among others.32 Consequently, the diagnostic, predictive and prognostic potential of miRNAs is most likely the determination of miRNA-signatures associated to a disease with which a patient miRNA profile can be compared.33 A plethora of such signatures were described for both diagnostic34–36 and prognostic applications.37–39 The determination of disease signatures opens the way for diagnosis, which requires the quantification of multiple miRNAs in order to establish the miRNA profile of the patient. Such profiles can be determined either by running multiple single-plex detection reactions or a single multiplex reaction. In the case of parallel single-plex reactions, the sample is splitted in aliquots, one for each miRNA target. The required amount of sample thus increases proportionally to the number of miRNA targets, which is not the case of multiplexed detection methods. Alternatively, the sample can be diluted. Both of these strategies come at the cost of lowered sensitivity. Additionally, performing multiple single-plex assays in parallel significantly increases the workload, the cost and error risks. For all these reasons, the development of multiplex techniques has drawn considerable research efforts (Fig. 3).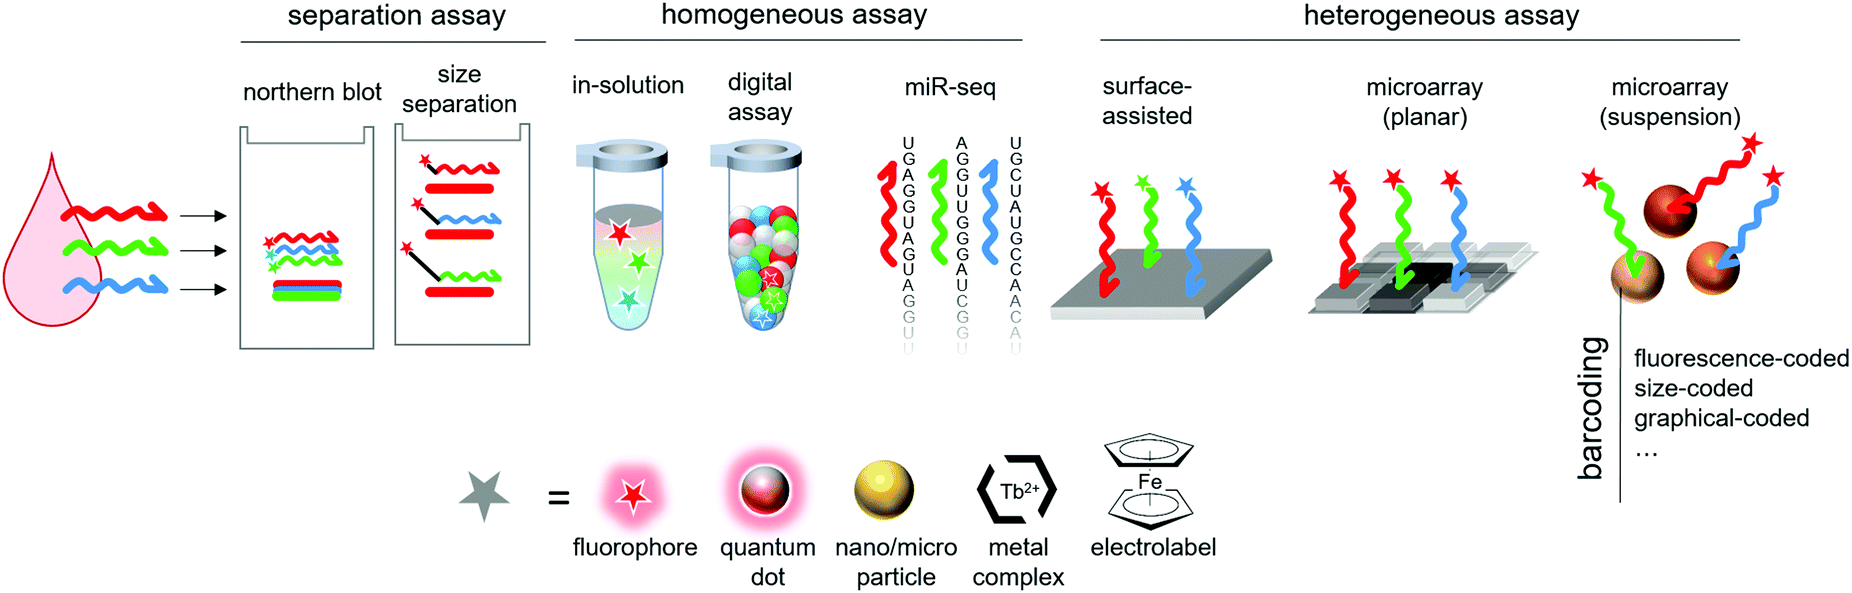 | ||
| Fig. 3 Schematic representation of the approaches to multiplex miRNA detection presented in this review. | ||
2 Amplification techniques applied to miRNA detection
The detection of miRNA targets, present in concentrations within the 1–100 femtomolars (fM) range, requires a high sensitivity and accuracy. The amplification of the target sequence or of an intermediate molecule is in most cases mandatory to detect such diluted targets by conventional readout strategies, such as fluorescence. While the pool of DNA amplification chemistries comprises a plethora of techniques, most of them are not fitted for the amplification of short RNA sequences such as miRNAs.Here we briefly describe conventional amplification methods and the developments that were made in an attempt to adapt these methods to the amplification of miRNAs and to increase the accuracy and the specificity of the quantification. For a more detailed overview of nucleic acids amplification techniques applied to miRNA detection, we refer the readers to another review.40
2.1 RT-qPCR
Of all miRNA detection techniques herein presented, RT-qPCR is undoubtedly considered as the gold-standard method. It allows for the detection of miRNA targets down to the attomolar (aM) range41,42 and displays single-nucleotide specificity43 while being relatively low-cost. RT-qPCR also features a wide dynamic range, spanning up to 8 orders of magnitude.Quantification of RNA molecules by RT-qPCR, in general, comprises two steps: (i) Reverse Transcriptase (RT) is first used to synthetize the complementary DNA (cDNA) of the RNA target. (ii) this cDNA is then amplified by PCR thanks to a thermostable DNA polymerase and a pair of primers. The amplification is monitored in real-time by fluorescence, using either a double-stranded DNA specific dye (e.g. SYBR Green I) or specific fluorescence probes (e.g. hydrolysis or molecular beacon probes) labeled with orthogonal dyes in the case of multiplex RT-qPCR (cf. Section 3.2.1) (Fig. 4b). The target is quantified by measuring the number of temperature cycles necessary to cross a fluorescence threshold (Cq) and comparing it to a standard range of samples of known concentrations.
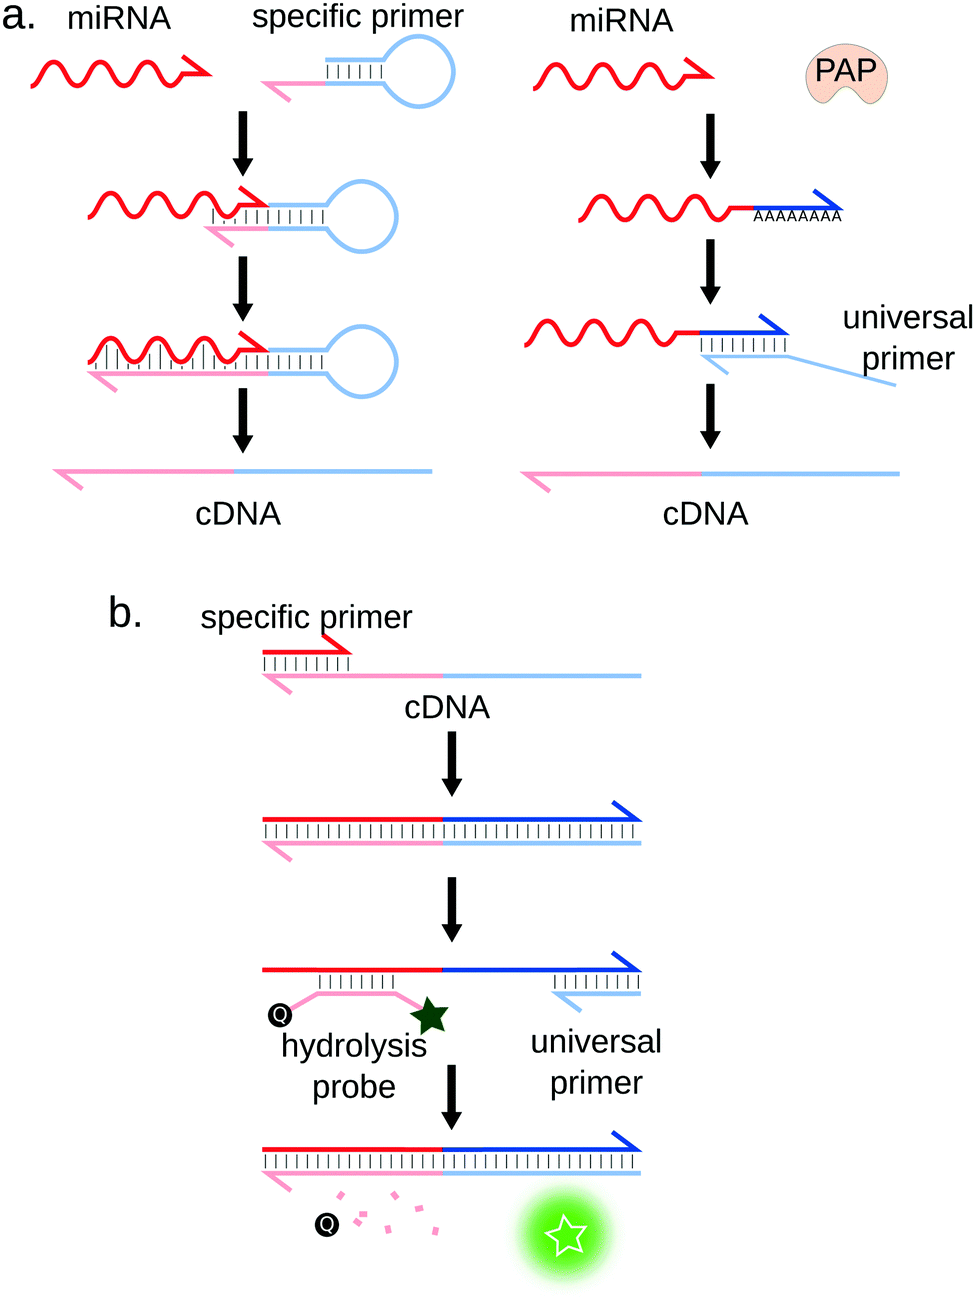 | ||
| Fig. 4 Principle of RT-qPCR. (a) Reverse-transcription strategies. Left: The miRNA is reverse-transcribed using a miRNA-specific hairpin-shaped primer that partially hybridizes to the miRNA 3′ end. Right: The 3′ ends of all miRNAs are extended using the poly(A) polymerase (PAP). This allows the reverse transcription of all miRNAs using a universal primer. (b) The produced complementary DNA (cDNA) strands are quantified by qPCR, using a miRNA-specific and an universal primer. | ||
Adapting qPCR to miRNA quantification requires some ingenuity. Indeed, RT-qPCR was initially developed to quantify long RNA sequences: typical PCR primers are approximately 20 bases long, which is the size of a full miRNA. This problem was solved by designing stem-loop41 or linear44 RT primers partially complementary to the miRNA (Fig. 4a, left) or by using the poly(A) polymerase (PAP)42 (Fig. 4a, right). Although convenient, this method may reduce the specificity and sensitivity of the assay.40 This observation is however contradicted by a study by Mestdagh et al.,45 where the authors systematically analysed seven RT-qPCR kits. They showed that minimal cross-reactivity is obtained using the polyA strategy, in combination with LNA-modified universal RT primer. Another limitation of miRNA RT-qPCR is that the interval of melting temperatures (Tm) of the miRNA-specific primer/miRNA duplex is rather large due to the heterogeneous GC content of miRNAs. According to Benes et al., the sensitivity is reduced if the Tm is below 55 °C, which can be the case for GC-poor miRNA sequences.46 Moreover, the RT step efficiency can also depend on the miRNA sequence or structure, which has been shown to introduce biases in the transcribed cDNA library.47,48
RT-related biases can be reduced by using two-tailed primers,49 or by replacing the RT by a miRNA-induced ligation step.50,51 The ligated oligonucleotide is the cDNA strand that will be then quantified by qPCR. This ligation step is however also most likely prone to sequence-specific biases, as shown in the context of library preparation for small RNA sequencing.52 Two-tailed primers and ligation-mediated qPCR also increase the specificity of the detection.49,53 In the case of ligation-mediated qPCR, the choice of the ligase is especially important to specificity. Jin and coworkers demonstrated a detection of several members of the Let-7 family with excellent specificity by using the SplintR ligase instead of the commonly used T4 ligase.53 This strategy has also been adapted to recombinase polymerase amplification (RPA).54
As it was already mentioned, qPCR-based measurement only provides a relative quantification of the sample, with respect to a calibration curve established from standard samples. This approach may thus introduce quantification biases (e.g. due to the presence of PCR inhibitors in the sample).
2.2 Rolling circle amplification
Rolling circle amplification (RCA) was originally designed by Kool's group as a method for the linear amplification of single-stranded RNA55 or DNA.56 The amplification uses circular single-stranded DNA as a template. Once a forward primer (P1, the miRNA in this case) hybridizes to the circular template, it is elongated by a DNA polymerase. The polymerase progresses around the circular template multiple times, producing a long concatemer composed of numerous copies of the sequence complementary to the template (Fig. 5).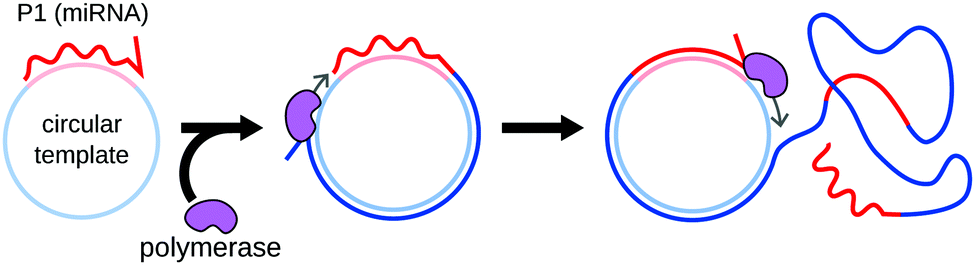 | ||
| Fig. 5 Principle of RCA. The miRNA hybridizes to a circular DNA template, and acts as a primer for elungation by a DNA polymerase. The polymerase keeps progressing around the circular template, producing a long DNA strand composed of repeats of the same sequence. Amplification is reported by the hybridization of fluorescent probes complementary to the repeat sequence. | ||
RCA was first applied to miRNA detection by Jonstrup et al.57 The sensitivity of the method was low, due to its northern blot readout. Interestingly, the assay relied on linear detection probes that were circularized by ligation upon miRNA hybridization, therefore increasing specificity. The use of SplintR ligase,58,59 dumbbell probes60 or graphene-oxide nanosheets61 further improved detection specificity. The sensitivity of RCA-based detection can be enhanced by adding additional primers, turning the concatemer into a template for further amplification.62 RCA can also be converted to an exponential amplification method by integrating nicking enzyme recognition sites to the template sequence, as demonstrated for miRNA detection by Liu et al.63
2.3 Exponential amplification reaction
Exponential amplification reaction (EXPAR) was designed by Galas and coworkers as an alternative to PCR.64,65 EXPAR allows the amplification of a nucleic acid sequence using a DNA template, a DNA polymerase and a nicking enzyme66 (Fig. 6). The DNA template is composed of two miRNA-complementary sequences separated by a nicking enzyme recognition site. Upon hybridization, the miRNA is used as a primer for elongation. The nicking enzyme then recognizes its specific site, and cleaves only the miRNA-containing strand, releasing a DNA analog of the miRNA. This DNA strand in turn hybridizes to another template, which generates more miRNA analogs. The miRNA sequence is therefore exponentially amplified.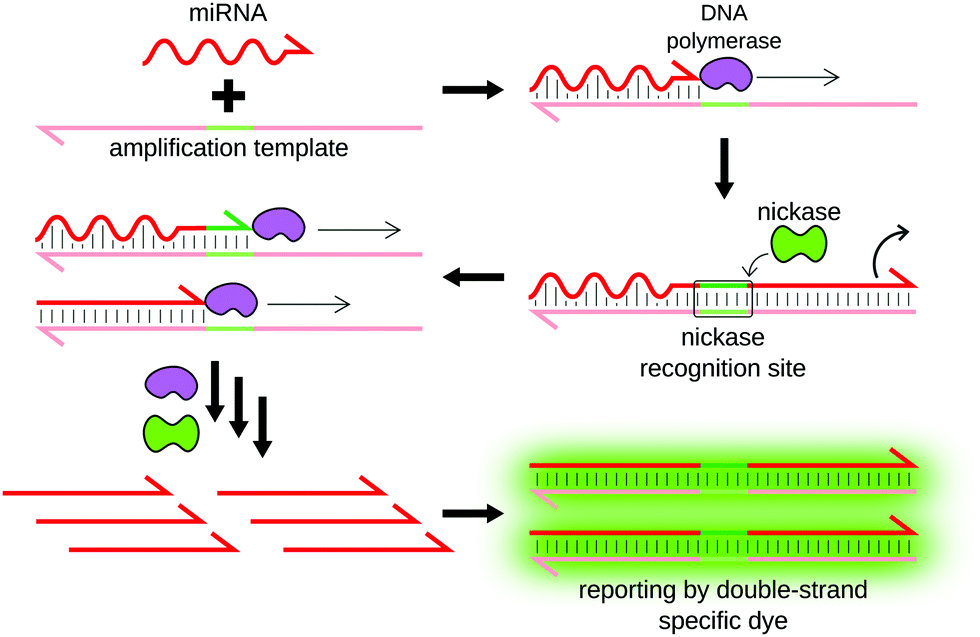 | ||
| Fig. 6 Principle of EXPAR. The miRNA is captured by a DNA template composed of two miRNA-complementary sequences separated by a nicking enzyme recognition site. Binding of the miRNA initiates the production of multiple DNA analogs of the miRNA following polymerization/nicking cycles. The produced miRNA analogs are released in the solution and can in turn initiate the production of more analogs, resulting in exponential amplification. | ||
While being an efficient signal-amplification method (106 to 109-fold amplification),67 EXPAR is however prone to unspecific amplification, which limits its sensitivity.68,69 This problem has been addressed by Montagne and coworkers, who introduced an additional template (referred as pseudotemplate) that drives the deactivation of unspecifically produced triggers,70 allowing accurate miRNA quantification using a digital readout (see Section 3.2.3).71 Additionally, the specificity of the assay by Jia's group within the Let7 family was rather low: the chemical network designed for Let7-a detection was triggered almost simultaneously by Let7-a and Let7-e. Several groups adapted the original EXPAR design in order to improve the specificity, such as using dumbbell or hairpin-shaped probes.72,73
2.4 Duplex-specific nuclease signal amplification
Duplex-specific nuclease signal amplification (DSNSA) is commonly used for multiplex miRNA detection. Originally isolated from the Kamchatka crab,74 the duplex-specific nuclease (DSN) was first characterized as an exonuclease that specifically degrades double-stranded DNA. Anisimova et al. later demonstrated that in the presence of DNA:RNA duplexes, DSN specifically degrades the DNA strand, leaving the RNA strand untouched.75 Based on this property, Yin et al. first applied DSN for the simultaneous detection of 3 miRNAs with sub-pM sensitivity.76 The assay was based on the hybridization of hydrolysis DNA probes on the miRNA, thus forming a DNA:RNA duplex. The hydrolysis probe was preferentially degraded by DSN, and the unaffected miRNA was free to hybridize to another probe, resulting in linear signal amplification (Fig. 7). The sensitivity of the assay was improved using different reporter probes, such as molecular beacons77 or G-quadruplex specific probes.78 Alternatively to DSN, CRISPR-associated nucleases (Cas)79 or T7 exonuclease80 were successfully applied to similar methods for miRNA detection. | ||
| Fig. 7 Principle of DSNSA. Hybridization of the miRNA to a complementary DNA hydrolysis probe forms a RNA/DNA duplex. The duplex-specific nuclease recognizes the duplex and selectively degrades the probe, producing fluorescence. The miRNA remains untouched and is free to bind to another hydrolysis probe, triggering its degradation. | ||
2.5 Enzyme-free amplification techniques
Contrary to most other amplification methods presented herein, hybridization chain reaction (HCR) and catalyzed hairpin amplification (CHA) are enzyme-free amplification techniques. First described by Dirks and Pierce,81,82 HCR only uses two short DNA hairpins (H1 and H2) and a single-stranded initiator hairpin (Fig. 8). The loop region of the initiator hybridizes to the target. The 5′ and 3′ ends of the initiator become available and hybridize to H1, opening it in the process. The part of H1 that remains single-stranded is complementary to H2, which in turn opens and binds H1, resulting in the sequential concatemerization of H1 and H2. The amplification can be monitored by fluorescence using molecular beacons as H1 and H283 or thanks to an intercalating dye.84 This technique was applied by Pierce's team for the detection of mRNAs83,85 and miRNAs,86 with a limit of detection (LOD) of 25 attomoles (amol).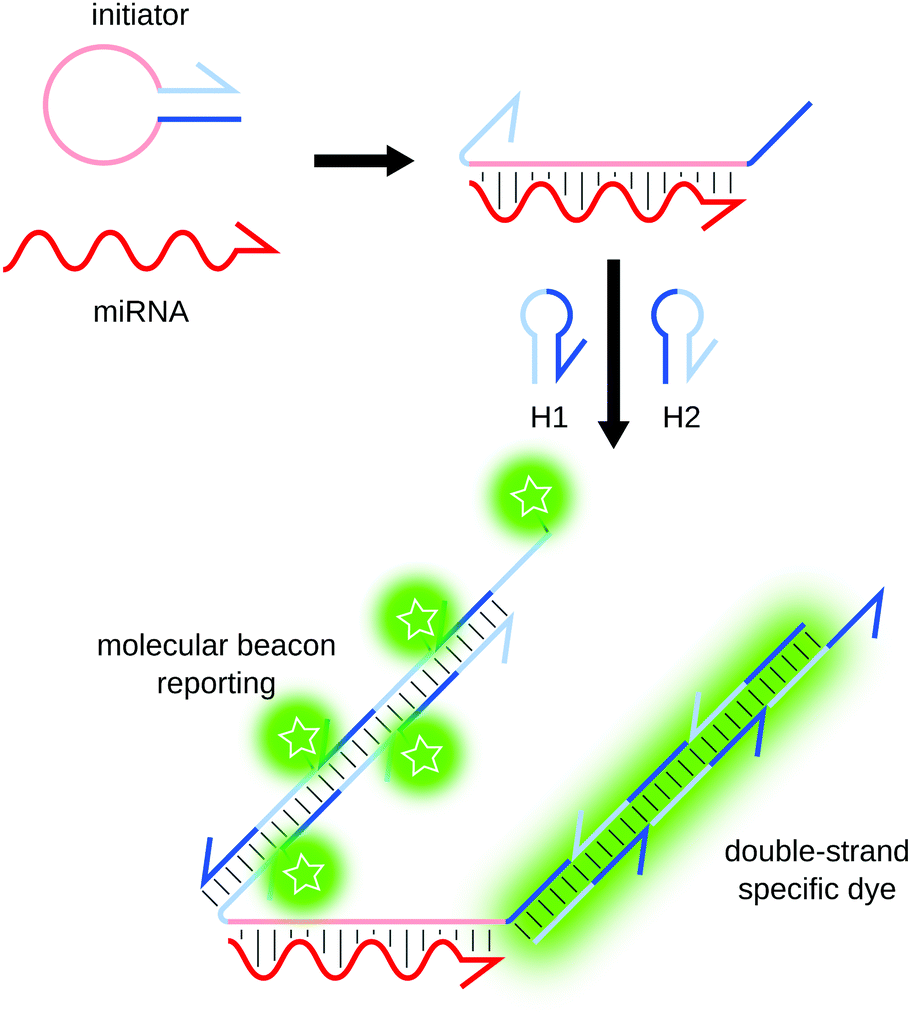 | ||
| Fig. 8 Principle of HCR. The hybridization of the miRNA to the initiator strand triggers sequential concatemerization of hairpins H1 and H2, forming long regions of double-stranded DNA. The amplification can be reported by a double-strand specific dye or by using molecular beacons as H1 and H2. | ||
Developed by the same team, CHA also relies on toehold-mediated strand displacement.87 The nucleic acid target triggers the opening of a first hairpin by hybridizing in the stem region. The target is then displaced by the binding of a second hairpin, and is thus recycled in the process. CHA can be coupled to various readout strategies, and provides an amplification ratio of around 100-fold.87–90
3 Multiplexed miRNA detection
3.1 Separation techniques
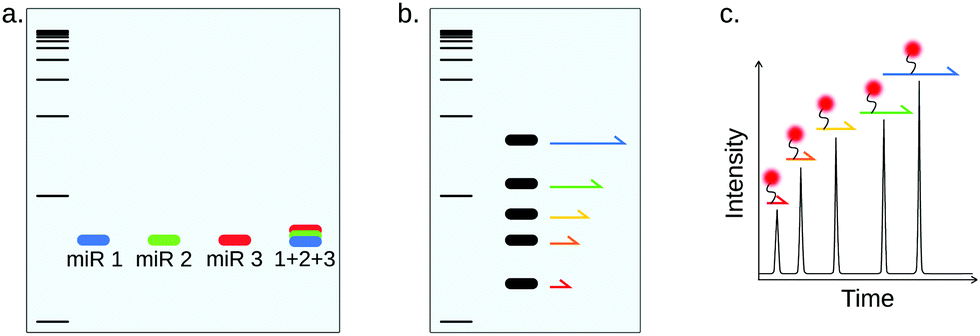 | ||
| Fig. 9 Multiplex miRNA detection strategies based on separation techniques. Since the size distribution of miRNAs is very narrow, miRNAs can not be directly separated based on size. Multiplex detection is however possible by using miRNA-specific detection probes (a), or by using the miRNA to generate size-coded DNA molecules that can be separated on slab gels (b) or by capillary electrophoresis (c). | ||
Although it has been described as robust and reliable, NB is a cumbersome and time-consuming technique. Since gel electrophoresis cannot distinguish different sequences of the same molecular weight, as is the case for miRNAs, specificity relies only on probe hybridization, resulting in rather poor specificity and sensitivity. Both sensitivity and specificity can be improved by using locked nucleic acid (LNA)-modified probes.91 Additionally, target quantitation is only relative and lacks accuracy.92
NB can be implemented into a multiplex miRNA detection method using color-coded detection probes (Fig. 9a), as was demonstrated by Schwarzkopf et al.86 Interestingly, NB was in this work coupled to HCR amplification in order to improve sensitivity (100 amol). This multiplexing strategy is however limited by the availability of spectrally-resolved fluorescent probes.
In spite of the narrow size distribution of miRNAs, size-separation can be useful for multiplex miRNA detection by using the miRNAs to generate size-coded molecules (Fig. 9b). For example, Arefian et al. used miRNAs as a scaffold for the ligation of 2 miRNA-specific DNA sequences, one of which is of different length depending on the target miRNA.93 The method allowed the simultaneous detection of 9 miRNAs of the Let-7 family, also showing great specificity, but rather low sensitivity (1 pM). Chandrasekaran and coworkers proposed another method, based on agarose gel separation.94 This assay allows miRNA detection using only a double-stranded DNA probe with two miRNA-specific overhangs. The presence of the miRNA brings the 2 overhangs together, forcing the double-stranded DNA probe to form a loop. In this method, the barcoding strategy is only based on the distance between the two overhangs, which defines the size of the loop once the miRNA is captured and allows electrophoresis separation. The authors demonstrated multiplexing for up to five targets as well as single-nucleotide specificity, with a LOD around 100 fM.
3.2 Homogeneous multiplex detection
Most conventional miRNA detection methods are fully realized in solution, such as RT-qPCR, EXPAR or RCA. Such techniques are therefore named homogeneous methods.To circumvent this specificity issue, qPCR mix is typically diluted after one-pot reverse transcription, and distributed in 96- or 384-well plates, each well containing different miRNA-specific primers as well as universal primers and fluorescent probes.102
Hildebrandt's group developed several amplification-free multiplex detection methods in solution, using either fluorescent dyes103 or quantum dots (QD).104,105 These methods use the miRNA to bring FRET donor and acceptor within close proximity either by ligation or base stacking. Interestingly, they reported the simultaneous detection of two miRNAs using a single FRET pair (terbium complex/QD), whose photoluminescence is tuned by the distance between the donor and the acceptor, reaching sub-nanomolar sensitivity. By coupling this temporal multiplexing with enzyme-free amplification, the same team reported a gain in sensitivity of three orders of magnitude.106,107 More recently, they combined spectral and temporal multiplexing to detect four DNA analogues of miRNAs with RCA.108 Quantum dots were also used by Ye et al. in a 4-plex microfluidics-based assay.109 RCA was also used by Wang et al. in a 3-plex assay displaying a LOD of 90 fM.110
Interestingly, the chromogenic cationic polymer poly[(9,9-bis(60-N,N,N-trimethylammonium)-hexyl)-fluorenylene phenylene dibromide] (PFP) has been used as a universal FRET donor, allowing the detection of three miRNAs, combined with orthogonal fluorescent probes and DNAzyme-based amplification.111
Color-coded fluorescent reporters were also widely applied to amplified homogeneous detection methods, such as the first DSNSA miRNA multiplex detection by Yin and coworkers.76 The LOD of the method (100 fM) was indeed improved compared to amplification-free techniques. Other DSN-based fluorescent methods were subsequently reported, most notably Xiao's 3-plex assay, using fluorescent probes embedded in MoS2 nanosheets to improve specificity.80,112,113
Our group recently reported a multiplex isothermal amplification method using orthogonal EXPAR-like designs.117 By solving the problem of cross-reactivity often observed in one-pot multiplex reactions, this work demonstrated a 3-plex assay using a droplet digital readout.
Smith et al. recently reported an ingenious use of RCA for single-molecule miRNA detection.118 Following one-pot multiplex RCA, RCA products are labelled with probes tagged with different fluorophores, which allows miRNA indexation. They achieved as a proof of concept a duplex miRNA detection with sub-pM sensitivity. The analysis was performed by single-molecule flow cytometry, as DNA molecules produced by RCA were large enough (48 kb) to be detected using conventional instruments. Although the authors only demonstrated a duplex detection as their proof of concept, it is clear that the barcoding capacity can reach hundreds or even thousands of combinations. The sensitivity of the assay, however, still needs to be improved to match the requirements of miRNA profiling in biological samples. This may be caused by non-specific initiation of RCA, which could be reduced by using padlock probes.119 Hu and coworkers however reported a similar method using padlock probes displaying similar sensitivity (1 pM).120 One can note the development of a similar strategy applied to multiplex nucleic acid detection, combined with a microfluidic-driven enrichment step to improve the sensitivity.121
NGS historically allowed the discovery of a plethora of miRNAs,123 as NGS instruments are able to read millions to billions of sequences in a few days. This very high throughput is one of the advantages of NGS, and is extremely important for miRNA profiling. NGS is indeed the miRNA detection method that displays the highest multiplexing ability, since all RNAs in the sample can theoretically be detected, thanks to the use of universal RT and PCR primers.124 RNA-seq thus requires no prior information or specified target sequence. This ability makes RNA-seq unique among miRNA detection methods, because most other techniques require the design of specific primers and/or probes for each targeted miRNA, which reduces the spectrum of the analysis. The specificity of NGS miRNA detection depends on the error rate of the sequencing platforms, which is typically around 1–10 errors for 1000 bases called.125 Since miRNAs are around 20 bases long, NGS is very accurate for the differentiation of miRNAs, even highly homologous sequences.
While it displays undeniable advantages, NGS still suffers from several flaws. Owing to its lack of sensitivity, sequencing analysis always requires a pre-amplification step traditionally achieved by RT-qPCR (which also converts the RNA sequence into DNA material readable by DNA sequencing). The reverse-transcription and PCR steps can generate sequence-dependent biases,126,127 making this technique poorly quantitative. Additionally, rare sequences are often droped out because of abundant RNAs drawing most of the reads, thus reducing the sensitivity. NGS equipments are still very expensive, which makes, so far, routine diagnosis impossible. Each analysis provides a great amount of useful information, the extraction of which requires time and skilled bioinformaticians.
In spite of its drawbacks, comprehensive miRNA analysis by NGS is progressively becoming a benchmark to identified disease-linked miRNA signatures.128,129 Coenen-Stass et al., for example, reported a dysregulated miRNA profile for the diagnosis of Duchenne muscular dystrophy using NGS.130
3.3 Heterogeneous multiplex detection
This method has been applied to multiplex miRNA detection in a planar format by Yuan's group. The team first coupled electrochemical readout to DSNSA, achieving detection limits of a few fM.131 The sensitivity was further improved to reach a LOD around 50 aM by designing a DNA bot triggering the degradation of electrochemical labels upon miRNA capture.132 The group so far demonstrated the simultaneous detection of two targets using methylene blue and ferrocene as electrolabels. Xu and coworkers reported a LOD of 20 aM for a similar assay relying on a DNA framework changing conformation upon miRNA capture.133
Similar designs were developed in suspension, using the target miRNA to modify the distance between a magnetic microparticle and a miRNA-specific electrolabel.134–136 To our knowledge, all of the so far reported electrochemical on-particle methods demonstrated a duplex miRNA detection. The most sensitive of those methods reported a limit of detection around 1 fM.135
In all aforementioned electrochemical assays, each target is quantified using a different electrochemical label. As for fluorescence-based homogeneous assays, the multiplex ability of this method is limited by the number of electrochemical dyes simultaneously distinguishable by square wave voltammetry. Alternatively, mass spectrometry has demonstrated a high multiplexing potential using dozens of orthogonal metal isotopes.137 Such readout was for example combined with lanthanide-tagged recognition probes and DSNSA in a triplex assay.138
Surface-enhanced Raman scattering (SERS) is a powerful technique allowing the enhancement of Raman light scattering signals by up to 11 orders of magnitude.139 The method requires the interaction of two surfaces brought within close proximity to amplify the signal, and is therefore a heterogeneous-only detection method. SERS can for example be applied to sandwich assays using Raman-barcoded particles.140,141 Su et al. designed SERS “nano-mushrooms”,140 composed of a gold core linked to a silver cap by DNA spacers. The gap between the gold and silver surfaces forms a signal-enhancing “hotspot”, in which Raman labels are inserted. The gold core of the mushroom is coupled to DNA probes specific to one miRNA target, and are accordingly barcoded by inserting different Raman dyes in the hotspot. In this assay, the miRNA forms a bridge between a magnetic microparticle and its specific SERS nano-mushroom. After hybridization, the microparticles are recovered and each target is quantified by measuring the intensity of the corresponding Raman signals. The authors demonstrated a 3-plex assay with a 1 pM detection limit. Zhou and coworkers increased the sensitivity by a 100-fold by using gold-Raman Nanobridge Nanogap Probes (Au-RNNP).141 Instead of a sandwich detection, Wang et al. designed the “Inverse Molecular Sentinel” (IMS) assay.142 They used gold particles specifically engineered for signal enhancement, called Nanostars. Raman-labeled hairpins were immobilized on the particles. In the absence of the miRNA, the hairpins are opened and partially hybridized to the miRNA capture probe. The miRNA is perfectly complementary to its capture probe and can hybridize to it, strand-displacing the hairpin in the process. The hairpin then closes, bringing the Raman dye close to the SERS-inducing tips of the Nanostar particle, which amplifies the Raman signal of the dye. This technique enabled the duplex detection of miRNAs from total RNA cell extracts.
While most of the herein presented SERS-based assays rely on the use of Raman dyes, Sim's group developed a label-free miRNA detection method, able to recognize the Raman signature of the miRNA directly.143 Although the label-free approach reduced the sensitivity (5 fM) compared to other assays from the same group (Section 3.3.3, planar microarrays), the multiplexing potential of the method appears promising.
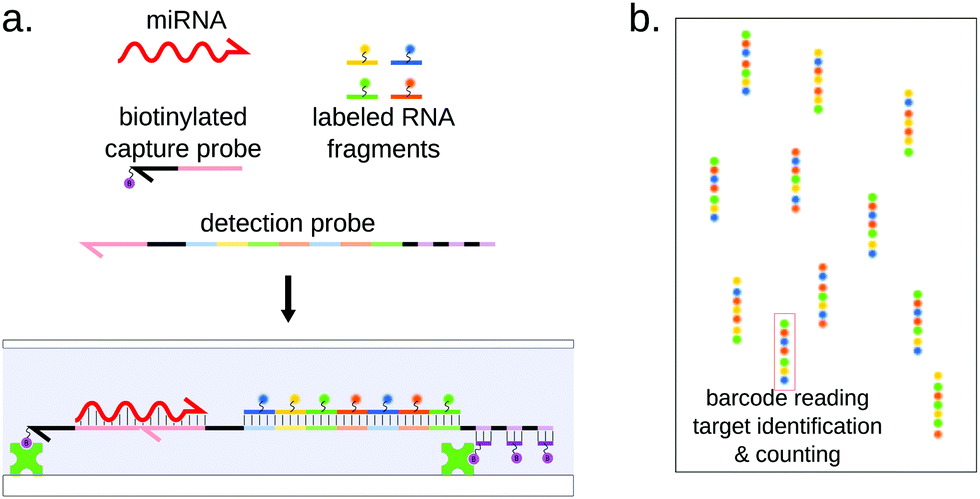 | ||
| Fig. 10 Principle of the Nanostring nCounter system. (a) The miRNA bridges between biotinylated capture probe, allowing immobilization on a glass slide, and a detection probe carrying a combination of fluorescent labels allowing identification of the target miRNA. (b) The immobilized sets of labels are counted, each one of them reporting the capture of a single miRNA molecule. | ||
This single-molecule approach grants the nCounter system with great sensitivity, in the sub-fM range,144 without requiring any amplification. This technology still displays some limitations in terms of specificity and assay duration.45,148
The multiplexing ability of the nCounter system lies in the fluorescently barcoded RNA fragments on the reporter probe. They are prepared separately by incorporating amino-allyl-modified UTPs during transcription of the fragments and coupling the modified uracil residues to four different dyes.144 The reporter probe is then assembled from a template by ligating seven fluorescent RNA fragments and the miRNA-specific 5′ end together. This strategy of seven fluorescent RNAs, with four possible colors for each of them, allows more than 15![[thin space (1/6-em)]](https://www.rsc.org/images/entities/char_2009.gif) 000 possible combinations. Taking into account that two consecutive fragments must be of different colors, the number of combinations is still 2916, while only 2654 miRNA sequences are referenced for Homo Sapiens in miRbase.149 In practice, Nanostring proposes detection panels of up to 800 human miRNAs. This effective barcoding strategy places this technology among the highest multiplexing methods, in the same range as density-based microarrays, while supposedly outperforming them in terms of sensitivity and sample requirement thanks to single-molecule counting.144 This statement is however contradicted by a study by Mestdagh et al.,45 where the authors benchmarked 3 microarray platforms (including Agilent, Affimetric and Nanostring) and concluded that the nCounter system did not display higher sensitivity and was even poorly performing with low-input amount of RNA. The nCounter system was recently used to screen for possible cancer miRNA signatures, for example in breast150 and ovarian151 cancers.
000 possible combinations. Taking into account that two consecutive fragments must be of different colors, the number of combinations is still 2916, while only 2654 miRNA sequences are referenced for Homo Sapiens in miRbase.149 In practice, Nanostring proposes detection panels of up to 800 human miRNAs. This effective barcoding strategy places this technology among the highest multiplexing methods, in the same range as density-based microarrays, while supposedly outperforming them in terms of sensitivity and sample requirement thanks to single-molecule counting.144 This statement is however contradicted by a study by Mestdagh et al.,45 where the authors benchmarked 3 microarray platforms (including Agilent, Affimetric and Nanostring) and concluded that the nCounter system did not display higher sensitivity and was even poorly performing with low-input amount of RNA. The nCounter system was recently used to screen for possible cancer miRNA signatures, for example in breast150 and ovarian151 cancers.
3.3.3.1 Planar microarrays. Planar arrays are composed of high-density spots of DNA probes immobilized on a flat glass or polymer support152 (Fig. 11). These probes can capture one specific target by Watson–Crick base-pairing. Each spot comprises only one kind of DNA capture probes, and can in theory only capture one kind of target. The sample is flown on the support, and every target sequence is captured on its specific probe spot. Multiple targets can thus be simultaneously quantified by measuring the signal on each spot. The spatial target separation allows microarrays to detect up to hundreds to thousands of nucleic acid sequences simultaneously [Yin, 2008]. Thanks to this excellent multiplexing ability, microarrays are often used for miRNA screening assays, leading for example to the identification of disease miRNA signatures.153,154
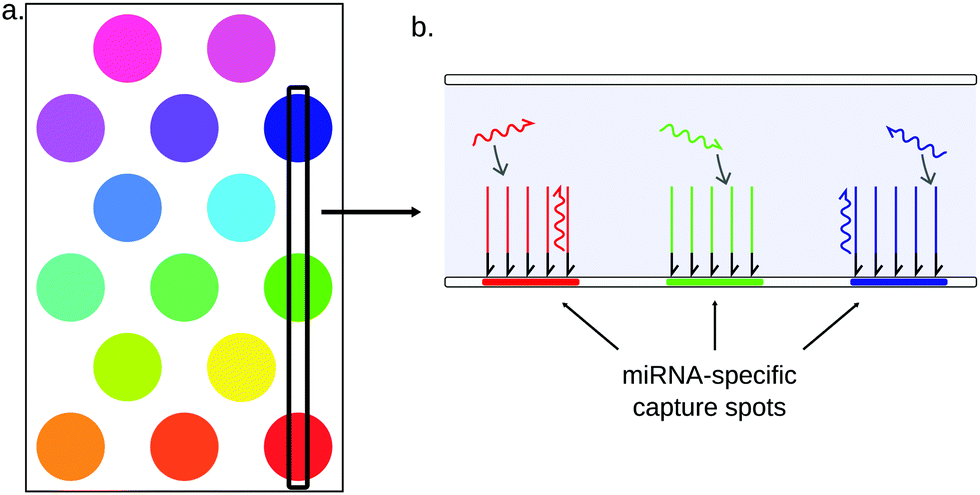 | ||
| Fig. 11 Principle of planar microarrays. (a) Capture probes are immobilized on a surface, forming separated spots. (b) Each spot is exclusively composed of capture probes for the same miRNA. Multiple readout strategies can be employed to quantify the miRNAs. | ||
Most conventional microarrays require the enrichment and labelling of potential targets prior to hybridization. In the case of miRNAs, the enrichment step consists in the separation of short RNAs (usually under 200 nt) from total RNA. All short RNAs are then labelled, typically using radioactive or fluorescent labels.155 The labelling can be performed either directly on the RNA strands, by ligating a fluorescent dye156,157 or a biotin residue158 to one of the miRNA ends, or indirectly following a reverse-transcription step159 and possibly a PCR amplification.160,161
Despite being high-throughput and highly multiplexed, classic miRNAs microarrays display a relatively low sensitivity, with detection limits within the nanomolar range. Moreover, since the yield of labelling, enrichment and/or amplification steps often varies depending on the sequence, these steps can introduce quantification biases. The hybridization step is also prone to biases due to the variable miRNA hybridation thermodynamics.162 The specificity of conventional microarrays is also relatively low towards highly homologous miRNAs, which requires long hybridization steps (up to several days). The implementation of LNA-modified163 or stem-loop capture probes164 is reported to improve the specificity.
The relatively low sensitivity of conventional microarrays is a critical issue for the detection of low-abundant miRNAs in real samples. In order to detect lower concentrations, two main options are available: improving the sensitivity of the detector, or increasing the target concentration. In this section, we will focus on new detectors and readout strategies applied to the detection of miRNAs.
As was already presented, SERS is a very powerful surface-based signal amplification technique. Sim's group for example reported significant advances for SERS-based multiplex miRNA detection.143,165 The group designed a sensor composed of gold nanopillars, the tips of which are coupled to miRNA-specific DNA capture probes. The sensor allowed the sensitive detection of 3 miRNAs simultaneously, either by amplifying the Raman signal of the miRNA itself143 or in a labeled sandwich assay format.165 The assays are indeed more sensitive than conventional microarrays: the LOD of the direct detection method is a few fM, and the sandwich assay can even detect concentrations in the attomolar range, with a 9 orders of magnitude dynamic range. Liu et al. also designed a SERS-based microarray.166 The method uses Raman-labeled nanoparticles that compete with miRNA to bind miRNA-specific capture probes coupled to the sensor. The concentration of target miRNA for each spot is thus inversely related to the intensity of the Raman signal. Interestingly, the proof of concept assay was an 8-plex detection of the members of the Let7 family, showing the excellent specificity of the method. The LOD was around 100 fM, not as good as previously reported nanopillar-based methods.
Other reporting strategies for amplification-free miRNA sensing were developed, such as surface-plasmon resonance,167,168 microring resonators,169 electrochemistry170,171 or gold nanoparticles aggregation.172 None of these technologies have however surpassed SERS in terms of sensitivity.
The high multiplexing ability of microarrays can also be used to enhance the potential of conventional techniques, such as RT-qPCR173,174 or LAMP.175 Choi et al. for example proposed an on-support version of RT-qPCR.173 In this method, following the RT step, the cDNA mix is introduced in a microfluidic channel. Hydrogel microposts were formed in the middle of the microchannel. The microposts are photochemically coupled to miRNA-specific PCR primers, allowing each post to capture its specific cDNAs. Quantitative PCR is performed using a universal reverse primer in solution, and amplification is reported by SYBR Green I fluorescence. Although less sensitive than in-solution RT-qPCR, this assay displays increased multiplex potential, because the independent PCR amplifications are spatially separated, mitigating cross-reactivity issues. A similar assay using LAMP amplification coupled to an electrochemical readout was developed by Hashimoto and coworkers.175 A 5-plex detection with a LOD in the 100 aM range was demonstrated. Alternatively, Ishihara et al. used a dendritic amplification step by flowing fluorescent streptavidin and biotinylated anti-streptavidin antibodies.176 Instead of capturing the target and then amplifying the signal, the other approach is to perform an amplification in solution prior to capturing and labeling the amplified target. Mader et al. performed a 14-plex detection based on nucleic acids sequence-based amplification (NASBA) using this approach.177
One of the main challenges for multiplexed detection is that several output signals not only need to be measured, but also attributed to the corresponding target. For homogeneous methods, target identification is mostly based on two strategies: the use of different fluorescent reporters or the coupling to separative techniques. In the case of planar arrays, the indexation is encoded in spatially distinct spots. Barcoding designates the various indexation methods for suspension microarrays. Thanks to the diversity and versatility of particles and functionalization techniques, the field of suspension arrays offers a greater variety of barcoding strategies and shows excellent multiplexing potential.
3.3.4.1 Fluorescence. As for homogeneous assays, fluorescence is the most common barcoding strategy for particle-based methods. In this case, it is however possible to surpass the typical limitation of six colors by encoding the particles with different intensities for a single fluorescent channel.
Fluorescently barcoded particles can be prepared using various techniques. The easiest of them is the functionalization of the surface of the particle with fluorescent oligonucleotides, either using affinity or covalent coupling.179 Alternatively, dyes can be integrated to the core of the particle, in the form of dyes180 or Quantum Dots (QD) (Fig. 12).181,182
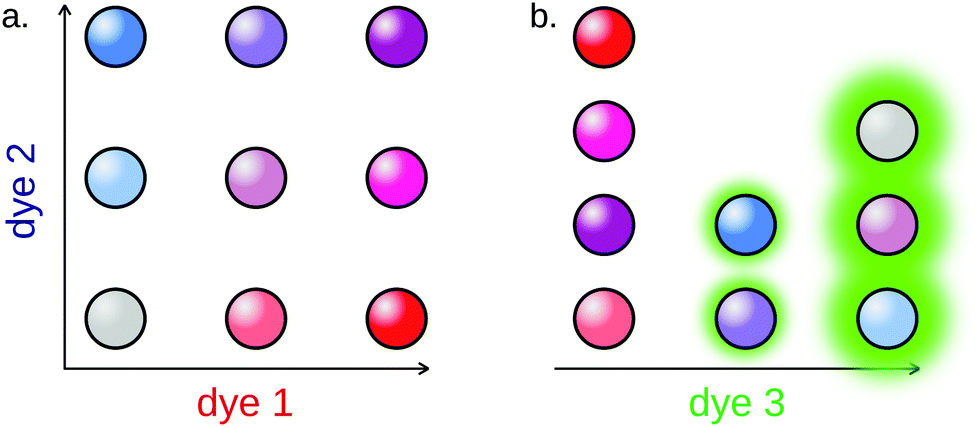 | ||
| Fig. 12 Example of fluorescent particle barcoding. (a) Fluorescent particle barcoding allows to overcome the “one color per target” barrier by combining intensity levels of fluorophores. In this example, using 2 dyes, each of which can be introduced in 3 distinct intensity levels, allows the barcoding of up to 32 = 9 subpopulations. (b) Reporting is performed using an independent fluorescence channel, the intensity of which can be used to compute the miRNA concentration. | ||
The Luminex xMAP system is a commercial set of more than 100 fluorescent microparticles subpopulations, widely used for multiplex detection assays. Li et al. applied this system for the amplification-free detection of 4 miRNAs in a single assay.183 The technique displayed a relatively high detection limit (500 fM). Causa and coworkers notably reported another amplification-free 3-plex method using fluorescent hydrogel particles, displaying remarkable sensitivity for such assays, in the fM range.180 A similar limit of detection was achieved by Tao's group.184 Additionally, the authors managed to break the “one target per color” barrier by relying on particle colocalization for reporting: 6 miRNAs were simultaneously detected using only 4 fluorescent particles populations.
Fluorescent particles are also compatible with amplification techniques, such as DSNSA,182 strand-displacement amplification105 or SIMOA detection. The single molecule array (SIMOA) is a suspension array designed by Quanterix corporation. This system allows the detection of analytes down to the single-molecule level thanks to microfluidics.185,186 Originally developed for the detection of proteins,185,187,188 the assay was later adapted to digital nucleic acid detection (Fig. 13).189 In this technology, microparticles are functionalized with miRNA-specific capture probes. The target miRNA is used to bridge the capture probe and a reporter oligonucleotide tagged with a beta-galactosidase. The particles are then isolated in individual wells carved on a microfluidic chip. The hydrolysis of a fluorogenic substrate by the beta-galactosidase reports the capture of the target in each well. Fluorescent imaging of the microfluidic chamber, followed by poissonian analysis allows the absolute quantification of the target. Cohen et al. reported a 3-plex digital detection of miRNAs using the SIMOA system.179 The assay showed good sensitivity, as the limit of detection was approximately 10 fM. In order to improve the specificity of the multiplex detection, LNA capture probes were designed, which prevented any cross-reactivity between the three targets. The method was further validated by a comparison with gold-standard RT-qPCR, showing convincing results even from total RNA cell extracts.
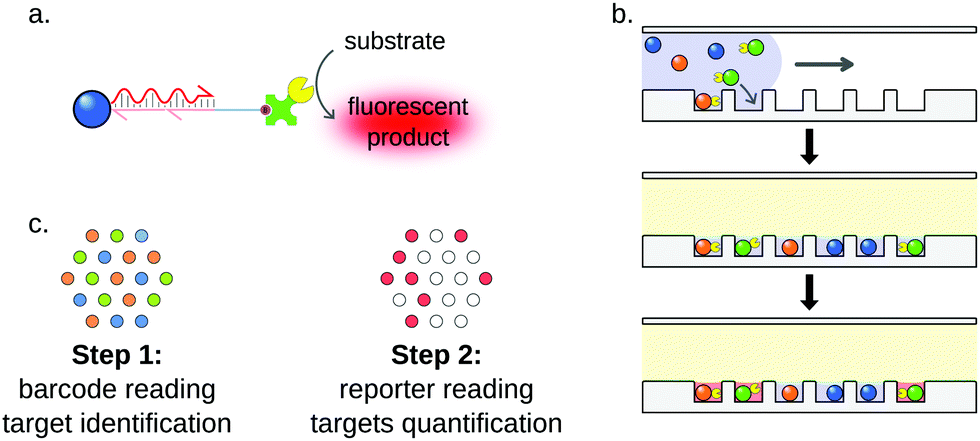 | ||
| Fig. 13 Principle of the SIMOA detection system. (a) The hybridization of the miRNA to its specific capture probes allows the capture of β-galactosidase on a barcoded microparticle. (b) Simplified workflow. After enzyme capture, particles are trapped in individual microwells and incubated. (c) Readout is performed in two steps. First, particle barcodes are read, enabling target identification. Then, reporter fluorescence is measured, indicating whether the targeted miRNA was captured or not. Since the capture of miRNAs by particles follows a Poisson distribution, absolute quantification of the target can be achieved by simply counting “ON” and “OFF” wells for each miRNA. | ||
3.3.4.2 Graphical barcoding. Graphical barcoding consists in shaping or engraving visual patterns in order to differentiate beads subpopulations. This strategy allows for highly multiplexed assays, as the pool of potential symbols or patterns that can be encoded in the particles is only limited by patterning resolution.190 Doyle's group extensively used such encoded particles for multiplexed miRNA detection.191–193 Their hydrogel particles are barcoded by a set of five length-coded stripes, using stop-flow lithography. As there are three possible lengths for each stripe, there are 35 = 243 possible combinations. The authors demonstrated the potential of these particles for miRNA detection in real samples, such as formalin-fixed paraffin-embedded tissue192 or raw cell lysates.193 The introduction of a RCA amplification step increased the sensitivity of the assay by 100-fold.191 The same group also designed polygon-shaped, easily recognizable particles for mobile phone readout.194 Doyles group also designed digital patterns, with a set of 8 spots, each of them being in a 0 (no engraving) or 1 (engraved) state, for a similar capacity (256 combinations).195 As a proof of concept, the authors demonstrated a multiplex assay where barcoded hydrogel particles targeting 3 different miRNAs are individually trapped in a microfluidic chamber prior to an enzymatic (β-galactosidase) signal amplification, achieving a 10 fM limit of detection. A similar digital encoding was used by Liu on silica particles, reaching 128 possible sub-populations and demonstrating a duplex assay.196 The experimental design included a RCA step to improve sensitivity, reaching 1 fM. Jung and co-workers reached an exceptional 312 combinations with radially-encoded polyethylene glycol half-spheres, which they used in combination with qPCR-based detection method.190 MiRNA-specific primers are chemically grafted in the gel matrix, and the particles are graphically encoded by lithography. Following a common RT step, cDNAs are specifically captured by the immobilized primers, inside the pores of the corresponding particle. RT-qPCR is then performed using universal reverse primers in solution. After each cycle, the fluorescence of each particle is measured by microscopy. The method allowed to perform a 10-plex detection from purified extracellular vesicles. The sensitivity of the assay was significantly reduced (1 pM) compared to conventional RT-qPCR. The authors report that the specificity of this supported qPCR is superior to that of solution qPCR. In spite of this exceptional multiplexing ability, such techniques are neither as easy, nor as commonly used as fluorescence barcoding strategies, possibly because of the need for special equipment and expertise for generating the particles (Fig. 14).
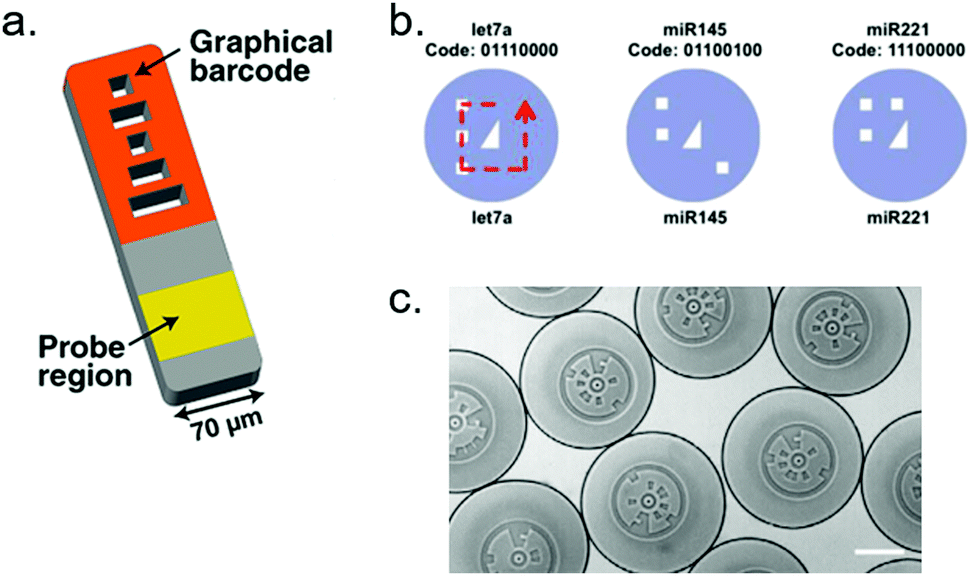 | ||
| Fig. 14 Examples of graphical particle barcoding. (a) Hydrogel particle encoded by 5 stripes of various lengths. Picture extracted from Chapin and Doyle.191 (b) Example of digital encryption: each particle presents 8 spots that can be engraved (1 state) or not (0 state). The central triangle is used for orientation. Picture from Kim et al.195 (c) Each particle carries a circular barcode divided in 16 angular sectors. Picture from Jung et al.190 | ||
3.3.4.3 Photonic crystals. A photonic band-gap crystal, or photonic crystal (PhC), is a spatially periodic structure composed of materials having different dielectric constants.197 In such structures, photons of a chosen wavelength can not propagate and are therefore reflected, whereas all other wavelengths are transmitted. The excluded wavelength, or bandgap, depends on dielectric constants of the materials and on the characteristics of the periodic lattice itself. The reflected wavelength range is thus highly tunable. The advantages of using photonic crystals as particle barcodes are numerous: PhCs are highly stable and are not affected by photobleaching. Being a fluorescence-free strategy, photonic crystal particles do not interfere with fluorescent reporting.198–200 Contrary to fluorescence barcoding, photonic crystal particles cannot be intensity-encoded. Moreover, the reflection spectra of PhCs are Gaussian peaks with a typical half-height width of 25 nm,199 which limits the number of simultaneously distinguishable populations, just like overlapping emission spectra do for fluorescence barcoding. The preparation of such particles is also a limitation, as it is very expertise-demanding. These drawbacks may explain why, in spite of their attractive qualities, PhC particles are still an uncommon barcoding strategy (Fig. 15).
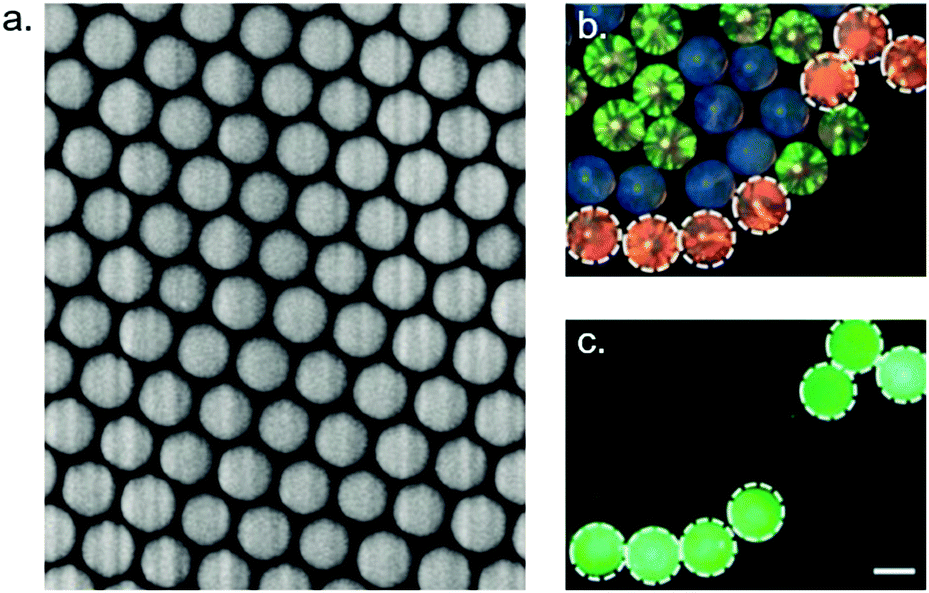 | ||
| Fig. 15 Photonic crystal particles. (a) Electron microscopy image of the surface of a photonic crystal particle. (b) Reflection images of photonic particles with blue, green and red structural colors. (c) Fluorescence image of the particles shown on (b). Green fluorescence intensity allows quantification of the corresponding target. White light reflection by the photonic crystal and fluorescence emission are completely independent. Pictures from Bian et al.198 | ||
The use of PhC particles for multiplexed miRNA detection was demonstrated by Zhao's group, either coupled to RCA199 or HCR.198,200 The highest sensitivity was obtained using a RCA step, with a LOD of 20 fM. All designs allowed the detection of up to 3 miRNAs simultaneously. Due to overlapping reflection spectra, the maximum multiplicity of PhCs appears to be 5 subpopulations.
3.3.4.4 Size encoding. Particle size encoding is an easy way for subpopulations barcoding. Size-coded particles can simply be differentiated by microscopy, or flow cytometry by measuring particles forward light scattering (FSC).201,202 Particles of different sizes but similar densities can also be distinguished based on their mass, using separative techniques such as field-flow fractionation (FFF)203 or acoustic levitation.204 Size-based barcoding is however a relatively uncommon strategy, mostly because of its low multiplexing potential, as none of the aforementioned techniques can detect subtle size variations. To our knowledge, the highest demonstrated multiplex miRNA detection using size-coded particles was a 4-plex assay by Wang et al.202
Although size coding may not be easily scalable, the main quality of this method is its compatibility with other barcoding strategies. The combination of fluorescent barcoding with an additional size-based encryption level appears as particularly promising: both approaches can easily be combined, as affinity tag-coated particles of various sizes are widely available. Moreover, both particle size and fluorescence can be measured simultaneously by flow cytometry, which makes this multimodal strategy particularly convenient.
3.3.4.5 Other barcoding strategies. Among the numerous suspension-based methods for multiplexed miRNA detection, Kim and coworkers proposed a unique barcoding strategy.205 Their approach is based on three encryption levels: first, they used plasmonic nanoparticles as detection particles. The three different kinds of particles (gold–silver nanorods, gold nanospheres and silver nanospheres) had different light-scattering signatures (red, green and blue, respectively). The second unique feature of this work is kinetic encoding: the particles were also discriminated based on their mobility. For each kind of plasmonic particles, half was functionalized with lipids that could interact with an immobile 2D lipid bilayer, hindering the mobility of the particle. The other half was left free in solution, creating a new dimension of barcoding composed of two levels (mobile and immobile). The third encryption level was linked to the reporting, as target detection was signaled by the colocalization of an immobilized particle with a mobile one. This method allowed for the detection of 9 miRNA targets using only six particle subpopulations. The sensitivity was rather low, however, since the LOD is around 10 pM.
3.4 Multiplex microRNA detection from live cells
Although most of the miRNA detection methods presented in this review aim at quantifying miRNAs in cell extracts or bodily fluids, some multiplex methods were also developed to detect miRNAs in live cells. The detection of miRNAs from live cells presents different challenges than detection from biofluids: the quantification method needs to be particularly robust to resist to the complex environment of the cell, while being perfectly biocompatible to avoid damaging it. Most of the reported methods rely on color-coded fluorescent probes quenched by nanoparticles206,207 or nanosheets.208–211 Zhou et al. designed an assembly of DNA strands forming a tetrahedron that changes its conformation to emit fluorescence upon miRNA hybridization.212 Similar DNA frameworks were applied by several groups to multiplex miRNA detection thanks to the great versatility and biocompatibility of this approach (Fig. 16).213,214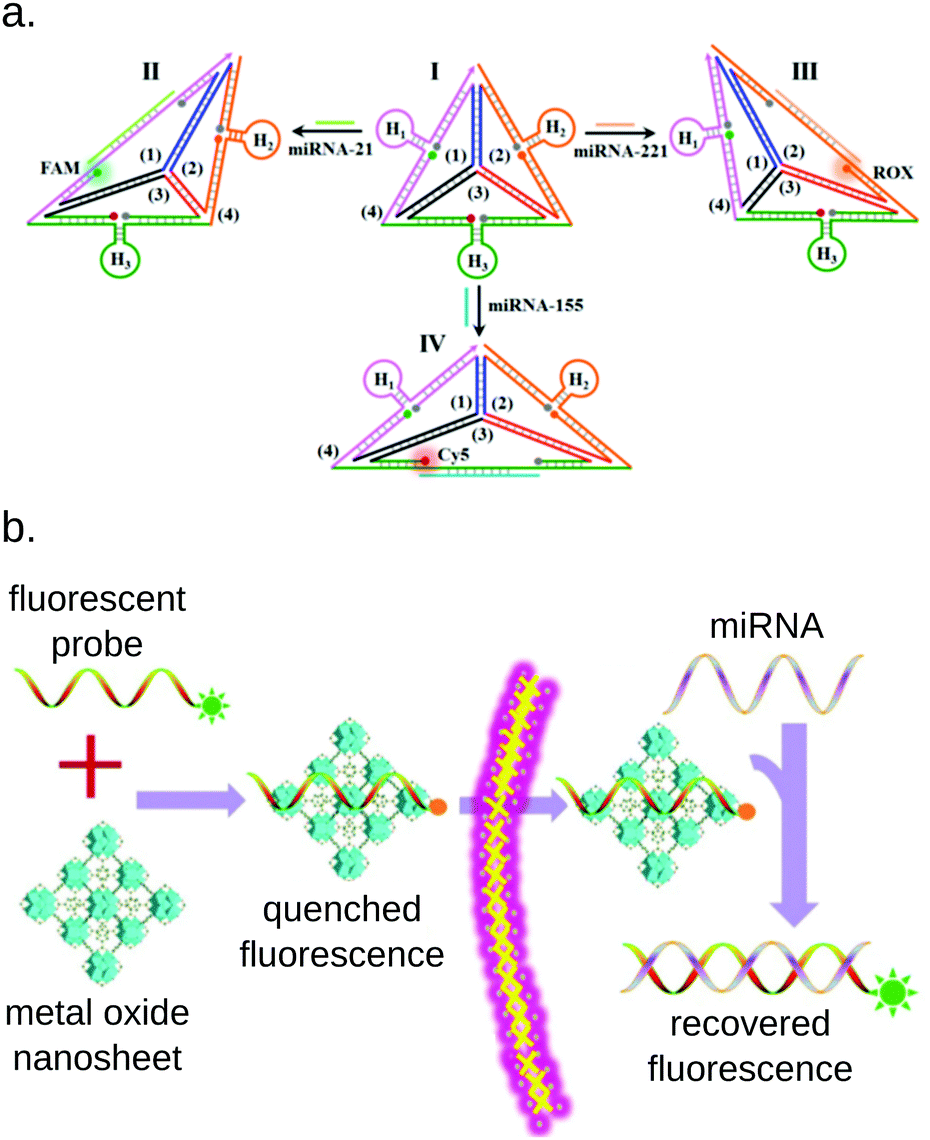 | ||
| Fig. 16 Examples of common approaches for miRNA detection from live cells. (a) DNA framework allowing the simultaneous of 3 miRNAs simultaneously. All 3 fluorophores are initially quenched. The binding of a miRNA changes the conformation of the framework, taking the corresponding fluorophore and its quencher apart. Picture from Zhou et al.213 (b) MiRNA detection based on metal oxide nanosheets. The fluorescent probes are initially embedded in the nanosheet, which quenches their fluorescence. Upon miRNA hybridization, the probe is freed from the nanosheet, and fluorescence is recovered. Picture from Wu et al.209 | ||
Signal amplification in live cells is particularly challenging, since it requires biocompatibility, which is not required for ex vivo detection. Lu et al. managed to implement DSNSA in live cells,215 while Meng and coworkers combined strand-displacement and DNAzyme amplifications in order to increase the sensitivity of their assay.216 Interestingly, Wang et al. took advantage of the cells expression machinery by introducing plasmids promoting the production of fluorescent proteins (e.g. GFP, mRFP) once the miRNA is captured.217 All of the aforementioned techniques rely on fluorescence for detection, and are limited by the one-color-per-target barrier. Wang and coworkers implemented successive cycles composed of an HCR amplification step, fluorescence imaging followed by the degradation of HCR hairpins by DNAse I to increase the multiplexing ability of their method to 12.218 As an alternative to fluorescence, Zhou et al. used SERS to detect 2 miRNAs simultaneously in live cells.219
4 Conclusions and perspectives
Conventional miRNA detection methods suffer from symmetrical limitations: RT-qPCR is highly sensitive, but its multiplex capacity is limited by the lack of spectrally-resolved fluorescent probes, whereas planar microarrays can detect up to thousands of miRNAs simultaneously but display relatively low sensitivity. In this review, we reported innovative miRNA sensing methods aiming at detecting very low concentrations while being highly multiplexable. Signal overlap still limits the multiplex ability of methods using an independent reporter for each targeted miRNA. This is not only the case for fluorescence-based methods, but also applies to electrochemical or Raman-scattering readouts. Consequently, alternative target indexation methods were implemented to boost the multiplex capacity. Suspension arrays are currently emerging as very promising detection methods. The wide diversity and versatility of functionalizable particles offer high multiplexing potential and compatibility with multiple readout strategies, while the suspension format allows higher sensitivity and throughput than planar microarrays. Although the low concentrations of miRNAs in bodily fluids are still challenging to reach for numerous methods, the field greatly benefited from the design of novel nucleic acid amplification techniques. The development of highly sensitive readout methods, such as SERS, SPR or electrochemical labels, has also been instrumental in the improvement of the sensitivity of assays.Due to the high sequence homology encountered in the miRNA world, multiplex assays would also need to be highly specific. Different strategies have been explored to increase target specificity. These include the design of selective capture oligonucleotides that discriminate miRNAs taking into account the difference in free energy (using secondary-structured probes or chemical modifications such as LNA). Similarly, specific reporting probes (e.g. hydrolysis probes) may be used to discriminate the target sequence from nonspecific reactions. In enzyme-based systems, the choice of the enzyme(s) (polymerase, ligase, restriction enzyme, RNAse or other nucleases) is crucial to maximise the assay selectivity with respect to homologous target sequences. Finally, support-assisted designs seem promising leads for improving specificity in multiplexed format.113,174,220 We refer the readers to a recent review from Ouyang et al., in which the specificity of microRNA detection is thoroughly discussed.92
In all the above-mentioned multiplex methods, each miRNA target is individually quantified using independent bioreceptors and data analysis allows to reconstruct the sample profile. These techniques are ideally suited to accurately profile miRNAs and discover novel disease-related signatures. Complementary approaches are focusing on the in vitro integration of the data processing step. Conceptually, a DNA circuit is built to integrate the presence or absence of a set of miRNAs, transduce this information in moleculo, and report an output that depends on the programmable circuits architecture. More than a decade ago, Seelig and coworkers conceived a 11-gate amplification-free DNA circuit that accepts 6 miRNA sequences as input (Let-7c AND miR-124a AND (miR-15a OR miR-10b) AND (miR-143 OR miR-122a)), resulting in the classification of the samples according to the presence or absence of DNA analogues of the targeted sequences.221 Other groups have cascaded HCR and/or DNAzyme amplification to assemble Boolean logic circuits, using fluorescence,222 colorimetric223 or nanopore readout.224 Although conceptually elegant, these demonstrations use hundreds of nanomolars to subnanomolar of discrete concentrations of miRNA input, making them unsuitable for clinical applications without substantial sensitivity improvement. Yet another path exploits DNA architectures that emulate neural networks to perform sample classification based on biomolecules concentrations.221,222 Coupled to PCR and RCA amplification, such approach has recently proven capable of cancer diagnosis from plasma samples:225 after training an in silico classifier from publicly-available miR-seq profile and identified a 4-miRNA signature of non-small cell lung cancer, Zhang et al. implemented a DNA classifier that computes the weighted sum of all 4 miRNA targets and returns a yes/no diagnosis. To reach clinically relevant sensitivity, miRNAs from plasma samples were first amplified by RT-PCR and converted to circular single-stranded DNA, subsequently used as input for the molecular computation. Yet to be confirmed, an advantage of these emerging concepts is that the complexity to measure independently miRNA markers is transferred from the technology (microarray, microfluidics, sequencing, etc.) to the molecular chemistry, opening the door to miRNA profiling kits for rapid testing, for example for routine screening of cancer diseases from minimally invasive, low-cost procedure, which would expand the arsenal of multiplexed microRNA detection technologies (Table 1).
| Type | Amplification | LOD | Readout | Target indexation | Highest multiplex | Ref. |
|---|---|---|---|---|---|---|
| Homogeneous | HCR | 25 amol | NB | Fluorescent dye | 3 | Schwarzkopf et al.86 |
| Homogeneous | Ligation PCR | 1 pM | PAGE | Size separation | 9 | Arefian et al.93 |
| Homogeneous | No | 130 fM | Agarose gel | Conformation separation | 5 | Chandrasekaran et al.94 |
| Homogeneous | No | 190 fM* | CE | Size separation | 5 | Jiang et al.95 |
| Homogeneous | Ligation PCR | 200 aM | CE | Size separation | 5 | Zhang et al.96 |
| Homogeneous | EXPAR | 2 fmol | CE | Conformation separation | 8 | Na et al.98 |
| Homogeneous | DSNSA | 260 aM | HPLC | Size separation | 3 | Qi et al.99 |
| Homogeneous | No | 200 pM* | Fluorescence | Fluorescent dye | 3 | Jin et al.103 |
| Homogeneous | No | 40 pM* | Fluorescence | Fluorescent dye | 3 | Qiu et al.104 |
| Homogeneous | No | 500 pM* | Fluorescence | FRET decay time | 2 | Qiu et al.105 |
| Homogeneous | No | 40 pM | Fluorescence | Fluorescent dye | 4 | Ye et al.109 |
| Homogeneous | RCA | 90 fM* | Fluorescence | Fluorescent dye | 3 | Wang et al.110 |
| Homogeneous | HCR | 0.88 pM* | Fluorescence | FRET decay time | 2 | Guo et al.106 |
| Homogeneous | CHA | 1.8 pM* | Fluorescence | FRET decay time | 2 | Xu et al.107 |
| Homogeneous | RCA | 0.3 fM* | Fluorescence | FRET dye and decay time | 4 | Qiu et al.108 |
| Homogeneous | DNAzyme | 15 fM | Fluorescence | Fluorescent dye | 3 | Tang et al.111 |
| Homogeneous | DSNSA | 100 fM* | Fluorescence | Fluorescent dye | 3 | Yin et al.76 |
| Homogeneous | DSNSA | 9 pM* | Fluorescence | Fluorescent dye | 3 | Cui et al.112 |
| Homogeneous | DSNSA | 0.8 pM* | Fluorescence | Fluorescent dye | 2 | Liu et al.137 |
| Homogeneous | DSNSA | 10 fM* | Fluorescence | Fluorescent dye | 3 | Xiao et al.113 |
| Homogeneous | EXPAR-like | 10 fM | Fluorescence (digital) | Fluorescent dye | 3 | Rondelez and Gines117 |
| Homogeneous | RCA | 47 fM* | Flow cytometry | Combination of dyes | 2 | Smith et al.118 |
| Homogeneous | RCA | 1 pM* | Flow cytometry | Combination of dyes | 3 | Hu et al.120 |
| On-sensor | DSNSA* | 3 fmol | Voltammetry | Electrolabels | 2 | Yang et al.131 |
| On-sensor | DNAzyme | 50 aM* | Voltammetry | Electrolabels | 2 | Chang et al.132 |
| On-sensor | No | 20 aM | Voltammetry | Electrolabels | 2 | Xu et al.133 |
| On-sensor | No | 50 fM* | Voltammetry | Electrolabels | 2 | Zhu et al.134 |
| On-sensor | No | 0.2 fM | Voltammetry | Electrolabels | 2 | Wang et al.135 |
| On-sensor | No | 0.3 pM* | Voltammetry | Electrolabels | 2 | Azzouzi et al.136 |
| On-sensor | DSNSA | 58 fmol* | MS | Lanthanide tags | 3 | Zhang et al.138 |
| On-sensor | No | 1 pM | SERS | Raman labels | 3 | Su et al.140 |
| On-sensor | No | 10 fM* | SERS | Raman labels | 3 | Zhou et al.141 |
| On-sensor | No | N/A | SERS | Raman labels | 2 | Wang et al.142 |
| On-sensor | No | 2 fM* | Raman spectrometry | miRNA Raman signature | 3 | Kim et al.143 |
| Microarray (plan.) | No | 1 aM | SERS | Spatial | 3 | Lee et al.165 |
| Microarray (plan.) | No | 200 fM* | SERS | Spatial | 8 | Liu et al.166 |
| Microarray (plan.) | No | 500* fM | SPR | Spatial | 4 | Sguassero et al.167 |
| Microarray (plan.) | No | 30 fM | SPR | Spatial | 3 | Yeung et al.168 |
| Microarray (plan.) | No | 10 pM | Microring resonator | Spatial | 4 | Qavi et al.169 |
| Microarray (plan.) | No | <1 pM | Electrochemical | Spatial | 8 | Hofmann et al.170 |
| Microarray (plan.) | Trapped enzyme | 1 aM* | Electrochemical | Spatial | 3 | Wen et al.171 |
| Microarray (plan.) | No | 260 fM* | Au NP aggregation | Spatial | 3 | Lee et al.172 |
| Microarray (plan.) | RT-qPCR | 10 pg μL−1 | Fluorescence | Spatial | 5 | Choi et al.173 |
| Microarray (plan.) | RT-qPCR | 2 amol | Fluorescence | Spatial | 5 | Jung et al.174 |
| Microarray (plan.) | LAMP | 20 copies per μL | Voltammetry | Spatial | 5 | Hashimoto et al.175 |
| Microarray (plan.) | Dendritic | 50 fM | Fluorescence | Spatial | 3 | Ishihara et al.226 |
| Microarray (plan.) | DSNSA | N/A | Fluorescence | Spatial | 14 | Mader et al.177 |
| Microarray (susp.) | SIMOA | 1 fM* | Fluorescence | Fluorescent barcodes | 3 | Cohen et al.179 |
| Microarray (susp.) | No | 1 fM | Fluorescence | Fluorescent barcodes | 3 | Causa et al.180 |
| Microarray (susp.) | Strand displacement | 400 aM | Fluorescence | Fluorescent barcodes | 3 | Qu et al.181 |
| Microarray (susp.) | No | 500 fM | Fluorescent | Fluorescent barcodes | 4 | Li et al.183 |
| Microarray (susp.) | No | 1 fM* | Particle colocalization | Fluorescent barcodes | 6 | Tao et al.184 |
| Microarray (susp.) | DSNSA | 0.5 pM | Fluorescence | Fluorescent barcodes | 2 | Wang et al.227 |
| Microarray (susp.) | RT-qPCR | 100 fM | Fluorescence | Graphical barcodes | 5 | Jung et al.190 |
| Microarray (susp.) | RCA | 300 aM* | Fluorescence | Graphical barcodes | 3 | Chapin and Doyle191 |
| Microarray (susp.) | Trapped enzyme | 4 pM* | Colorimetry | Graphical barcodes | 3 | Juthani and Doyle194 |
| Microarray (susp.) | No | 2 amol* | Fluorescence | Graphical barcodes | 5 | Lee et al.192 |
| Microarray (susp.) | No | 2 amol* | Fluorescence | Graphical barcodes | 5 | Nagarajan et al.193 |
| Microarray (susp.) | Trapped enzyme | 60 zmol* | Fluorescence | Graphical barcodes | 3 | Kim et al.195 |
| Microarray (susp.) | RCA | 500 aM* | Fluorescence | Graphical barcodes | 2 | Liu et al.196 |
| Microarray (susp.) | HCR | 10 pM | Fluorescence | Photonic crystals | 3 | Bian et al.198 |
| Microarray (susp.) | RCA | 20 fM | Fluorescence | Photonic crystals | 3 | Wei et al.200 |
| Microarray (susp.) | HCR | 1 nM | Fluorescence | Photonic crystals | 3 | Xu et al.199 |
| Microarray (susp.) | DNAzyme | 30 pM* | Fluorescence | Particle size | 4 | Wang et al.202 |
| Microarray (susp.) | No | 10 fM | SERS | Particle size | 3 | Shin et al.203 |
| Microarray (susp.) | No | 2 pM* | Acoustic levitation | Particle size | 2 | Miyagawa et al.204 |
| Microarray (susp.) | No | 3 pM | Particle colocalization | Optical + mobility | 9 | Kim et al.205 |
Conflicts of interest
G. G., Y. R., T. J., and V. T. are inventors on a patent application related to this work (no. EP 19305670.2, filed 27 May 2019). The authors declare no other conflict of interest.Acknowledgements
This research was supported by the Université de Recherche Paris Sciences et Lettres (PSL), the ESPCI-Paris, the Université de Paris, the Centre National de la Recherche Scientifique (CNRS), the Institut National de la Santé et de la Recherche Médicale (INSERM), the Ligue Nationale Contre le Cancer (LNCC, Program “Equipe labelisée LIGUE”; no. EL2016.LNCC/VaT), and the European Research Council (grants 647275 ProFF, 780519 DeepMiR and 949493 MoP-MiP). T. J. received a PhD fellowship from the Conseil Régional d’Ile de France (grant ARDoc 17012687). We thank the SIRIC CARPEM and the Physicancer program (no. PC201423) fundings.Notes and references
- R. C. Lee, R. L. Feinbaum and V. Ambros, Cell, 1993, 75, 843–854 CrossRef CAS.
- R. C. Friedman, K. K.-H. Farh, C. B. Burge and D. P. Bartel, Genome Res., 2009, 19, 92–105 CrossRef CAS.
- A. Fire, S. Xu, M. K. Montgomery, S. A. Kostas, S. E. Driver and C. C. Mello, Nature, 1998, 391, 806–811 CrossRef CAS.
- D. P. Bartel, Cell, 2004, 116, 281–297 CrossRef CAS.
- H. Schwarzenbach, N. Nishida, G. A. Calin and K. Pantel, Nat. Rev. Clin. Oncol., 2014, 11, 145–156 CrossRef CAS.
- M. Ha and V. N. Kim, Nat. Rev. Mol. Cell Biol., 2014, 15, 509–524 CrossRef CAS.
- J. Höck and G. Meister, Genome Biol., 2008, 9, 210 CrossRef.
- J. O’Brien, H. Hayder, Y. Zayed and C. Peng, Front. Endocrinol., 2018, 9, 402 CrossRef.
- K. Saliminejad, H. R. Khorram Khorshid, S. Soleymani Fard and S. H. Ghaffari, J. Cell. Physiol., 2019, 234, 5451–5465 CrossRef CAS.
- G. A. Calin, C. D. Dumitru, M. Shimizu, R. Bichi, S. Zupo, E. Noch, H. Aldler, S. Rattan, M. Keating, K. Rai, L. Rassenti, T. Kipps, M. Negrini, F. Bullrich and C. M. Croce, Proc. Natl. Acad. Sci. U. S. A., 2002, 99, 15524–15529 CrossRef CAS.
- Y. Peng and C. M. Croce, Signal Transduction Targeted Ther., 2016, 1, 15004 CrossRef.
- A. E. Roser, L. Caldi Gomes, J. Schünemann, F. Maass and P. Lingor, Front. Neurosci., 2018, 12, 625 CrossRef.
- E. Satake, M. G. Pezzolesi, Z. I. Md Dom, A. M. Smiles, M. A. Niewczas and A. S. Krolewski, Diabetes, 2018, 67, 1013–1023 CrossRef CAS.
- S. Ultimo, G. Zauli, A. M. Martelli, M. Vitale, J. A. McCubrey, S. Capitani and L. M. Neri, Oncotarget, 2018, 9, 17238–17254 CrossRef.
- G. A. Calin and C. M. Croce, Oncogene, 2006, 25, 6202–6210 CrossRef CAS.
- H. Tagawa and M. Seto, Leukemia, 2005, 19, 2013–2016 CrossRef CAS.
- Y. Hayashita, H. Osada, Y. Tatematsu, H. Yamada, K. Yanag-isawa, S. Tomida, Y. Yatabe, K. Kawahara, Y. Sekido and T. Takahashi, Cancer Res., 2005, 65, 9628–9632 CrossRef CAS.
- K. A. O’Donnell, E. A. Wentzel, K. I. Zeller, C. V. Dang and J. T. Mendell, Nature, 2005, 435, 839–843 CrossRef.
- T.-C. Chang, D. Yu, Y.-S. Lee, E. A. Wentzel, D. E. Arking, K. M. West, C. V. Dang, A. Thomas-Tikhonenko and J. T. Mendell, Nat. Genet., 2008, 40, 43–50 CrossRef CAS.
- L. He, X. He, L. P. Lim, E. de Stanchina, Z. Xuan, Y. Liang, W. Xue, L. Zender, J. Magnus, D. Ridzon, A. L. Jackson, P. S. Linsley, C. Chen, S. W. Lowe, M. A. Cleary and G. J. Hannon, Nature, 2007, 447, 1130–1134 CrossRef CAS.
- Y. Karube, H. Tanaka, H. Osada, S. Tomida, Y. Tatematsu, K. Yanagisawa, Y. Yatabe, J. Takamizawa, S. Miyoshi, T. Mitsudomi and T. Takahashi, Cancer Sci., 2005, 96, 111–115 CrossRef CAS.
- M. S. Iliou, V. da Silva-Diz, F. J. Carmona, J. Ramalho-Carvalho, H. Heyn, A. Villanueva, P. Muñoz and M. Esteller, Oncogene, 2014, 33, 4003–4015 CrossRef CAS.
- L. He, J. M. Thomson, M. T. Hemann, E. Hernando-Monge, D. Mu, S. Goodson, S. Powers, C. Cordon-Cardo, S. W. Lowe, G. J. Hannon and S. M. Hammond, Nature, 2005, 435, 828–833 CrossRef CAS.
- M. E. Hatley, D. M. Patrick, M. R. Garcia, J. A. Richardson, R. Bassel-Duby, E. van Rooij and E. N. Olson, Cancer Cell, 2010, 18, 282–293 CrossRef CAS.
- J. A. Weber, D. H. Baxter, S. Zhang, D. Y. Huang, K. H. Huang, M. J. Lee, D. J. Galas and K. Wang, Clin. Chem., 2010, 56, 1733–1741 CrossRef CAS.
- X. Chen, H. Liang, J. Zhang, K. Zen and C.-Y. Zhang, Trends Cell Biol., 2012, 22, 125–132 CrossRef CAS.
- P. S. Mitchell, R. K. Parkin, E. M. Kroh, B. R. Fritz, S. K. Wyman, E. L. Pogosova-Agadjanyan, A. Peterson, J. Noteboom, K. C. O’Briant, A. Allen, D. W. Lin, N. Urban, C. W. Drescher, B. S. Knudsen, D. L. Stirewalt, R. Gentleman, R. L. Vessella, P. S. Nelson, D. B. Martin and M. Tewari, Proc. Natl. Acad. Sci. U. S. A., 2008, 105, 10513–10518 CrossRef CAS.
- S. Roush and F. J. Slack, Trends Cell Biol., 2008, 18, 505–516 CrossRef CAS.
- H. Dong, J. Lei, L. Ding, Y. Wen, H. Ju and X. Zhang, Chem. Rev., 2013, 113, 6207–6233 CrossRef CAS.
- Z. Williams, I. Z. Ben-Dov, R. Elias, A. Mihailovic, M. Brown, Z. Rosenwaks and T. Tuschl, Proc. Natl. Acad. Sci. U. S. A., 2013, 110, 4255–4260 CrossRef CAS.
- A. Esquela-Kerscher and F. J. Slack, Nat. Rev. Cancer, 2006, 6, 259–269 CrossRef CAS.
- S. R. Pfeffer, C. H. Yang and L. M. Pfeffer, Drug Dev. Res., 2015, 76, 270–277 CrossRef CAS.
- J. Lu, G. Getz, E. A. Miska, E. Alvarez-Saavedra, J. Lamb, D. Peck, A. Sweet-Cordero, B. L. Ebert, R. H. Mak, A. A. Ferrando, J. R. Downing, T. Jacks, H. R. Horvitz and T. R. Golub, Nature, 2005, 435, 834–838 CrossRef CAS.
- N. Yanaihara, N. Caplen, E. Bowman, M. Seike, K. Kumamoto, M. Yi, R. M. Stephens, A. Okamoto, J. Yokota, T. Tanaka, G. A. Calin, C.-G. Liu, C. M. Croce and C. C. Harris, Cancer Cell, 2006, 9, 189–198 CrossRef CAS.
- M. Kahraman, A. Röske, T. Laufer, T. Fehlmann, C. Backes, F. Kern, J. Kohlhaas, H. Schrörs, A. Saiz, C. Zabler, N. Ludwig, P. A. Fasching, R. Strick, M. Rübner, M. W. Beckmann, E. Meese, A. Keller and M. G. Schrauder, Sci. Rep., 2018, 8, 11584 CrossRef.
- H. Zhang, M. Zhu, X. Shan, X. Zhou, T. Wang, J. Zhang, J. Tao, W. Cheng, G. Chen, J. Li, P. Liu, Q. Wang and W. Zhu, Gene, 2019, 687, 246–254 CrossRef CAS.
- T. Ueda, S. Volinia, H. Okumura, M. Shimizu, C. Taccioli, S. Rossi, H. Alder, C.-G. Liu, N. Oue, W. Yasui, K. Yoshida, H. Sasaki, S. Nomura, Y. Seto, M. Kaminishi, G. A. Calin and C. M. Croce, Lancet Oncol., 2010, 11, 136–146 CrossRef CAS.
- S. Yerukala Sathipati and S.-Y. Ho, Sci. Rep., 2018, 8, 16138 CrossRef.
- X.-H. Shi, X. Li, H. Zhang, R.-Z. He, Y. Zhao, M. Zhou, S.-T. Pan, C.-L. Zhao, Y.-C. Feng, M. Wang, X.-J. Guo and R.-Y. Qin, Sci. Rep., 2018, 8, 7638 CrossRef.
- G. Gines, R. Menezes, W. Xiao, Y. Rondelez and V. Taly, Mol. Aspects Med., 2020, 72, 100832 CrossRef.
- C. Chen, D. A. Ridzon, A. J. Broomer, Z. Zhou, D. H. Lee, J. T. Nguyen, M. Barbisin, N. L. Xu, V. R. Mahuvakar, M. R. Andersen, K. Q. Lao, K. J. Livak and K. J. Guegler, Nucleic Acids Res., 2005, 33, e179 CrossRef.
- R. Shi and V. L. Chiang, Biotechniques, 2005, 39, 519–525 CrossRef CAS.
- P. Tiberio, M. Callari, V. Angeloni, M. G. Daidone and V. Appierto, BioMed Res. Int., 2015, 2015, 731479 Search PubMed.
- C. K. Raymond, B. S. Roberts, P. Garrett-Engele, L. P. Lim and J. M. Johnson, RNA, 2005, 11, 1737–1744 CrossRef CAS.
- P. Mestdagh, N. Hartmann, L. Baeriswyl, D. Andreasen, N. Bernard, C. Chen, D. Cheo, P. D’Andrade, M. DeMayo, L. Dennis, S. Derveaux, Y. Feng, S. Fulmer-Smentek, B. Gerstmayer, J. Gouffon, C. Grimley, E. Lader, K. Y. Lee, S. Luo, P. Mouritzen, A. Narayanan, S. Patel, S. Peiffer, S. Rüberg, G. Schroth, D. Schuster, J. M. Shaffer, E. J. Shelton, S. Silveria, U. Ulmanella, V. Veeramachaneni, F. Staedtler, T. Peters, T. Guettouche, L. Wong and J. Vandesompele, Nat. Methods, 2014, 11, 809–815 CrossRef CAS.
- V. Benes and M. Castoldi, Methods, 2010, 50, 244–249 CrossRef CAS.
- C. A. Raabe, T.-H. Tang, J. Brosius and T. S. Rozhdestvensky, Nucleic Acids Res., 2014, 42, 1414–1426 CrossRef CAS.
- S. A. Bustin, V. Benes, J. A. Garson, J. Hellemans, J. Huggett, M. Kubista, R. Mueller, T. Nolan, M. W. Pfaffl, G. L. Shipley, J. Vandesompele and C. T. Wittwer, Clin. Chem., 2009, 55, 611–622 CrossRef CAS.
- P. Androvic, L. Valihrach, J. Elling, R. Sjoback and M. Kubista, Nucleic Acids Res., 2017, 45, e144 CrossRef.
- J. Zhang, Z. Li, H. Wang, Y. Wang, H. Jia and J. Yan, Chem. Commun., 2011, 47, 9465–9467 RSC.
- P. Kumar, B. H. Johnston and S. A. Kazakov, RNA, 2011, 17, 365–380 CrossRef CAS.
- R. T. Fuchs, Z. Sun, F. Zhuang and G. B. Robb, PLoS One, 2015, 10, e0126049 CrossRef.
- J. Jin, S. Vaud, A. M. Zhelkovsky, J. Posfai and L. A. McReynolds, Nucleic Acids Res., 2016, 44, e116 CrossRef.
- E. J. H. Wee and M. Trau, ACS Sens., 2016, 1, 670–675 CrossRef CAS.
- S. L. Daubendiek, K. Ryan and E. T. Kool, J. Am. Chem. Soc., 1995, 117, 7818–7819 CrossRef CAS.
- D. Liu, S. L. Daubendiek, M. A. Zillman, K. Ryan and E. T. Kool, J. Am. Chem. Soc., 1996, 118, 1587–1594 CrossRef CAS.
- S. P. Jonstrup, J. Koch and J. Kjems, RNA, 2006, 12, 1747–1752 CrossRef CAS.
- H. Takahashi, M. Ohkawachi, K. Horio, T. Kobori, T. Aki, Y. Matsumura, Y. Nakashimada and Y. Okamura, Sci. Rep., 2018, 8, 7770 CrossRef.
- T. Krzywkowski and M. Nilsson, Nucleic Acids Res., 2017, 45, e161 CrossRef CAS.
- R. Deng, L. Tang, Q. Tian, Y. Wang, L. Lin and J. Li, Angew. Chem., Int. Ed., 2014, 53, 2389–2393 CrossRef CAS.
- X. Zhu, Y. Shen, J. Cao, L. Yin, F. Ban, Y. Shu and G. Li, Chem. Commun., 2015, 51, 10002–10005 RSC.
- T. Fan, Y. Mao, Q. Sun, F. Liu, J. Lin, Y. Liu, J. Cui and Y. Jiang, Cancer Sci., 2018, 109, 2897–2906 CrossRef CAS.
- H. Liu, L. Li, L. Duan, X. Wang, Y. Xie, L. Tong, Q. Wang and B. Tang, Anal. Chem., 2013, 85, 7941–7947 CrossRef CAS.
- J. Van Ness, L. K. Van Ness and D. J. Galas, Proc. Natl. Acad. Sci. U. S. A., 2003, 100, 4504–4509 CrossRef CAS.
- E. Tan, J. Wong, D. Nguyen, Y. Zhang, B. Erwin, L. K. Van Ness, S. M. Baker, D. J. Galas and A. Niemz, Anal. Chem., 2005, 77, 7984–7992 CrossRef CAS.
- H. Jia, Z. Li, C. Liu and Y. Cheng, Angew. Chem., Int. Ed., 2010, 49, 5498–5501 CrossRef CAS.
- Y. Cheng, L. Dong, J. Zhang, Y. Zhao and Z. Li, Analyst, 2018, 143, 1758–1774 RSC.
- E. Tan, B. Erwin, S. Dames, T. Ferguson, M. Buechel, B. Irvine, K. Voelkerding and A. Niemz, Biochemistry, 2008, 47, 9987–9999 CrossRef CAS.
- J. Qian, T. M. Ferguson, D. N. Shinde, A. J. Ramírez-Borrero, A. Hintze, C. Adami and A. Niemz, Nucleic Acids Res., 2012, 40, e87 CrossRef CAS.
- K. Montagne, G. Gines, T. Fujii and Y. Rondelez, Nat. Commun., 2016, 7, 13474 CrossRef CAS.
- G. Gines, R. Menezes, K. Nara, A.-S. Kirstetter, V. Taly and Y. Rondelez, Sci. Adv., 2020, 6, eaay5952 CrossRef CAS.
- J. Chen, X. Zhou, Y. Ma, X. Lin, Z. Dai and X. Zou, Nucleic Acids Res., 2016, gkw504 CrossRef.
- J. Chen, T. An, Y. Ma, B. Situ, D. Chen, Y. Xu, L. Zhang, Z. Dai and X. Zou, Anal. Chem., 2018, 90, 859–865 CrossRef CAS.
- D. A. Shagin, D. V. Rebrikov, V. B. Kozhemyako, I. M. Altshuler, A. S. Shcheglov, P. A. Zhulidov, E. A. Bogdanova, D. B. Staroverov, V. A. Rasskazov and S. Lukyanov, Genome Res., 2002, 12, 1935–1942 CrossRef CAS.
- V. E. Anisimova, D. V. Rebrikov, D. A. Shagin, V. B. Kozhemyako, N. I. Menzorova, D. B. Staroverov, R. Ziganshin, L. L. Vagner, V. A. Rasskazov, S. A. Lukyanov and A. S. Shcheglov, BMC Biochem., 2008, 9, 14 CrossRef.
- B.-C. Yin, Y.-Q. Liu and B.-C. Ye, J. Am. Chem. Soc., 2012, 134, 5064–5067 CrossRef CAS.
- Y. Li, J. Zhang, J. Zhao, L. Zhao, Y. Cheng and Z. Li, Analyst, 2016, 141, 1071–1076 RSC.
- H. Zhou, C. Yang, H. Chen, X. Li, Y. Li and X. Fan, Biosens. Bioelectron., 2017, 87, 552–557 CrossRef CAS.
- J. Li, S. Yang, C. Zuo, L. Dai, Y. Guo and G. Xie, ACS Sens., 2020, 5, 970–977 CrossRef CAS.
- Y. Liu, J. Zhang, J. Tian, X. Fan, H. Geng and Y. Cheng, Anal. Bioanal. Chem., 2017, 409, 107–114 CrossRef CAS.
- R. M. Dirks and N. A. Pierce, Proc. Natl. Acad. Sci. U. S. A., 2004, 101, 15275–15278 CrossRef CAS.
- S. Venkataraman, R. M. Dirks, P. W. K. Rothemund, E. Winfree and N. A. Pierce, Nat. Nanotechnol., 2007, 2, 490–494 CrossRef.
- H. M. T. Choi, J. Y. Chang, L. A. Trinh, J. E. Padilla, S. E. Fraser and N. A. Pierce, Nat. Biotechnol., 2010, 28, 1208–1212 CrossRef CAS.
- Q. Guo, F. Bian, Y. Liu, X. Qu, X. Hu and Q. Sun, Chem. Commun., 2017, 53, 4954–4957 RSC.
- H. M. T. Choi, V. A. Beck and N. A. Pierce, ACS Nano, 2014, 8, 4284–4294 CrossRef CAS.
- M. Schwarzkopf and N. A. Pierce, Nucleic Acids Res., 2016, gkw503 CrossRef.
- D. Y. Zhang and E. Winfree, J. Am. Chem. Soc., 2009, 131, 17303–17314 CrossRef CAS.
- C. Ma, W. Wang, Z. Li, L. Cao and Q. Wang, Anal. Biochem., 2012, 429, 99–102 CrossRef CAS.
- J. Chen, B. Liu, X. Song, P. Tong, H. Yang and L. Zhang, Sci. China: Chem., 2015, 58, 1906–1911 CrossRef CAS.
- Y. Liu, T. Shen, J. Li, H. Gong, C. Chen, X. Chen and C. Cai, ACS Sens., 2017, 2, 1430–1434 CrossRef CAS.
- A. Válóczi, C. Hornyik, N. Varga, J. Burgyán, S. Kauppinen and Z. Havelda, Nucleic Acids Res., 2004, 32, e175 CrossRef.
- T. Ouyang, Z. Liu, Z. Han and Q. Ge, Anal. Chem., 2019, 91, 3179–3186 CrossRef CAS.
- E. Arefian, J. Kiani, M. Soleimani, S. A. M. Shariati, S. H. Aghaee-Bakhtiari, A. Atashi, Y. Gheisari, N. Ahmadbeigi, A. M. Banaei-Moghaddam, M. Naderi, N. Namvarasl, L. Good and O. R. Faridani, Nucleic Acids Res., 2011, 39, e80 CrossRef CAS.
- A. R. Chandrasekaran, M. MacIsaac, P. Dey, O. Levchenko, L. Zhou, M. Andres, B. K. Dey and K. Halvorsen, Sci. Adv., 2019, 5, eaau9443 CrossRef CAS.
- R.-M. Jiang, Y.-S. Chang, S.-J. Chen, J.-H. Chen, H.-C. Chen and P.-L. Chang, J. Chromatogr. A, 2011, 1218, 2604–2610 CrossRef CAS.
- P. Zhang, Y. Liu, Y. Zhang, C. Liu, Z. Wang and Z. Li, Chem. Commun., 2013, 49, 10013 RSC.
- K. Wei, J. Zhao, Y. Qin, S. Li, Y. Huang and S. Zhao, Talanta, 2018, 189, 437–441 CrossRef CAS.
- J. Na, G. W. Shin, H. G. Son, S.-J. V. Lee and G. Y. Jung, Sci. Rep., 2017, 7, 11396 CrossRef.
- T. Qi, C. Song, J. He, W. Shen, D. Kong, H. Shi, L. Tan, R. Pan, S. Tang and H. K. Lee, Anal. Chem., 2020, 92, 5033–5040 CrossRef CAS.
- S. A. E. Marras, S. Tyagi, D.-O. Antson and F. R. Kramer, PLoS One, 2019, 14, e0213906 CrossRef CAS.
- A. Rajagopal, A. Scherer, A. Homyk and E. Kartalov, Anal. Chem., 2013, 85, 7629–7636 CrossRef CAS.
- F. Moltzahn, A. B. Olshen, L. Baehner, A. Peek, L. Fong, H. Stöppler, J. Simko, J. F. Hilton, P. Carroll and R. Blelloch, Cancer Res., 2011, 71, 550–560 CrossRef CAS.
- Z. Jin, D. Geißler, X. Qiu, K. D. Wegner and N. Hildebrandt, Angew. Chem., Int. Ed., 2015, 54, 10024–10029 CrossRef CAS.
- X. Qiu and N. Hildebrandt, ACS Nano, 2015, 9, 8449–8457 CrossRef CAS.
- X. Qiu, J. Guo, Z. Jin, A. Petreto, I. L. Medintz and N. Hildebrandt, Small, 2017, 13, 1700332 CrossRef.
- J. Guo, C. Mingoes, X. Qiu and N. Hildebrandt, Anal. Chem., 2019, 91, 3101–3109 CrossRef CAS.
- J. Xu, J. Guo, N. Golob-Schwarzl, J. Haybaeck, X. Qiu and N. Hildebrandt, ACS Sens., 2020, 5, 1768–1776 CrossRef CAS.
- X. Qiu, J. Guo, J. Xu and N. Hildebrandt, J. Phys. Chem. Lett., 2018, 9, 4379–4384 CrossRef CAS.
- W.-Q. Ye, Y.-X. Wei, Y.-Z. Zhang, C.-G. Yang and Z.-R. Xu, Anal. Bioanal. Chem., 2020, 412, 647–655 CrossRef CAS.
- R. Wang, X. Zhao, X. Chen, X. Qiu, G. Qing, H. Zhang, L. Zhang, X. Hu, Z. He, D. Zhong, Y. Wang and Y. Luo, Anal. Chem., 2020, 92, 2176–2185 CrossRef CAS.
- Y. Tang, X. He, R. Yuan, X. Liu, Y. Zhao, T. Wang, H. Chen and X. Feng, Analyst, 2020, 145, 4314–4320 RSC.
- L. Cui, X. Lin, N. Lin, Y. Song, Z. Zhu, X. Chen and C. J. Yang, Chem. Commun., 2012, 48, 194–196 RSC.
- M. Xiao, T. Man, C. Zhu, H. Pei, J. Shi, L. Li, X. Qu, X. Shen and J. Li, ACS Appl. Mater. Interfaces, 2018, 10, 7852–7858 CrossRef CAS.
- S. Robinson, M. Follo, D. Haenel, M. Mauler, D. Stallmann, L. A. Heger, T. Helbing, D. Duerschmied, K. Peter, C. Bode, I. Ahrens and M. Hortmann, Acta Pharmacol. Sin., 2018, 39, 1217–1227 CrossRef CAS.
- S. Robinson, M. Follo, D. Haenel, M. Mauler, D. Stallmann, M. Tewari, D. Duerschmied, K. Peter, C. Bode, I. Ahrens and M. Hortmann, Int. J. Cardiol., 2018, 257, 247–254 CrossRef CAS.
- Q. Zhong, S. Bhattacharya, S. Kotsopoulos, J. Olson, V. Taly, A. D. Griffiths, D. R. Link and J. W. Larson, Lab Chip, 2011, 11, 2167 RSC.
- Y. Rondelez and G. Gines, ACS Sens., 2020, 5, 2430–2437 CrossRef CAS.
- L. D. Smith, Y. Liu, M. U. Zahid, T. D. Canady, L. Wang, M. Kohli, B. T. Cunningham and A. M. Smith, ACS Nano, 2020, 14, 2324–2335 CrossRef CAS.
- M. M. Ali, F. Li, Z. Zhang, K. Zhang, D.-K. Kang, J. A. Ankrum, X. C. Le and W. Zhao, Chem. Soc. Rev., 2014, 43, 3324–3341 RSC.
- Z. Hu, F. Xu, G. Sun, S. Zhang and X. Zhang, Chem. Commun., 2020, 56, 5409–5412 RSC.
- M. Kühnemund, I. Hernández-Neuta, M. Sharif, M. Cornaglia, M. A. Gijs and M. Nilsson, Nucleic Acids Res., 2017, gkw1324 CrossRef.
- S. Barberán-Soler, J. M. Vo, R. E. Hogans, A. Dallas, B. H. Johnston and S. A. Kazakov, Genome Biol., 2018, 19, 105 CrossRef.
- M. R. Friedländer, W. Chen, C. Adamidi, J. Maaskola, R. Einspanier, S. Knespel and N. Rajewsky, Nat. Biotechnol., 2008, 26, 407–415 CrossRef.
- V. P. Dave, T. A. Ngo, A.-K. Pernestig, D. Tilevik, K. Kant, T. Nguyen, A. Wolff and D. D. Bang, Lab. Invest., 2019, 99, 452–469 CrossRef CAS.
- T. C. Glenn, Mol. Ecol. Resour., 2011, 11, 759–769 CrossRef CAS.
- S. Alon, F. Vigneault, S. Eminaga, D. C. Christodoulou, J. G. Seidman, G. M. Church and E. Eisenberg, Genome Res., 2011, 21, 1506–1511 CrossRef CAS.
- Y.-J. Chen, C. N. Takahashi, L. Organick, C. Bee, S. D. Ang, P. Weiss, B. Peck, G. Seelig, L. Ceze and K. Strauss, Nat. Commun., 2020, 11, 3264 CrossRef CAS.
- S. Tam, R. de Borja, M.-S. Tsao and J. D. McPherson, Lab. Invest., 2014, 94, 350–358 CrossRef CAS.
- Q. Yang, J. Lin, M. Liu, R. Li, B. Tian, X. Zhang, B. Xu, M. Liu, X. Zhang, Y. Li, H. Shi and L. Wu, Sci. Adv., 2016, 2, e1501482 CrossRef.
- A. M. L. Coenen-Stass, H. Sork, S. Gatto, C. Godfrey, A. Bhomra, K. Krjutškov, J. R. Hart, J. O. Westholm, L. O’Donovan, A. Roos, H. Lochmüller, P. L. Puri, S. El Andaloussi, M. J. A. Wood and T. C. Roberts, Mol. Ther.–Nucleic Acids, 2018, 13, 1–15 CrossRef CAS.
- C. Yang, B. Dou, K. Shi, Y. Chai, Y. Xiang and R. Yuan, Anal. Chem., 2014, 86, 11913–11918 CrossRef CAS.
- Y. Chang, Z. Wu, Q. Sun, Y. Zhuo, Y. Chai and R. Yuan, Anal. Chem., 2019, 91, 8123–8128 CrossRef CAS.
- S. Xu, Y. Chang, Z. Wu, Y. Li, R. Yuan and Y. Chai, Biosens. Bioelectron., 2020, 149, 111848 CrossRef CAS.
- W. Zhu, X. Su, X. Gao, Z. Dai and X. Zou, Biosens. Bioelectron., 2014, 53, 414–419 CrossRef CAS.
- J. Wang, Z. Lu, H. Tang, L. Wu, Z. Wang, M. Wu, X. Yi and J. Wang, Anal. Chem., 2017, 89, 10834–10840 CrossRef CAS.
- S. Azzouzi, Z. Fredj, A. P. F. Turner, M. B. Ali and W. C. Mak, ACS Sens., 2019, 4, 326–334 CrossRef CAS.
- R. Liu, S. Zhang, C. Wei, Z. Xing, S. Zhang and X. Zhang, Acc. Chem. Res., 2016, 49, 775–783 CrossRef CAS.
- S. Zhang, R. Liu, Z. Xing, S. Zhang and X. Zhang, Chem. Commun., 2016, 52, 14310–14313 RSC.
- E. C. Le, Ru, E. Blackie, M. Meyer and P. G. Etchegoin, J. Phys. Chem. C, 2007, 111, 13794–13803 CrossRef.
- J. Su, D. Wang, L. Nörbel, J. Shen, Z. Zhao, Y. Dou, T. Peng, J. Shi, S. Mathur, C. Fan and S. Song, Anal. Chem., 2017, 89, 2531–2538 CrossRef CAS.
- W. Zhou, Y.-F. Tian, B.-C. Yin and B.-C. Ye, Anal. Chem., 2017, 89, 6120–6128 CrossRef CAS.
- H.-N. Wang, B. M. Crawford, A. M. Fales, M. L. Bowie, V. L. Seewaldt and T. Vo-Dinh, J. Phys. Chem. C, 2016, 120, 21047–21055 CrossRef CAS.
- W. H. Kim, J. U. Lee, S. Song, S. Kim, Y. J. Choi and S. J. Sim, Analyst, 2019, 144, 1768–1776 RSC.
- G. K. Geiss, R. E. Bumgarner, B. Birditt, T. Dahl, N. Dowidar, D. L. Dunaway, H. P. Fell, S. Ferree, R. D. George, T. Grogan, J. J. James, M. Maysuria, J. D. Mitton, P. Oliveri, J. L. Osborn, T. Peng, A. L. Ratcliffe, P. J. Webster, E. H. Davidson, L. Hood and K. Dimitrov, Nat. Biotechnol., 2008, 26, 317–325 CrossRef CAS.
- I. Amit, M. Garber, N. Chevrier, A. P. Leite, Y. Donner, T. Eisenhaure, M. Guttman, J. K. Grenier, W. Li, O. Zuk, L. A. Schubert, B. Birditt, T. Shay, A. Goren, X. Zhang, Z. Smith, R. Deering, R. C. McDonald, M. Cabili, B. E. Bernstein, J. L. Rinn, A. Meissner, D. E. Root, N. Hacohen and A. Regev, Science, 2009, 326, 257–263 CrossRef CAS.
- Y.-H. Su, E. Li, G. K. Geiss, W. J. R. Longabaugh, A. Krämer and E. H. Davidson, Dev. Biol., 2009, 329, 410–421 CrossRef CAS.
- W. Wang, M. Corrigan-Cummins, J. Hudson, I. Maric, O. Simakova, S. S. Neelapu, L. W. Kwak, J. E. Janik, B. Gause, E. S. Jaffe and K. R. Calvo, Haematologica, 2012, 97, 586–594 CrossRef CAS.
- C. Foye, I. K. Yan, W. David, N. Shukla, Y. Habboush, L. Chase, K. Ryland, V. Kesari and T. Patel, PLoS One, 2017, 12, e0189165 CrossRef.
- A. Kozomara, M. Birgaoanu and S. Griffiths-Jones, Nucleic Acids Res., 2019, 47, D155–D162 CrossRef CAS.
- A. Giannoudis, K. Clarke, R. Zakaria, D. Varešlija, M. Farahani, L. Rainbow, A. Platt-Higgins, S. Ruthven, K. A. Brougham, P. S. Rudland, M. D. Jenkinson, L. S. Young, F. Falciani and C. Palmieri, Sci. Rep., 2019, 9, 18518 CrossRef CAS.
- S. B. Dejene, A. W. Ohman, W. Du, D. Randhawa, A. Bradley, N. Yadav, K. M. Elias, D. M. Dinulescu and S. R. Setlur, Cancer Med., 2019, 8, 6709–6716 CrossRef CAS.
- E. A. Hunt, D. Broyles, T. Head and S. K. Deo, Annu. Rev. Anal. Chem., 2015, 8, 217–237 CrossRef CAS.
- M. Guled, L. Lahti, P. M. Lindholm, K. Salmenkivi, I. Bagwan, A. G. Nicholson and S. Knuutila, Genes, Chromosomes Cancer, 2009, 48, 615–623 CrossRef CAS.
- J.-J. Zhao, J. Yang, J. Lin, N. Yao, Y. Zhu, J. Zheng, J. Xu, J. Q. Cheng, J.-Y. Lin and X. Ma, Childs Nerv. Syst., 2009, 25, 13–20 CrossRef.
- E. M. Southern, Methods Mol. Biol., 2001, 170, 1–15 CAS.
- T. Babak, RNA, 2004, 10, 1813–1819 CrossRef CAS.
- J. M. Thomson, J. Parker, C. M. Perou and S. M. Hammond, Nat. Methods, 2004, 1, 47–53 CrossRef CAS.
- R.-Q. Liang, Nucleic Acids Res., 2005, 33, e17 CrossRef.
- C.-G. Liu, G. A. Calin, B. Meloon, N. Gamliel, C. Sevignani, M. Ferracin, C. D. Dumitru, M. Shimizu, S. Zupo, M. Dono, H. Alder, F. Bullrich, M. Negrini and C. M. Croce, Proc. Natl. Acad. Sci. U. S. A., 2004, 101, 9740–9744 CrossRef CAS.
- S. Baskerville and D. P. Bartel, RNA, 2005, 11, 241–247 CrossRef CAS.
- E. A. Miska, E. Alvarez-Saavedra, M. Townsend, A. Yoshii, N. Sestan, P. Rakic, M. Constantine-Paton and H. R. Horvitz, Genome Biol., 2004, 5, R68 CrossRef.
- J. Q. Yin, R. C. Zhao and K. V. Morris, Trends Biotechnol., 2008, 26, 70–76 CrossRef CAS.
- M. Castoldi, RNA, 2006, 12, 913–920 CrossRef CAS.
- S. Roy, J. H. Soh and J. Y. Ying, Biosens. Bioelectron., 2016, 75, 238–246 CrossRef CAS.
- J. U. Lee, W. H. Kim, H. S. Lee, K. H. Park and S. J. Sim, Small, 2019, 15, 1804968 CrossRef.
- X. Liu, R. Tian, J. Gao, D. Liu and Z. Wang, Analyst, 2017, 142, 4529–4535 RSC.
- A. Sguassero, A. Artiga, C. Morasso, R. R. Jimenez, R. M. Rapún, R. Mancuso, S. Agostini, A. Hernis, A. Abols, A. Linē, A. Gualerzi, S. Picciolini, M. Bedoni, M. Rovaris, F. Gramatica, J. M. de la Fuente and R. Vanna, Anal. Bioanal. Chem., 2019, 411, 1873–1885 CrossRef CAS.
- W. K. Yeung, H.-Y. Chen, J.-J. Sun, T.-H. Hsieh, M. Z. Mousavi, H.-H. Chen, K.-L. Lee, H. Lin, P.-K. Wei and J.-Y. Cheng, Analyst, 2018, 143, 4715–4722 RSC.
- A. J. Qavi, J. T. Kindt, M. A. Gleeson and R. C. Bailey, Anal. Chem., 2011, 83, 5949–5956 CrossRef CAS.
- S. Hofmann, Y. Huang, P. Paulicka, A. Kappel, H. A. Katus, A. Keller, B. Meder, C. F. Stähler and W. Gumbrecht, Anal. Chem., 2015, 87, 12104–12111 CrossRef CAS.
- Y. Wen, L. Li, J. Li, M. Lin, G. Liu, W. Liang, L. Xu, Y. Li, X. Zuo, S. Ren and Y. Zhu, Anal. Chem., 2020, 92, 4498–4503 CrossRef CAS.
- H. Lee, J. Lee, S.-G. Lee and P. S. Doyle, Anal. Chem., 2020, 92, 5750–5755 CrossRef CAS.
- W. Choi, S. Y. Yeom, J. Kim, S. Jung, S. Jung, T. S. Shim, S. K. Kim, J. Y. Kang, S. H. Lee, I.-J. Cho, J. Choi and N. Choi, Biosens. Bioelectron., 2018, 101, 235–244 CrossRef CAS.
- S. Jung, W. J. Kim, B. K. Kim, J. Kim, M. J. Kim, K. P. Kim and S. K. Kim, Biosens. Bioelectron., 2020, 163, 112301 CrossRef CAS.
- K. Hashimoto, M. Inada and K. Ito, Anal. Chem., 2019, 91, 3227–3232 CrossRef CAS.
- K. Hosokawa, T. Sato, Y. Sato and M. Maeda, Anal. Sci., 2010, 26, 1053–1057 CrossRef CAS.
- A. Mader, U. Riehle, T. Brandstetter, E. Stickeler and J. Ruehe, Anal. Chim. Acta, 2012, 754, 1–7 CrossRef CAS.
- J. P. Nolan and L. A. Sklar, Trends Biotechnol., 2002, 20, 9–12 CrossRef CAS.
- L. Cohen, M. R. Hartman, A. Amardey-Wellington and D. R. Walt, Nucleic Acids Res., 2017, 45, e137 CrossRef CAS.
- F. Causa, A. Aliberti, A. M. Cusano, E. Battista and P. A. Netti, J. Am. Chem. Soc., 2015, 137, 1758–1761 CrossRef CAS.
- X. Qu, H. Jin, Y. Liu and Q. Sun, Anal. Chem., 2018, 90, 3482–3489 CrossRef CAS.
- J.-J. Wang, C. Zheng, Y.-Z. Jiang, Z. Zheng, M. Lin, Y. Lin, Z.-L. Zhang, H. Wang and D.-W. Pang, Anal. Chem., 2020, 92, 830–837 CrossRef CAS.
- D. Li, Y. Wang, C. Lau and J. Lu, Anal. Chem., 2014, 86, 10148–10156 CrossRef CAS.
- G. Tao, T. Lai, X. Xu, Y. Ma, X. Wu, X. Pei, F. Liu and N. Li, Anal. Chem., 2020, 92, 3697–3706 CrossRef CAS.
- D. M. Rissin, C. W. Kan, T. G. Campbell, S. C. Howes, D. R. Fournier, L. Song, T. Piech, P. P. Patel, L. Chang, A. J. Rivnak, E. P. Ferrell, J. D. Randall, G. K. Provuncher, D. R. Walt and D. C. Duffy, Nat. Biotechnol., 2010, 28, 595–599 CrossRef CAS.
- D. M. Rissin, D. R. Fournier, T. Piech, C. W. Kan, T. G. Campbell, L. Song, L. Chang, A. J. Rivnak, P. P. Patel, G. K. Provuncher, E. P. Ferrell, S. C. Howes, B. A. Pink, K. A. Minnehan, D. H. Wilson and D. C. Duffy, Anal. Chem., 2011, 83, 2279–2285 CrossRef CAS.
- L. Song, D. W. Hanlon, L. Chang, G. K. Provuncher, C. W. Kan, T. G. Campbell, D. R. Fournier, E. P. Ferrell, A. J. Rivnak, B. A. Pink, K. A. Minnehan, P. P. Patel, D. H. Wilson, M. A. Till, W. A. Faubion and D. C. Duffy, J. Immunol. Methods, 2011, 372, 177–186 CrossRef CAS.
- D. Wu, M. D. Milutinovic and D. R. Walt, Analyst, 2015, 140, 6277–6282 RSC.
- L. Song, D. Shan, M. Zhao, B. A. Pink, K. A. Minnehan, L. York, M. Gardel, S. Sullivan, A. F. Phillips, R. B. Hayman, D. R. Walt and D. C. Duffy, Anal. Chem., 2013, 85, 1932–1939 CrossRef CAS.
- S. Jung, J. Kim, D. J. Lee, E. H. Oh, H. Lim, K. P. Kim, N. Choi, T. S. Kim and S. K. Kim, Sci. Rep., 2016, 6, 22975 CrossRef CAS.
- S. C. Chapin and P. S. Doyle, Anal. Chem., 2011, 83, 7179–7185 CrossRef CAS.
- H. Lee, S. J. Shapiro, S. C. Chapin and P. S. Doyle, Anal. Chem., 2016, 88, 3075–3081 CrossRef CAS.
- M. B. Nagarajan, A. M. Tentori, W. C. Zhang, F. J. Slack and P. S. Doyle, Anal. Chem., 2018, 90, 10279–10285 CrossRef CAS.
- N. Juthani and P. S. Doyle, Analyst, 2020, 145, 5134–5140 RSC.
- J. J. Kim, L. Chen and P. S. Doyle, Lab Chip, 2017, 17, 3120–3128 RSC.
- S. Liu, H. Fang, C. Sun, N. Wang and J. Li, Analyst, 2018, 143, 5137–5144 RSC.
- Y. Xia, B. Gates, Y. Yin and Y. Lu, Adv. Mater., 2000, 12, 693–713 CrossRef CAS.
- F. Bian, J. Wu, H. Wang, L. Sun, C. Shao, Y. Wang, Z. Li, X. Wang and Y. Zhao, Small, 2018, 14, 1803551 CrossRef.
- Y. Xu, H. Wang, C. Luan, F. Fu, B. Chen, H. Liu and Y. Zhao, Adv. Funct. Mater., 2018, 28, 1704458 CrossRef.
- X. Wei, F. Bian, X. Cai, Y. Wang, L. Cai, J. Yang, Y. Zhu and Y. Zhao, Anal. Chem., 2020, 92, 6121–6127 CrossRef CAS.
- R. Bilan, A. Ametzazurra, K. Brazhnik, S. Escorza, D. Fernández, M. Uríbarri, I. Nabiev and A. Sukhanova, Sci. Rep., 2017, 7, 44668 CrossRef.
- N. Wang, L. Song, T. Deng and J. Li, Anal. Chim. Acta, 2020, 1140, 69–77 CrossRef CAS.
- K. Shin, J. Choi, Y. Kim, Y. Lee, J. Kim, S. Lee and H. Chung, J. Chromatogr. A, 2018, 1556, 97–102 CrossRef CAS.
- A. Miyagawa, M. Harada and T. Okada, Anal. Chem., 2018, 90, 13729–13735 CrossRef CAS.
- S. Kim, J.-E. Park, W. Hwang, J. Seo, Y.-K. Lee, J.-H. Hwang and J.-M. Nam, J. Am. Chem. Soc., 2017, 139, 3558–3566 CrossRef CAS.
- H. Lu, K. Guo, Y. Cao, F. Yang, D. Wang, L. Dou, Y. Liu and H. Dong, Anal. Chem., 2020, 92, 1850–1855 CrossRef CAS.
- J. Li, J. Huang, X. Yang, Y. Yang, K. Quan, N. Xie, Y. Wu, C. Ma and K. Wang, Nanotheranostics, 2018, 2, 96–105 CrossRef.
- Q. Lu, D. Ericson, Y. Song, C. Zhu, R. Ye, S. Liu, J. A. Spernyak, D. Du, H. Li, Y. Wu and Y. Lin, ACS Appl. Mater. Interfaces, 2017, 9, 23325–23332 CrossRef CAS.
- Y. Wu, J. Han, P. Xue, R. Xu and Y. Kang, Nanoscale, 2015, 7, 1753–1759 RSC.
- J. Yu, S. He, C. Shao, H. Zhao, J. Li and L. Tian, Nanoscale, 2018, 10, 7067–7076 RSC.
- X. Liao, Q. Wang and H. Ju, Chem. Commun., 2014, 50, 13604–13607 RSC.
- W. Zhou, D. Li, C. Xiong, R. Yuan and Y. Xiang, ACS Appl. Mater. Interfaces, 2016, 8, 13303–13308 CrossRef CAS.
- Z. Zhou, Y. S. Sohn, R. Nechushtai and I. Willner, ACS Nano, 2020, 14, 9021–9031 CrossRef CAS.
- F. Yang, Y. Cheng, Y. Zhang, W. Wei, H. Dong, H. Lu and X. Zhang, Anal. Chem., 2020, 92, 4411–4418 CrossRef CAS.
- H. Lu, K. Guo, Y. Cao, F. Yang, D. Wang, L. Dou, Y. Liu and H. Dong, Anal. Chem., 2020, 92, 1850–1855 CrossRef CAS.
- X. Meng, K. Zhang, W. Dai, Y. Cao, F. Yang, H. Dong and X. Zhang, Chem. Sci., 2018, 9, 7419–7425 RSC.
- S. Wang, N. J. Emery and A. P. Liu, ACS Synth. Biol., 2019, 8, 1079–1088 CrossRef CAS.
- Z. Wang, L. Qi, Y. Yang, M. Lu, K. Xie, X. Zhao, E. H. C. Cheung, Y. Wang, X. Jiang, W. Zhang, L. Huang, X. Wang and P. Shi, Sci. Adv., 2020, 6, eaba4971 CrossRef CAS.
- W. Zhou, Q. Li, H. Liu, J. Yang and D. Liu, ACS Nano, 2017, 11, 3532–3541 CrossRef CAS.
- S. Jung, B. K. Kim, S. Lee, S. Yoon, H.-I. Im and S. K. Kim, Sens. Actuators, B, 2018, 262, 118–124 CrossRef CAS.
- G. Seelig, D. Soloveichik, D. Y. Zhang and E. Winfree, Science, 2006, 314, 1585–1588 CrossRef CAS.
- K. Quan, J. Li, J. Wang, N. Xie, Q. Wei, J. Tang, X. Yang, K. Wang and J. Huang, Chem. Sci., 2019, 10, 1442–1449 RSC.
- X. Ma, X. Chen, Y. Tang, R. Yan and P. Miao, ACS Appl. Mater. Interfaces, 2019, 11, 41157–41164 CrossRef CAS.
- S. Zhang, J. Cheng, W. Shi, K.-B. Li, D.-M. Han and J.-J. Xu, Anal. Chem., 2020, 92, 5952–5959 CrossRef CAS.
- C. Zhang, Y. Zhao, X. Xu, R. Xu, H. Li, X. Teng, Y. Du, Y. Miao, H. C. Lin and D. Han, Nat. Nanotechnol., 2020, 15, 709–715 CrossRef CAS.
- R. Ishihara, K. Hasegawa, K. Hosokawa and M. Maeda, Anal. Sci., 2015, 31, 573–576 CrossRef CAS.
- C. Wang, Q. Ding, P. Plant, M. Basheer, C. Yang, E. Tawedrous, A. Krizova, C. Boulos, M. Farag, Y. Cheng and G. M. Yousef, Clin. Biochem., 2019, 67, 54–59 CrossRef CAS.
| This journal is © The Royal Society of Chemistry 2021 |