
 Open Access Article
 This Open Access Article is licensed under a
 Creative Commons Attribution 3.0 Unported Licence
Characterizing photocatalysts for water splitting: from atoms to bulk and from slow to ultrafast processes
Christine
Kranz
 a and
Maria
Wächtler
*bc
a and
Maria
Wächtler
*bc
aUlm University, Institute of Analytical and Bioanalytical Chemistry, Albert-Einstein-Allee 11, 89081 Ulm, Germany
bLeibniz Institute of Photonic Technology, Department Functional Interfaces, Albert-Einstein-Straße 9, 07745 Jena, Germany. E-mail: maria.waechtler@leibniz-ipht.de
cFriedrich Schiller University Jena, Institute of Physical Chemistry and Abbe Centre of Photonics, Helmholtzweg 4, 07743 Jena, Germany
First published on 9th December 2020
Abstract
Research on light-driven catalysis has gained tremendous importance due to the ever-increasing power consumption and the threatening situation of global warming related to burning fossil fuels. Significant efforts have been dedicated to artificial photosynthesis mimicking nature to split H2O into H2 and O2 by solar energy. Novel semiconductor und molecular photocatalysts focusing on one-step excitation processes via single component photocatalysts or via two-step excitation processes mimicking the Z-scheme of natural photosynthesis are currently developed. Analytical and physicochemical methods, which provide information at different time and length scales, are used to gain fundamental understanding of all processes leading to catalytic activity, i.e., light absorption, charge separation, transfer of charges to the reaction centres and catalytic turnover, but also understanding degradation processes of the photocatalytic active material. Especially, molecular photocatalysts still suffer from limited long-term stability due to the formation of reactive intermediates, which may lead to degradation. Although there is an overwhelming number of research articles and reviews focussing on various materials for photocatalytic water splitting, to date only few reviews have been published providing a comprehensive overview on methods for characterizing such materials. This review will highlight spectroscopic, spectroelectrochemical, and electrochemical approaches in respect to their potential in studying processes in semiconductor and (supra)molecular photocatalysts. Special emphasis will be on spectroscopic methods to investigate light-induced processes in intermediates of sequential electron transfer chains. Further, microscopic characterization methods, which are predominantly used for semiconducting and hybrid photocatalytic materials will be reviewed as surface area, structure, facets, defects, and bulk properties such as crystallinity and crystal size are key parameters for charge separation, transfer processes and suppression of charge recombination. Recent developments in scanning probe microscopy will also be highlighted as such techniques are highly suited for studying photocatalytic active material.
 Christine Kranz | Christine Kranz received her MS and PhD degrees in Chemistry from Ludwig-Maximilian University in Munich (1992) and Technical University of Munich (1996), respectively. After spending a year as postdoctoral fellow at Vienna University of Technology, Austria supported by a research fellowship from the German Science Foundation, she accepted a position at the School of Chemistry and Biochemistry, Georgia Institute of Technology, Atlanta, GA. Currently, she is apl. Professor at the Institute of Analytical and Bioanalytical Chemistry, Ulm University heading the surface science group. Her research interests are focused on scanning electrochemical probe microscopy and miniaturized sensor technology for applications in biomedical research, light-driven photocatalysis and post-lithium battery research. |
 Maria Wächtler | Maria Wächtler studied Chemistry at the Friedrich Schiller University in Jena where she also received her PhD in 2013. After a postdoctoral period at Leibniz Institute of Photonic Technology Jena (Leibniz-IPHT), she was appointed head of work group Ultrafast Spectroscopy in the department Functional Interfaces in 2015 and since 2020 she is head of work group Quantum Confined Nanostructures at Leibniz-IPHT. Her research focuses on the design of systems for light-driven water splitting based on colloidal semiconductor nanostructures and the investigation of function determining interactions and light-driven processes by (time-resolved) spectroscopy. |
1. Introduction
Solar-driven photocatalysis is gaining significant importance due to the globally increasing power consumption, the concerns related to limited reserves of fossil fuels and – most importantly – the threatening situation of global warming due the emission of greenhouse gasses originating from burning such fuels.1,2 Driven by the need to replace carbon-rich fossil fuels with renewable, environment-friendly energy sources, water splitting using solar energy with both representing abundant resources into hydrogen (H2) and oxygen (O2) is highly attractive. Moreover, industrially consumed H2, not only as fuel but also as feedstock, is currently predominantly produced from fossil fuels (coal and natural gas) producing CO2.3 Hence, the production of hydrogen via light-driven splitting of water holds great promise as CO2-neutral supply.Over the last decades, tremendous efforts have been made in homogeneous and heterogenous solar radiation-driven photocatalysis pushed by the need for high-efficiency and technologically useful solar energy conversion systems. The major challenge in realizing systems for photocatalytic water splitting is the complexity of the involved multi-electron processes consuming several charge carriers. To form one molecule of H2 from H2O, two protons have to be reduced consuming two electrons, while for O2 evolution from H2O four electrons are needed. The overall reaction for water splitting occurs with an unfavourable positive free Gibbs energy of ΔG° = 237.13 kJ mol−1 (“uphill reaction”).
Light-driven water splitting can be obtained by a single-component photocatalyst combining both reaction centres for proton reduction and water oxidation. Alternatively, two photocatalysts can be interfaced mimicking natural photosynthesis (Z-scheme) in PSI and PSII.4 The proton reduction catalyst and the water oxidation catalyst – each with their own light absorbing unit – are coupled together using a redox-couple as electron transfer mediator, as first proposed in 1979.5 The advantage of the latter compared to single component catalysts is an increase in the available driving force for oxidation and reduction reactions, as the energy of two photons is used. In single component systems, this energy has to be delivered by a single photon. The fundamental principle of both is schematically shown in Fig. 1.
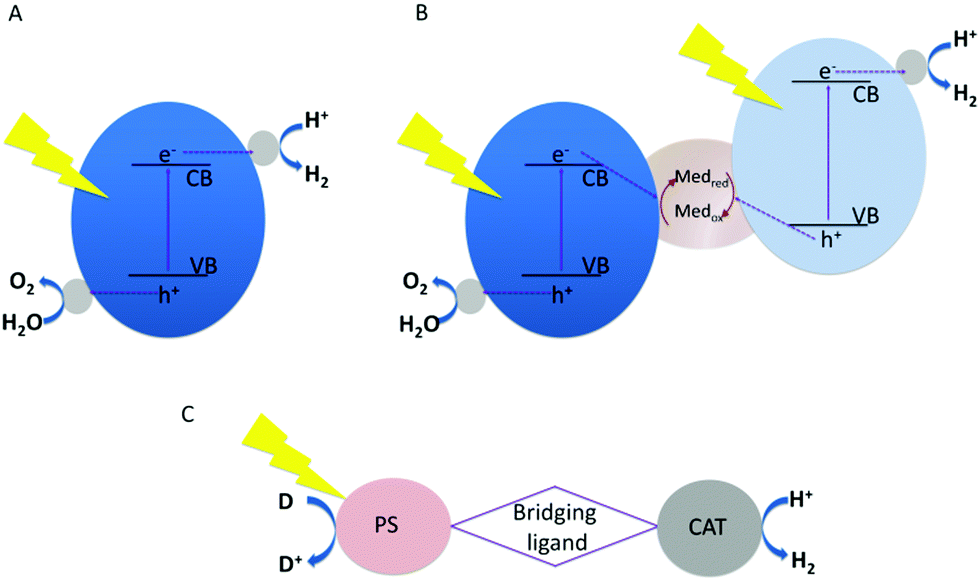 | ||
| Fig. 1 Scheme of light-driven water splitting systems. (A) Single-component photocatalyst; (B) photocatalysts driving each of the half reactions coupled in the Z-scheme. (C) Simplified scheme of a molecular water splitting system for HER with the photosensitizer (PS) coupled via a ligand bridge to the catalyst (CAT), (D) is the sacrificial electron donor. | ||
Single component photocatalysts for water splitting are mostly derived from semiconductor materials. In these systems, electrons from the valence band (VB) are excited into the conduction band (CB) leaving positively charged holes in the valence band. The holes and electrons have to diffuse independently to the surface, which is mostly functionalized with suited reaction centres promoting charge separation, reducing charge recombination and driving the water splitting half reactions for enhancing catalytic turnover. The one step excitation process faces a series of challenges.6 (i) Band gap energies smaller 3 eV for harvesting visible light are required. Many highly active materials for water splitting have a bandgap that matches UV radiation, which only comprises 4% of the solar spectrum. As approx. 43% of the solar spectrum constitutes visible light, materials with narrow bandgaps (ideally between 1.8 and 2.8 eV suitable for adsorbing photons in the range of 400–750 nm)7 are needed for efficient light harvesting systems. (ii) On top of the optimal bandgap, the band edge potentials have to be suitable for water splitting. This implies that the conduction band of the semiconductor has to be more negative than the H+/H2 energy level (0 − 0.059 pH, V vs. normal hydrogen electrode (NHE)) and the valence band has to be more positive than the O2/H2O energy level (1.23 − 0.059 V pH, V vs. NHE). In addition, favourable surface reaction kinetics and well balanced reaction rates for the hydrogen evolution reaction (HER) and the oxygen evolution reaction (OER) are mandatory.8,9 (iii) The material has to show sufficient long-term stability during extended photocatalytic reactions.
Since the first report in 1972 demonstrating photoelectrochemical water splitting under UV irradiation with a n-type TiO2 photoanode and a Pt cathode for H2 evolution,10 a multitude of semiconducting materials containing transition metal cations with d0 and d10 electronic configurations including metal oxides,11 oxynitrides,12,13 oxysulfides7 and sulphides with chalcopyrite-type structures14 have been investigated as materials for photocatalytic hydrogen generation as comprehensively reviewed.9,15 Various co-catalysts for H2-evolution (e.g., Pt, Rh, Ru, Ir, Ni) and co-catalysts for O2 evolution (e.g., Co, Fe, Ni, Mn, Ru, Ir, as well as metal oxides, e.g., RuO2, IrO2) have been studied.8 As a metal-free polymeric semiconductor, graphitic carbon nitride (g-CN) with a bandgap of 2.7 eV has been reported as effective one-step excitation light-driven catalyst when combined with appropriate co-catalysts.16,17 However, to date only few semiconducting single photocatalysts exploiting visible light have been demonstrated for overall water splitting including GaN:ZnO,18 β-Ge3N4 loaded with RuO219 or Y2Ti2O5S2 with IrO2 and Rh/Cr2O3 as co-catalysts,20 which are still limited in stability or provide small quantum yields. Besides bulk semiconductor materials, also colloidal quantum confined nanocrystals, i.e., quantum dots, nanorods or nanoplatelets, have gained a lot of interest as photocatalysts or as light absorbing materials coupled to a co-catalyst, e.g., metal particles, oxides, phosphides,21–28 or molecular reaction centres21,25,29,30 to drive HER or OER. Quantum confinement effects allow tailoring electronic and optical properties of the particles, i.e., band gap and band edge positions via size, shape and composition. With the accurate choice of material, absorption of visible light in combination with proper band edge positions to drive water reduction or oxidation can be reached, e.g., if CdS-based nanostructures are used.31
To overcome the strict boundaries for single component systems, coupling of photocatalysts driving each of the half reactions in a Z-scheme allows for increased flexibility in optimizing the band edge positions and to use visible light to drive the HER and OER. To relay electrons between HER and OER catalysts, redox shuttles such as periodate/iodide, iodine/iodide, FeIII/FeII and Co-complex redox couples as soluble mediators, polyoxometalate and reduced graphene oxide as solid redox mediators have been used. A comprehensive list of redox shuttles can be found in ref. 8. With the Z-scheme approach, the number of photocatalytic materials is significantly extended and visible-light driven water splitting with long absorption edge wavelengths of 660, 600 and 590 nm could be demonstrated.32
The activity in the field of semiconductor based artificial photosynthesis is evident by the large number of publications and excellent reviews, which were published in recent years.3,7–9,15,22,23,26,27,32–40 Devices following the Z-scheme tandem approach that operate spontaneously only by absorbing solar radiation e.g., in the visible range without applying additional bias have been reported reaching solar to hydrogen efficiencies up to 19%.41,42 Despite these promising results, one main challenge remains to find materials with sufficient long-term stability.
Molecular photocatalytically active systems are a valid complementary approach vs. semiconductor-based photocatalysts for photoredox reactions such as water oxidation, proton reduction, and CO2 activation.43,44 In analogy to semiconductor-based systems, they combine a light absorbing unit with a component where the catalytic reaction occurs. This can be realized in an intermolecular approach, mixing sensitizer and catalyst in solution, eventually adding an additional redox shuttle. Alternatively, an intramolecular approach can be introduced, whereby the light absorbing unit and the catalytic centre are combined in one molecule linked by a bridging unit, which not only assures the connection of the two components but may support electron transfer and charge accumulation acting as electron relay. Compared to semiconductor materials, the structure of molecular systems is well defined and readily determined via crystallography and spectroscopic methods. Via modifications in the structure changing electronic properties and/or steric configurations, molecular systems offer high precision in tuning the charge transfer between light absorber and reaction centre and controlling the activity and product selectivity of every single reaction site.43
The most common light absorbing units are based on transition metal complexes with RuII, IrIII, PtII or ReII centres. Noble-metal-free systems have also been explored, e.g., Zn and Al porphyrines or Cu(I) complexes, and organic dyes.45,46 Molecular reaction centres are frequently based on transition metal complex structures, e.g., Ru, Rh, Pt.43 For OER, Ru complexes with low overpotentials and high efficiency have been reported based on the seminal work of Meyer and co-workers in 1982 reporting on water oxidation by the “blue dimer” cis,cis-[RuII(bpy)2(H2O)2(μ-O)].47 This structural motif was further developed into systems with a single Ru centre of the RuII(bda)(L2)-type (bda: 2,20-bipyridine-6,60-dicarboxylate, L: picoline and derivatives).48 Furthermore, water oxidation catalysts with promising activities containing Ir have been developed.49 Inspired by nature, reaction centres based on abundant metals such as Mn, Co, Ni or Fe have also been investigated and summarized in a number of review articles. However, compared to noble-metal-containing species they still lack in activity.50,51 All-inorganic polyoxometalates (POMs) present a promising alternative approach for OER due to oxidative and hydrolytic stability.52 Compared to centres for OER, the variety on available reaction centres for HER is much larger.43 Again, many early approaches rely on transition metal complexes with noble metals, e.g., Pt or Rh.53–56 Over the past decade, the research focus has shifted to systems containing earth abundant metal centres. Copying principles from nature [FeFe] and [FeNi] hydrogenase mimics have been developed.57 Further complexes based on Ni, e.g., “DuBois catalysts”, Co, e.g., cobaloximes, metalloporphyrines containing Fe or Co,58 and Mo complexes59,60 have been reported. Based on the described light absorbers and reaction centres, numerous supramolecular systems for intramolecular catalysis have been designed.43,61,62
In contrast to the variety of reports on active molecular systems, the development of artificial photosynthetic water-splitting devices based on molecular materials suffers mainly from two main challenges: as inevitable step towards device integration, (i) realizing heterogenization of the molecular systems without losing activity and selectivity, and (ii) achieving sufficient long-term stability of the molecular units.43 The most commonly followed strategy for heterogenization is covalently anchoring chromophores and catalysts, intramolecular chromophore catalyst assemblies or in case of low band gap semiconductor materials only catalysts via covalent anchoring to oxide based surfaces, e.g., TiO2, NiO, Fe2O3, WO3 or BiVO4.54 Such hybrid systems are a step towards device integration, and can be used as photocathode or anode in photoelectrochemical cell (PEC) devices. Also, immobilization via covalent binding63–69 and π–π stacking70–72 on carbon materials (e.g., carbon nanotubes, graphene) has been applied. An alternative approach of immobilization and heterogenization of molecular catalytic assemblies is entrapping within a film generated from polymeric materials such as poly(vinyl-co-styrene) derivatives and Nafion.73–75 Using monomers containing functional groups, polymer films with sensitizers and catalysts directly bound to the polymer backbone can be generated.76–78 Recently, the electrostatic immobilization of molybdenum sulphide [Mo3S13]2− as HER catalyst and the photosensitizer [Ru(bpy)3]2+ on the surface of nanoporous block copolymer membranes has been reported.79 An assembly of chromophores and reaction centres in three dimensions can be achieved by incorporation of these functionalities in metal organic frameworks (MOFs).80,81
This short overview on systems for artificial photosynthesis illustrates the tremendous variety of available and investigated material systems. To support the development of optimized systems, it is inevitable to understand the relation between structural aspects and the underlying mechanisms of the light-driven processes, i.e., light absorption, charge separation, charge transfer between absorber and reaction centres, and the catalytic reaction itself. Furthermore, it is of similar importance to analyse and understand processes leading to a loss in activity and degradation over time, thus limiting the long-term performance of the system, to support the development of recipes to suppress degradation processes and strategies to heal materials. To this end, physicochemical and analytical methods for characterisation of structural features and photophysical and electrocatalytical processes are needed.13,82,83
This review will give a comprehensive overview on characterization techniques for HER and OER photocatalysts addressing the challenge of the complex interplay of processes occurring on several length- and timescales. Given the huge number of articles related to solar driven photocatalysis, this review cannot be exhaustive. Hence, the interested reader is directed to additional articles cited throughout the manuscript. Special emphasis in this review will be on in situ respectively operando spectroscopic, spectroelectrochemical, electro-chemical, in situ scanning probe microscopic methods and ex situ electron microscopy to give an overview for this multidisciplinary research field that includes scientists and students from the STEM disciplines.
2. Characterization methods
A wide variety of spectroscopic and microscopic techniques providing structural and mechanistic information can be employed depending on the system under investigation and the required spatial and temporal resolution. Fig. 2 gives a schematic overview on the most commonly used methods classifying the required temporal and spatial resolution for characterization of photocatalytic systems.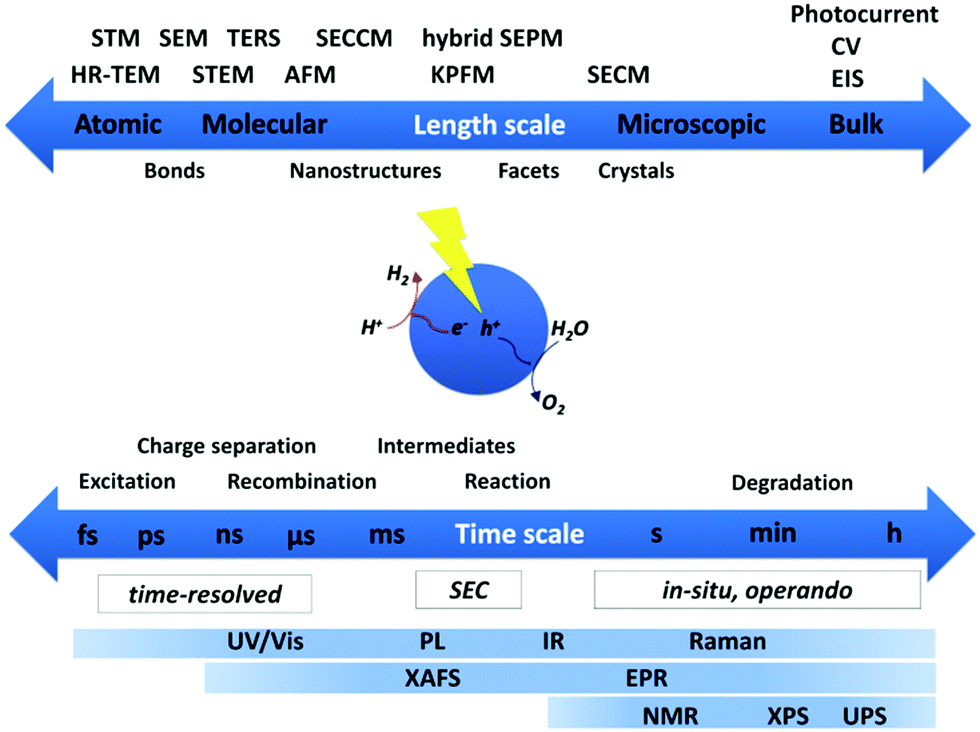 | ||
| Fig. 2 Commonly used methods for characterization of photocatalysts addressing properties on various length scales from bulk down to atomic level and processes spanning time scales from hours to the femtosecond regime contributing to insight in overall light-driven catalytic activity. | ||
For heterogeneous systems, microscopic techniques play an essential role as they provide information on surface structure, surface morphology, crystallinity, crystal size, etc. Changes in structure on an atomistic or molecular scale in both heterogeneous and homogeneous molecular systems is gained by spectroscopy. To date, there is still effort to fully understand degradation pathways and reactivity changes of molecular catalysts, especially when interfaced with heterogeneous supports. Beyond structural aspects, mechanistic aspects of the light-driven processes are clearly the focus of many spectroscopic investigations applying time-resolved techniques. In addition, the characterization of sequential multi-electron transfer processes is frequently limited to the first electron transfer step, while the following processes leading to charge accumulation at the reaction centres are not fully investigated. Further, the identification of reactive intermediates and the determination of gaseous products with high accuracy in situ/operando is still challenging.
2.1 Spectroscopic techniques
Spectroscopic techniques are important for the characterization of photocatalysts to obtain structural information on the systems. In addition, they provide information on light-induced processes and detailed mechanistic insight into the fundamental processes involved in the photocatalytic process, such as light absorption, charge separation, electron transfer and catalytic turnover, further revealing undesired deactivation and degradation pathways. Knowledge about the fundamental activity determining and limiting steps is vital and is a prerequisite to lead to new design principles for high-performance catalysts. A large variety of spectroscopic techniques is available spanning the spectral ranges from X-ray to THz and timescales from fs to s and hours providing insight into structure and structural changes during or after catalysis, mechanisms of vital charge transfer processes, the catalytic reaction and consumption of substrate and formation of products. Each technique provides information only on a certain aspect of the system under investigation. Only the combination of results from various techniques allows to unravel the detailed mechanism step by step. Molecular systems are much better structurally defined compared to semiconductor bulk and nanostructured materials, where intrinsic heterogeneities of the samples with respect to, e.g., structure of reaction sites, composition, and size distributions have to be taken into account.In the following, spectroscopic techniques applied for the characterization of photocatalysts providing information on the chemical composition and structure, band structure and optical properties and time-resolved techniques allowing insight into charge-transfer processes are briefly summarized here. Special emphasis will be paid to in situ/operando techniques applied to HER and OER systems and recent developments in applying spectroelectrochemistry to address light-driven processes in reactive intermediate species of sequential multi-electron transfer chains.
Studying the catalysts in the real environment of the catalytic process interacting with the complex reaction medium containing substrate and eventually sacrificial agents can provide in-depth insights about the nature of the active sites, support identification of key intermediates and reveal complex reaction kinetics. In situ refers here to conditions relevant to catalytic operation, while operando is the characterization of the working catalyst when simultaneously monitoring the catalytic performance. In situ or even operando characterization for HER and OER in photocatalysis settings is far less applied than, e.g., for electrocatalysts, where numerous review articles give an overview on characterization techniques applied, e.g., UV/vis, FT-IR, Raman, XAFS, ambient pressure XPS (AP-XPS), EPR, etc.52,98–107
One challenge of the analysis of photocatalysts under operating conditions is the additional illumination, which needs to be integrated properly into the experimental setups to ensure that the illuminated volume and the probed volume of the sample are overlapping. Another issue is that the illumination may also interfere with some of the applied optical techniques.108 Furthermore, the higher complexity of the reaction mixtures containing photocatalysts, sensitizers, and sacrificial agent increases the challenges of data interpretation if not a method with high selectivity is applied.52 Summarizing, these might be the main reasons why up to now investigations under operando conditions for photocatalytic systems are comparatively scarce. Examples for in situ and operando studies on HER and OER systems are summarized in the following.
The formation of intermediate species under reaction condition can be monitored by UV/vis spectroscopy. For example, in thin film α-Fe2O3 electrodes light-modulated absorbance spectroscopy (LMAS) was used to detect species generated under illumination.109 Results were compared with spectra collected via potential modulated absorption spectroscopy (PMAS), which revealed that under illumination, the same species is formed as under applying positive bias. The species could be identified as signatures of surface trapped holes and related to surface bound iron in a higher valence state, which could not be closer analysed by solely applying UV/vis absorption spectroscopy due to limited structural information of this technique.110Via changing the modulation frequency the lifetime of the intermediate was estimated. More detailed information of the kinetics of intermediates was obtained by photoinduced absorption (PIA) spectroscopy. PIA spectroscopy employs long (several seconds) light pulses to excite the sample and allows to investigate the photogenerated intermediates in dependence on light intensity under quasi steady state working conditions. Durrant and co-workers performed a detailed rate law analysis of water oxidation at a hematite electrode in dependence on trapped hole density.111 The investigation revealed that as soon as a certain threshold of surface hole states has accumulated enabling oxidation of neighbouring Fe atoms, the surface reaction occurs in a fast third order reaction, revealing the multi hole character of the reaction. In another study, the same group investigated water oxidation on bismuth vanadate (BiVO4) with and without cobalt phosphate (CoPi) as co-catalyst.112 PIA spectroscopic studies revealed that the hole transfer from BiVO4 to the CoPi layer are kinetically slow, and hence cannot effectively compete with direct water oxidation at BiVO4. In addition, accumulation of CoIII states was observed, causing an increase in recombination.
Operando FT-IR spectroscopy is a method that is highly suited to detect and identify intermediates in photocatalytically active systems under operation. For OER hematite photoelectrodes, applying FT-IR, an intermediate at the surface of the electrode was identified under photoelectrochemical conditions.110,113 A peak in the spectrum appearing upon irradiation was assigned to a FeIV![[double bond, length as m-dash]](https://www.rsc.org/images/entities/char_e001.gif) O group. Operando FT-IR is also suited to monitor catalytic species in molecular photocatalytic systems, e.g., Fischer et al. reported on intermediate species in an intermolecular system consisting of an Ir based photosensitizer and [Fe3(CO)12] as precursor for the reactive species.114 The authors were able to show that the precursor decomposes in a dark reaction to form the radical anion species [Fe3(CO)12]˙−, [Fe3(CO)11]˙− and [Fe2(CO)8]˙−, which reacted with the photoreduced Ir sensitizer to [HFe3(CO)11]− which was in equilibrium with [HFe(CO)4]−, the resting state of the catalytically active complex (Fig. 3). These results agreed perfectly with additionally performed in situ EPR and Raman spectroscopic results.100 In a combined approach the photoreduction of the Ir sensitizer by a sacrificial donor triethylamine was observed in a mixture of sensitizer and sacrificial agent.115 Information on the product was collected from in situ UV/vis spectra reporting on the changes in the electronic structure of the system, XANES monitoring the oxidation state of the Ir centre and EPR spectroscopy under irradiation. Supported by theory, the results enabled the localization of the spin density within the sensitizer.116
O group. Operando FT-IR is also suited to monitor catalytic species in molecular photocatalytic systems, e.g., Fischer et al. reported on intermediate species in an intermolecular system consisting of an Ir based photosensitizer and [Fe3(CO)12] as precursor for the reactive species.114 The authors were able to show that the precursor decomposes in a dark reaction to form the radical anion species [Fe3(CO)12]˙−, [Fe3(CO)11]˙− and [Fe2(CO)8]˙−, which reacted with the photoreduced Ir sensitizer to [HFe3(CO)11]− which was in equilibrium with [HFe(CO)4]−, the resting state of the catalytically active complex (Fig. 3). These results agreed perfectly with additionally performed in situ EPR and Raman spectroscopic results.100 In a combined approach the photoreduction of the Ir sensitizer by a sacrificial donor triethylamine was observed in a mixture of sensitizer and sacrificial agent.115 Information on the product was collected from in situ UV/vis spectra reporting on the changes in the electronic structure of the system, XANES monitoring the oxidation state of the Ir centre and EPR spectroscopy under irradiation. Supported by theory, the results enabled the localization of the spin density within the sensitizer.116
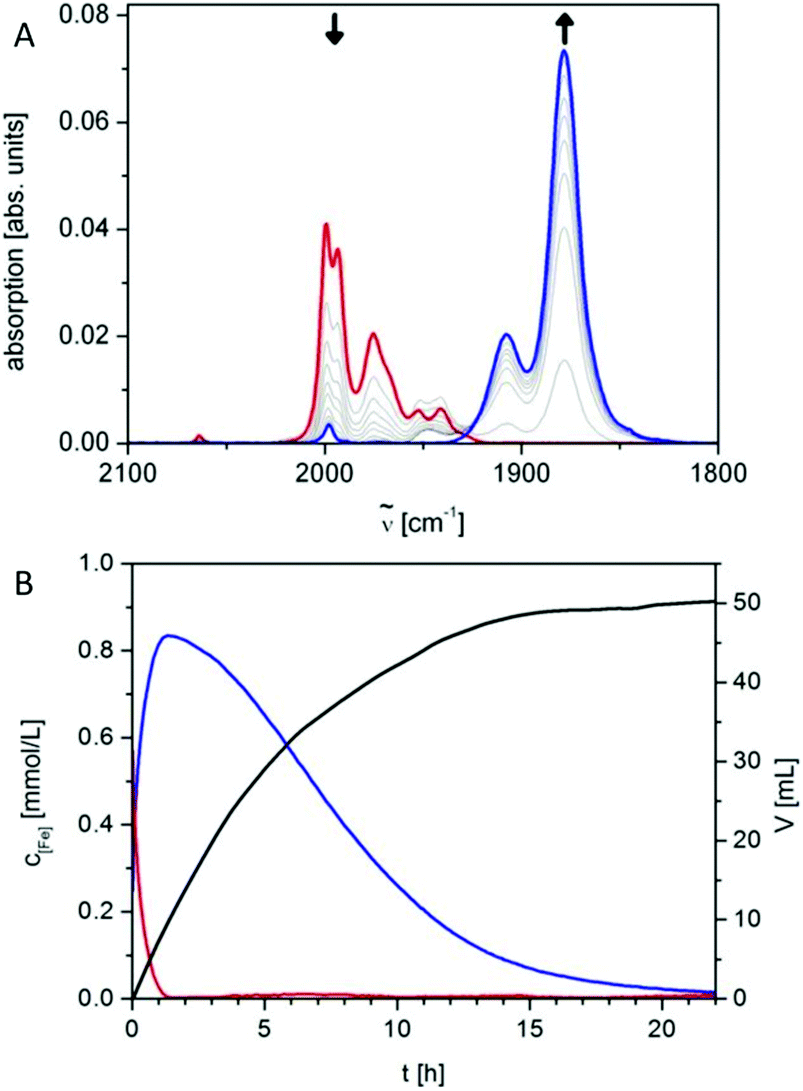 | ||
Fig. 3 (A) Conversion of [HFe3(CO)11]− (red) into [HFe(CO)4]− (blue) as tracked by operando continuous-flow FT-IR during the first 1.5 h of irradiation of 10.0 μmol Ir sensitizer and 6.1 μmol of [Fe3(CO)12] in 20 mL THF/TEA/H2O (4![[thin space (1/6-em)]](https://www.rsc.org/images/entities/char_2009.gif) :1:1) with visible light (1.5 W) at 25 °C, time interval between spectra is 8 min. (B) Concentration curves (c × (number of Fe per molecule)) of iron species [HFe3(CO)11]− (red) and [HFe(CO)4]− (blue) as well as hydrogen evolution curve (black). Reproduced from ref. 114 with permission from John Wiley and Sons. :1:1) with visible light (1.5 W) at 25 °C, time interval between spectra is 8 min. (B) Concentration curves (c × (number of Fe per molecule)) of iron species [HFe3(CO)11]− (red) and [HFe(CO)4]− (blue) as well as hydrogen evolution curve (black). Reproduced from ref. 114 with permission from John Wiley and Sons. | ||
EPR spectroscopy was also used for monitoring selectively species with unpaired electrons in situ under irradiation of the photoreduction of ansa-titanocene triflate complexes that can serve as model complexes in a fully closed catalytic cycle of light-driven overall water splitting.117In situ EPR spectroscopy under irradiation is further reported to reveal charge generation and transfer to acceptors in composite materials based on carbon nitride loaded with Pt particles or Ni-based catalysts for photocatalytic hydrogen generation (Fig. 4A).118,119 In the latter system besides monitoring trapped electrons in the carbon nitride, the reduction of NiII deposited on the carbon nitride to Ni0 in presence of an electron donor was followed by in situ EPR spectroscopy (Fig. 4B).
 | ||
| Fig. 4 (A) Schematic representation of the charge separation in sol–gel prepared graphitic carbon nitride (sg-CN) and the formation of superparamagnetic Ni0 nanoparticles during photocatalytic hydrogen evolution under visible light irradiation. (B) In situ EPR study of a suspension of a sg-CN based catalyst in TEOA solution under continuous irradiation with visible light (>420 nm) with variation in time reveals the reduction of Ni2+ by monitoring the Ni0 EPR signal. Reproduced from ref. 118 with permission from The Royal Society of Chemistry. | ||
Not only EPR, but also NMR can be used to study photocatalytic processes under illumination, e.g., to follow proton transfer in heterogeneous photocatalytic reactions.120
From in situ experiments not only intermediates can be identified, also kinetic information can be derived. Time-resolved rapid-scan FT-IR spectroscopy of aqueous suspensions of Co3O4 crystalline nanoparticles as catalysts for water oxidation sensitized by Ru(bpy)32+ was performed in attenuated total reflection configuration (ATR) to reveal the kinetics of elementary steps of the catalytic cycle under reaction conditions and pulsed illumination. The kinetic behaviour of intermediates formed upon irradiation were monitored and revealed the reactivity of the respective intermediate on a millisecond to second time scale.121,122 Hammarström et al. used flash photolysis combined with UV/vis and IR detection to structurally characterize the intermediates formed by photoinduced one electron reduction of [FeFe] hydrogenase mimics and the kinetics of intermediate hydride formation in the presence of acids.123–125 The challenge in these experiments is to reach concentrations of the short-lived intermediates high enough for spectroscopic detection. The single reduced species could be achieved via the laser-flash quench method, a second reduction step was not possible via this strategy. To be able to investigate the structure of the doubly reduced hydride, the authors generated the doubly reduced [FeFe] mimic by chemical reduction with cobaltocene in the presence of an acid. In a stopped-flow rapid mixing approach a temporal resolution of 50 ms could be obtained; this allowed even to investigate the subsequent protonation of the hydride species and the catalytic turnover reaction by step scan FTIR spectroscopy. The protonation of the hydride was identified to be the rate limiting step, enabling to calculate directly the turnover frequency (TOF) of the catalyst.124
Also X-ray based methods have been applied in combination with pulsed irradiation to trigger photoinduced electron transfer steps and to structurally characterize the formed intermediates. Li et al. applied XANES and EXAFS to investigate changes in the oxidation state and the coordination environment of a Co catalyst in a [Ru(bpy)3]2+ sensitized system in the presence of ascorbate as electron donor applying pulsed irradation.126 It was observed that a Co(I) species is formed on the microsecond time scale and the theory supported analysis of the spectra revealed a penta-coordinated Co centre in this species, which is favourable for proton access. A similar approach was followed to determine the solution structure of the CoI intermediate of cobaloxime in a photocatalytic system.127 Also, for photoelectrodes X-ray absorptions has been applied in an in situ approach to probe oxidation states. In a mesoporous α-Fe2O3 thin film coated with manganese oxide (Mn3O4δ+) as co-catalysts for water oxidation, the valence state of Mn in the Mn3O4δ+ co-catalyst under irradiation as a function of applied potential was determined and correlated with observed photocurrents.128
For the special case of heterogeneous materials, additional methods are needed with sufficient spatial resolution to address the inhomogeneity of the material and interface effects. To this end by combining (time-resolved) spectroscopic techniques with imaging tools, powerful methods are developed to probe catalytic processes occurring in the time domain from femtoseconds to milliseconds and the space domain from 0.1 nm to 10 mm reviewed recently by Gao et al.147 For example, PL and transient absorption microscopy have been reported to deliver spatially resolved information allowing to study dynamics at charge separating interfaces or charge migration.
Most time-resolved spectroscopic characterizations are performed in inert solvents, i.e., in absence of sacrificial agents or substrate. The presence of substrate and sacrificial agents for homogeneous catalysis, and at biased photoelectrodes for heterogeneous catalysis can severely impact the observed dynamics. Durrant and coworkers studied the dynamics of photogenerated holes in hematite film photoelectrodes in dependence on applied potential and presence of additional hole scavengers.148 Under positive bias, an increased yield of holes was observed with a lifetime in the seconds time range, which was significantly decreased in the presence of methanol as additional hole scavenger. From the decay of the signal of the photoholes a rate in the s−1 range for the water oxidation was determined.130 Similar rates have been determined for mesoporous WO3 films under oxygen evolution conditions in the presence of electron scavenger.149 Hence, the presence of photogenerated holes with lifetimes in the range of ms to s is a prerequisite for oxygen evolution to occur in such systems. For BiVO4-based photoanodes investigated by TA spectroscopy in photoelectrochemical cells under water splitting conditions, competition between water oxidation reaction and back hole/electron recombination on the ms to s timescale was observed. The yield of oxygen generation calculated from the bias dependent ratio of both processes was reported in good agreement with the measured photocurrent density.150 In contrast, processes on shorter timescale (relaxation and charge carrier trapping) have been reported to be independent on external bias.151
As detailed in the introduction, both HER and OER are reactions consuming more than one electron and more than one charge carrier needs to be available at the catalytic reaction centre. For solid state electrodes, sufficient hole or electrons need to accumulate at the surface. For molecular systems the situation can be more complex and for molecular systems, the prerequisite for accumulation of several charges at the reaction centre presents a particular challenge for mechanistic investigations. Here, several consecutive photon-absorption-charge transfer sequences have to occur until a sufficient amount of charges has accumulated at the reaction centre.152 This consecutive multi-step character of light-induced charge transfer events involved in the catalytic cycles presents a major challenge in understanding the correlations between structure, dynamics and function, especially in molecular systems. For the investigation of charge-transfer events in molecular systems, only the electron transfer induced by the absorption of the first photon is investigated in experiments performed in inert solvents in absence of any sacrificial agents or substrate. Especially, the sacrificial agent is actively interfering with the photoinduced reaction cascade, as illustrated in Fig. 5 for the exemplarily case of a supramolecular photocatalyst. In this case, electron transfer to the reaction centre is followed by reduction of the oxidized sensitizer by the sacrificial agent, preventing recombination and restoring the light absorbing centre and preparing the system for the next absorption and electron transfer step. Nevertheless, these experiments lead to valuable information on the relation between structure, dynamics and catalytic activities, although these investigations only allow insight into one aspect in the light-driven reaction mechanism.133–135 Also, it should be noted that the electron transfer steps further down in the electron transfer cascade might follow different relations. Due to charge accumulation, the redox state of the acceptors (reaction centres) changes, which can lead to changes in electronic coupling between sensitizer and reaction centre and alter driving forces for photoinduced electron transfer. Further, additional electronic states might contribute to light absorption leading to new relaxation or degradation pathways compared to the original species.152–156 Furthermore, the interaction with the sacrificial agent can significantly alter the electron transfer process as is observed under inert conditions. Depending on the order of events, electron transfer before rereduction of the sensitizer (oxidative quenching) or first reduction of the photoexcited sensitizer followed by electron transfer (reductive quenching) can occur, and hence the mechanism might be completely different from what is observed in inert solvent environment.157,158 Finally, also interactions with the substrate can impact the electronic properties of the acceptor. This illustrates the need for the development of strategies to address also the second (third, fourth) transfer steps in time-resolved spectroscopic studies and to investigate photoinduced dynamics under conditions which at least model the catalytic reaction conditions (in situ) or even during operation (operando).
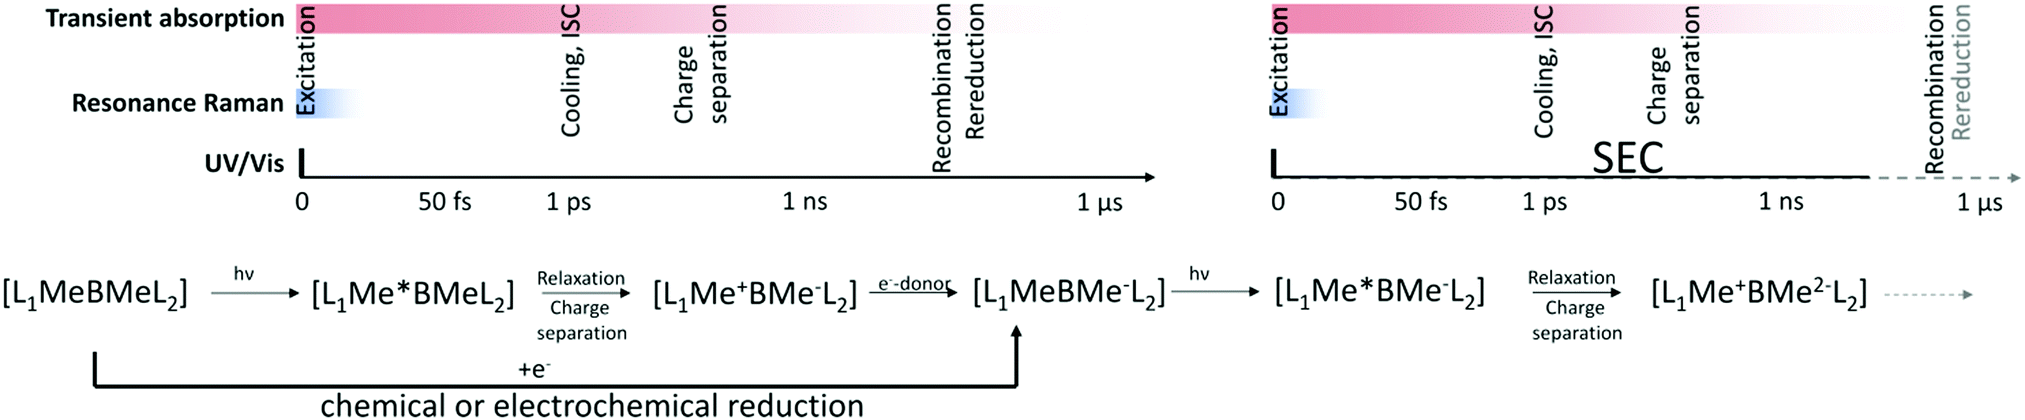 | ||
| Fig. 5 Illustrates schematically a possible sequence of elementary steps for the sequential photoinduced transfer of two charges to the reaction centre of a hydrogen evolving system involving oxidative quenching of the sensitizer and subsequent rereduction of the sensitizer by a sacrificial agent. The equivalence of production of intermediates by photoinduced reduction with sacrificial electron donor and the electrochemical/chemical reduction of the catalyst and the timescales addressed by various techniques, including the SEC approaches, are illustrated. | ||
In the following, most recent investigations applying spectroelectrochemical techniques for the mechanistic investigation of the light-driven steps in relevant intermediates of molecular systems for HER will be introduced. It will be discussed how UV/vis and resonance Raman spectroscopy can be applied to characterize the initial excitation in supramolecular systems and to identify side reactions originating from intermediates. Further, the recent achievements on applying TA spectroscopy to investigate ultrafast charge-transfer processes in partially reduced intermediates will be described.
As discussed above, in the context of the mechanistic investigation of the multi-electron transfer cascades involved in HER or OER, the identification and spectroscopic characterization of intermediates plays a critical role. The challenge is to access such short-lived intermediates in the transfer cascades to be able to characterize the optical and electronic properties, the excited states and the processes subsequent to excitation spectroscopically.
In general, for molecular systems the processes leading to charge accumulation at the reaction centre are discussed as a sequence of subsequent photoinduced charge transfer and regeneration of the sensitizer by a sacrificial agent as is exemplarily shown in Fig. 5 for a pathway involving oxidative quenching of the photosensitizer by intramolecular electron transfer to an acceptor and subsequent regeneration of the sensitizer. This example illustrates that photochemical reduction or oxidation under certain conditions can lead to similar products as a chemical or electrochemical reduction or oxidation. Hence, the individual steps in the photoinduced charge accumulation can be simulated by chemical or electrochemical generation of the intermediates. This way at least models for the intermediates in the electron transfer cascades can be generated. Oxidation and reduction can be induced chemically, which requires the availability of suitable reductants or oxidants to access the targeted oxidation state of the system. Concluding, the redox potential of a chemical agent has to be balanced precisely matching the potentials of the system under investigation. Furthermore, chemical agents might involve coloured species, which can interfere with the spectroscopic investigation. Electrochemical reduction/oxidation can overcome these disadvantages, the potentials can be precisely controlled, and no coloured side products interfere with the characterization. With the ability of producing key intermediates of the sequential multi-electron transfer cascades in a controlled manner, in situ investigation in analogy to investigations of the excited-state properties and first electron transfer processes in the native species becomes possible. In the following, electrochemical approaches combined with spectroscopic techniques will be discussed to collect information on excited state properties of key intermediates and to follow electron transfer processes further down the electron transfer chain in the electron transfer cascades in molecular photocatalytically active systems applying, e.g., UV/vis, resonance-Raman, and time-resolved transient-absorption spectroscopy.
UV/vis and resonance Raman spectroelectrochemistry. UV/vis and rR-SEC are applied for the characterization of the absorption properties and of the contributing initially excited states in intermediates of multi-electron transfer processes. This is not only interesting in the context of photocatalysis but also for systems applicable in dye sensitized solar cells.166,167
Oxidation or reduction generates a molecular system with different electronic configurations and geometry compared to the native structure. Probably the most obvious consequence is a change in colour of the sample upon reduction or oxidation, hence changes in the absorption spectrum.141,144 This is widely used to assign spectral signatures of formation photooxidation and -reduction reactions168 and of charge separated states in transient absorption spectroscopy.169–172 UV/vis-SEC delivers the absorption spectra of the oxidized/reduced donor/acceptor and allows to model the transient spectra to be observed if charge separation occurs and even can be used to quantify charge separation in donor acceptor systems.173
Applying rR analysis in combination with TD-DFT calculations allows to identify the structural subunit, which is reduced or oxidized and to reveal structural changes upon reduction or oxidation via shifts in the vibrational frequencies.104 The advantage of applying rR instead of normal Raman or FT-IR spectroscopy is that by choosing a laser wavelength in resonance with an electronic transition, the Raman intensity is enhanced by a magnitude of 106. This allows to detect solutes selectively even at low concentrations, because solvent signals are much weaker under these conditions. In general, only the signal intensity of vibrational frequencies coupled to the electronic transition are enhanced. This not only ensures selectivity in a mixture of molecules, but further allows to identify the character of the electronic transitions (metal-to-ligand charge transfer (MLCT), ππ*, etc.) and the structural subunits which are involved in the excitation process, especially of interest in large molecular systems or heteroleptic transition metal complexes.174 An experimental setup for rR SEC is depicted in Fig. 7.167
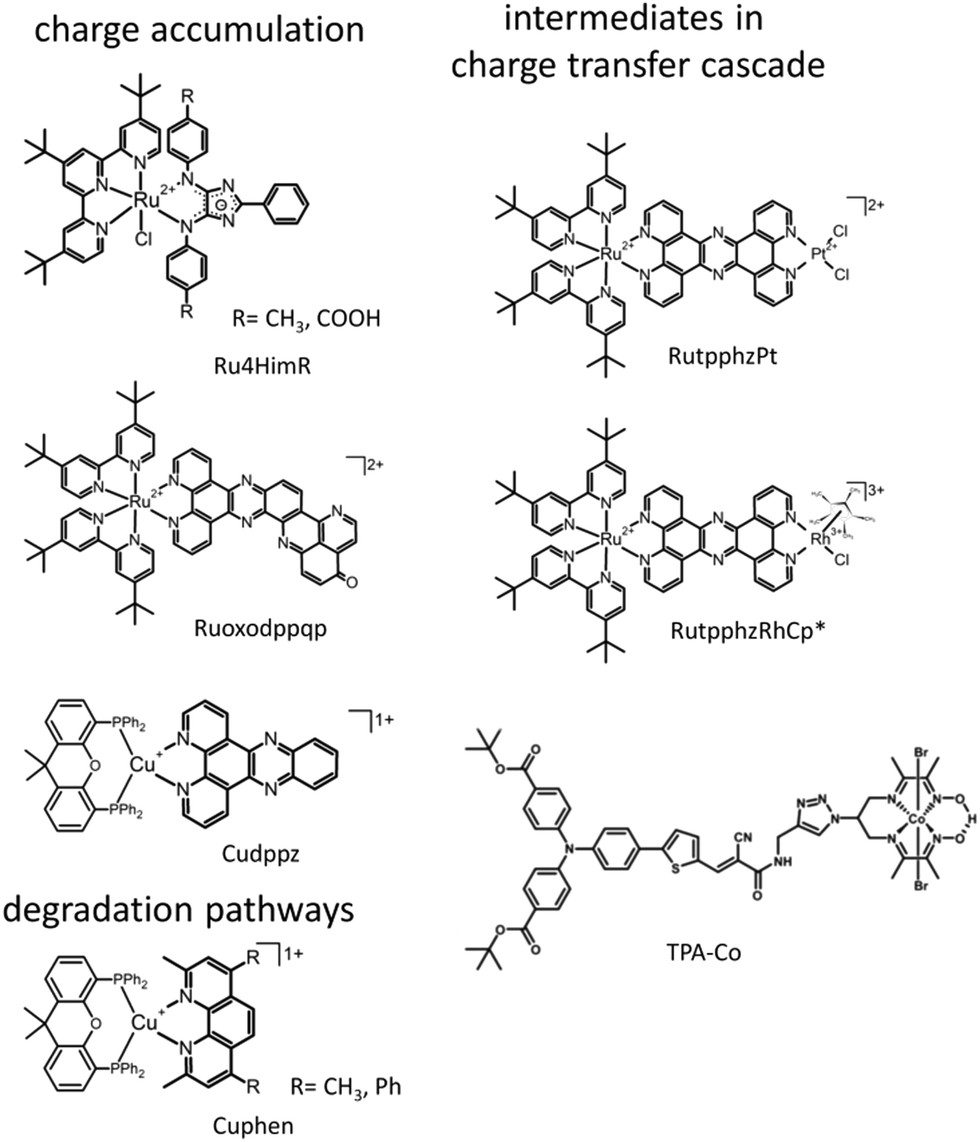 | ||
| Fig. 6 Overview on structures of molecular photosensitizers and intramolecular photocatalysts, which were investigated applying SEC approaches to characterize the photophysical properties of intermediates in charge accumulation processes and charge transfer cascades and degradation pathways induced by photochemical oxidation or reduction. | ||
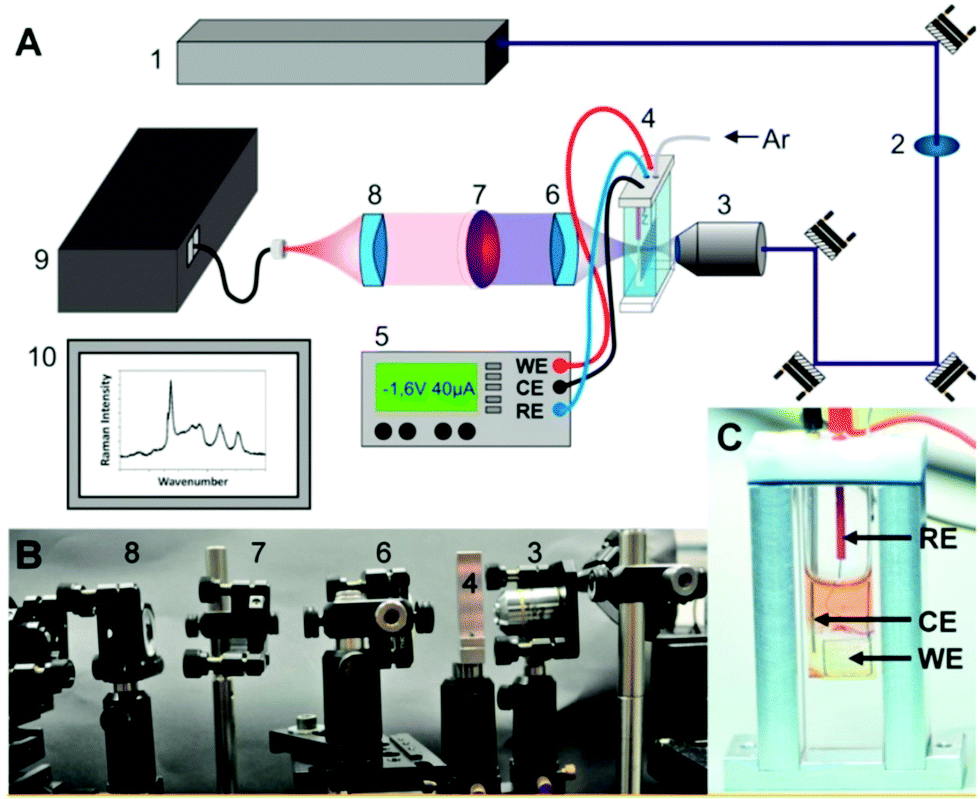 | ||
| Fig. 7 (A) Scheme and (B) photograph of a setup for resonance-Raman SEC experiments as reported in Zedler et al.:167 Argon ion laser (1), laser line bandpass filter (2), a microscope objective (3), the thin-layer electrochemical cell (4), a potentiostat (5), UV/vis achromatic optics (6, 8), longpass filter (7), spectrometer (9), and detection system (10). (C) Thin-layer SEC-cell within the custom-made holder, reference electrode (RE): Ag/AgCl reference electrode, counter electrode (CE): platinum CE, working electrode: platinum WE. The figure is reproduced from ref. 167 with permission from MDPI. | ||
A very intensely studied model system for intramolecular photoctalytic hydrogen generation of the types [(tbbpy)2M1(tpphz)M2]2+ (M1 = Ru, Os; M2 = PdCl2 RutpphzPd, PtCl2 RutpphzPt, PtI2, RhCp*Cl RutpphzRhCp*; tbbpy = 4,4′-di-tert-butyl-2,2′-bipyridine; tpphz = tetrapyrido[3,2-a:2′,3′c:3′′,2′′,-h:2′′′,3′′′-j]phenazine; Cp* = pentamethylcyclopentadienyl)175–179 together with the model compounds [(tbbpy)2Ru(tpphz)]2+, and [(tbbpy)2Ru(dppz)]2+ (dppz = dipyridophenazine) have been subject of intense spectroscopic investigations to understand the function underlying charge-transfer processes.153,174,180–184 One of the first questions, which was addressed is the character of the initial excitations and the direction of the connected initial charge transfer. The rR spectroscopic characterization of the non-reduced form revealed for RutpphzPd a correlation between the localization of the initial MLCT and the catalytic efficiency for hydrogen generation.182 Upon excitation in the red wing of the absorption band in the visible range, a MLCT directing charge density towards the bridging ligand is observed, while at shorter excitation wavelengths MLCT transitions involving the peripheral tbbpy ligands dominate shifting initially charge density away from the bridge and hence the reaction centre (Fig. 8). This initial shift in charge density impacts the outcome of catalytic turnover, which is higher upon excitation with longer wavelengths. This result is also valid for species with other reaction centres, e.g., RutpphzPt,185 and can be explained by ultrafast initial relaxation processes, which lead to a more efficient population of the bridge states in this case than upon initial shift of charge density to the periphery ligands.184
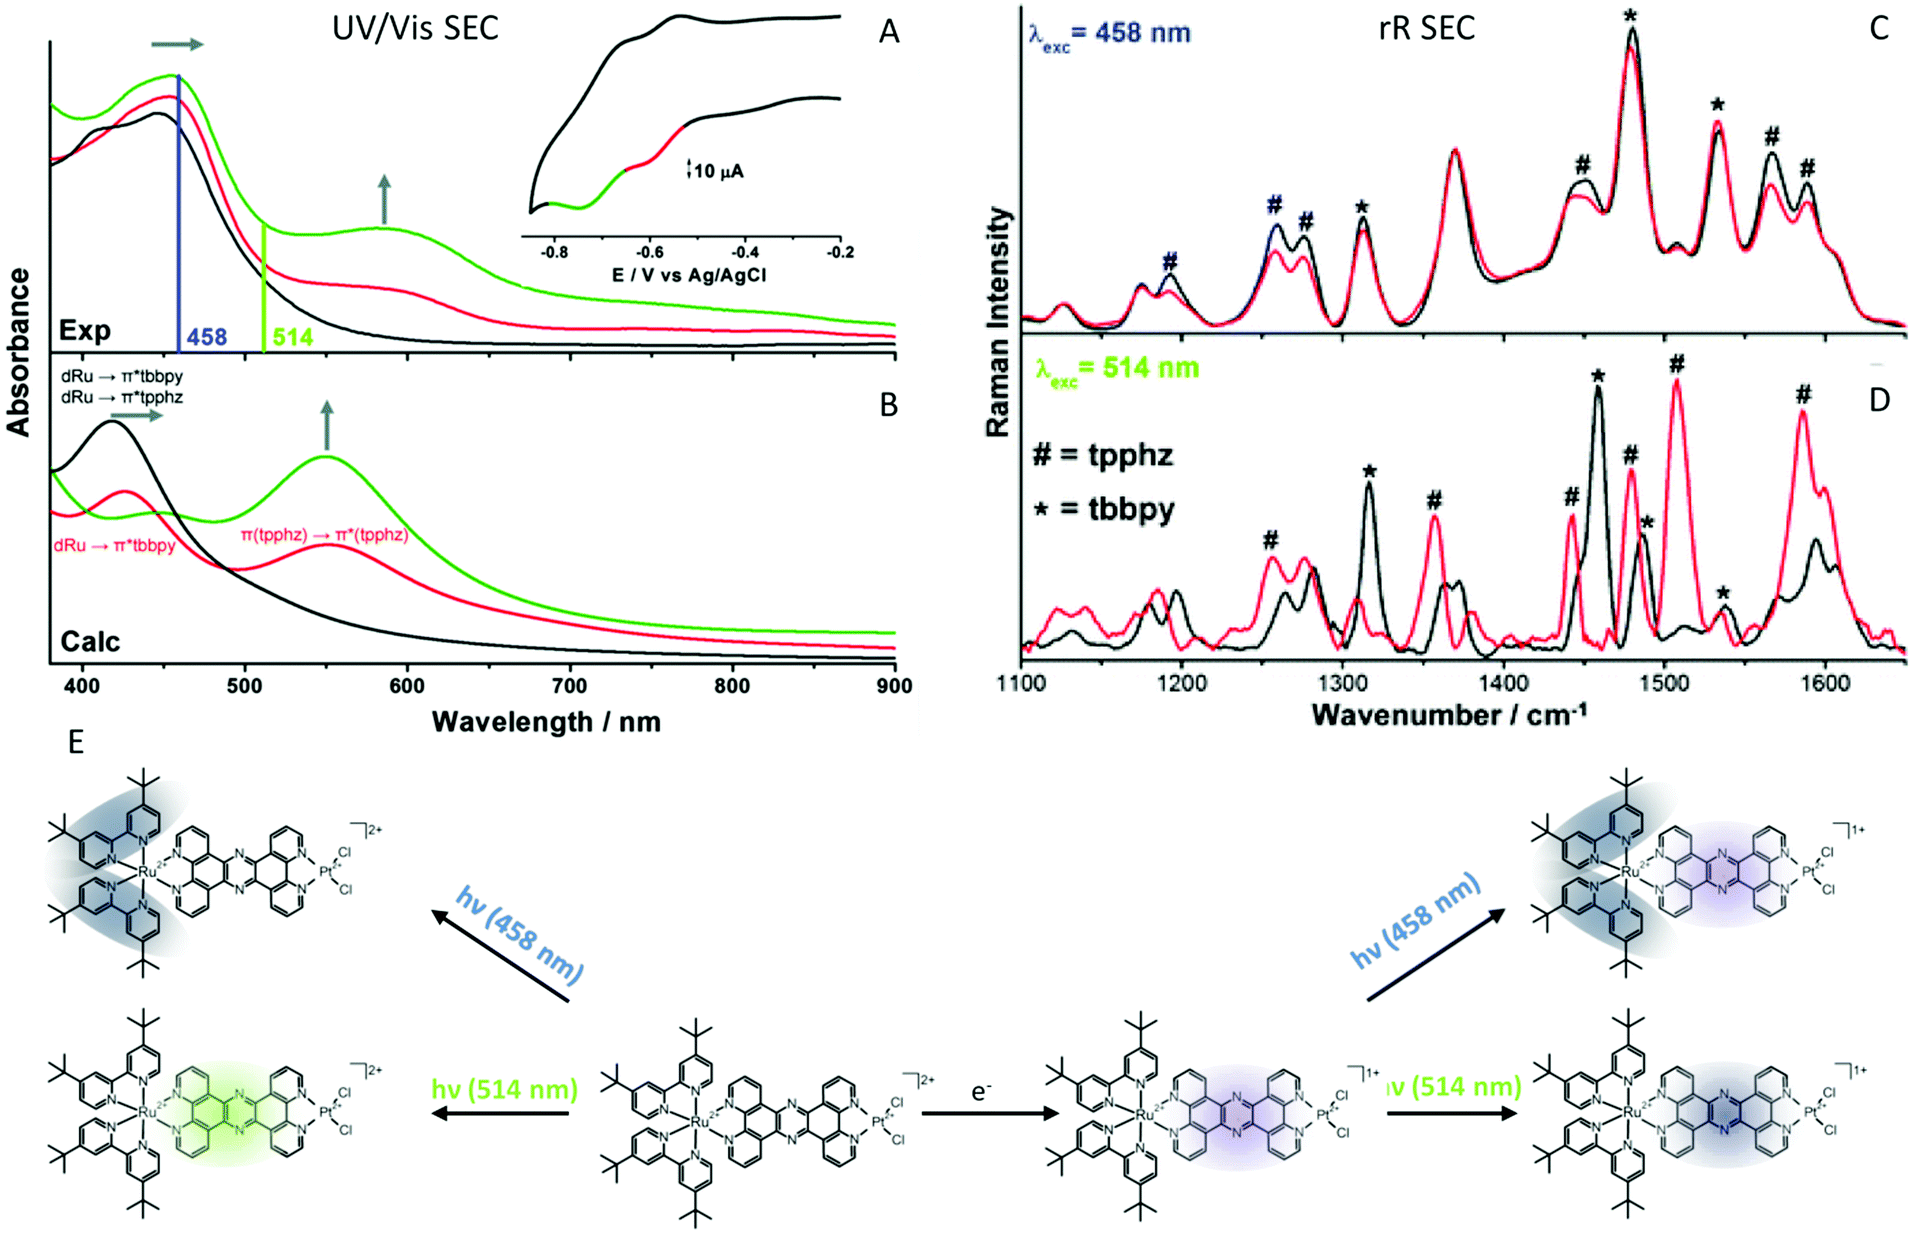 | ||
| Fig. 8 (A) UV/vis-SEC detection of intermediate reduction states of RutpphzPt, rR excitation wavelengths are displayed as vertical lines. (B) Calculated spectra of RutpphzPt (black: non-reduced, red: single reduced, green: double reduced (singlet character)). Inset: CV of RutpphzPt in acetonitrile containing 0.1 M TBABF4 electrolyte, recorded in the SEC cell. The voltage range for acquisition of the rR spectrum is coloured (scan rate 5 mV s−1, Pt-gauze working, Pt-counter, and Ag/AgCl-pseudo-reference electrodes). Experimental rR spectra of non-reduced (black) and electrochemically single reduced (red) RutpphzPt, excited at 458 nm (C) and 514 nm (D). (E) Schematic representation of the shift of electron density upon excitation upon excitation in the native and the single reduced RutpphzPt complex. In the native system excitation at 458 nm leads to an MLCT mainly shifting excess electron density towards the peripheral tbbpy ligands while excitation at 514 nm involves a MLCT transition shifting excess electron density towards the bridging ligand. Electrochemical reduction (violet shade) and subsequent excitation of the single reduced RutpphzPt complex at 458 nm leads to a MLCT involving the tbbpy ligands (shift of excess electron density blue shades), whereas upon 514 nm excitation of a tpphz-centre ππ* transition occurs (localization of the excitation dark blue shade). The material in the figure is reproduced from ref. 185 with permission from The Royal Society of Chemistry. | ||
Although delivering an explanation for the observed wavelength dependent photocatalytic performance, it remained from this early investigation unclear whether this is also valid for a second electron transfer event. To address this question, the singly reduced potential intermediate of the electron transfer cascade for RutpphzPt was generated electrochemically (Fig. 8).185 UV/vis-SEC reveals that electrochemical reduction results in a slight red-shift of the MLCT absorption band and a new band arises with a maximum at 600 nm (Fig. 8A and B). rR spectra of the single reduced form recorded upon excitation in the MLCT transition at 458 nm reveal that in general the contribution of the MLCT involving the tpphz ligand decreases in the reduced species (Fig. 8C). Upon excitation at 514 nm, the rR spectrum of the reduced form is significantly changed compared to the non-reduced species (Fig. 8D). This means MLCT transitions show a significantly decreased contribution to the absorption and mainly absorption populating a bridging ligand localized state of ππ* character occurs. In consequence, light absorption at longer wavelengths in the reduced species does not contribute to any charge transfer across the bridge anymore. The question is how this is associated with the photocatalytic activity of the system? The explanation illustrates one of the largest pit falls involved in the electrochemical way of generating intermediates of the electron transfer chain. The singly reduced species generated electrochemically for RutpphzPt might not be the relevant intermediate in the photochemical process which hints to the fact that the order of transfer and rereduction events might impact the species formed. The authors raise the hypothesis, that if the Ru centre is in the RuIII state, electron transfer from the bridge localized state to the reaction centre occurs within ns time range, as observed in TA experiments.177,178,183 If RuII is present the electron is localized at the bridging ligand. This is the case during electrochemical generation of the single reduced species, but also can play a role in photocatalysis in the presence of high concentrations of sacrificial agents, accelerating the rereduction of the RuIII centre to compete with electron transfer to the reaction centre. This might decrease the catalytic activity. An alternative explanation could be the absence of substrate, which could stabilize the state with the excess electron localized at the reaction centre via interactions.
In respect to light-driven multi-electron reactions, especially relevant is the question how to transfer several electrons towards the reaction centre. In this respect, the bridging ligands in supramolecular photocatalysis have more than a simple connecting function between the sensitizer and the reaction centre. The bridging unit can be actively involved in mediating the electron transfer and can also serve as electron relay via accumulation of multiple charges.46,62 This requires a careful ligand design and systems capable of storing several electrons in a molecular subunit. Especially, ligands with an extended π system, known to be redox active itself are of highest interest for such applications.186 To reveal the electron storage capabilities of certain ligands in transition metal complexes, rR-SEC can make a valuable contribution. E.g., a group of Ru sensitizers bearing a 4H-imidazole-type ligand (Ru4HimR) was investigated using rR-SEC to localize the additional charges introduced in the system upon reduction and to determine the direction of photoinduced electron transfer in native and successively reduced systems (Fig. 6).187 4H-imidazole ligands with either electron donating or withdrawing substituents were investigated. The results show that in the case of electron withdrawing substitution, the ligand is capable of accepting several electrons, i.e., successive reduction of the system is localized on the 4H-imidazole ligand and in the single reduced species, MLCT transition in the visible range transfers electron density towards the 4H-imidazole ligand. The vibrational signals detected reveal that accumulation of multiple charges on the 4H-imidazole ligand is supported by ligand planarization increasing charge delocalisation. This investigation allows to derive clear design principles for ligands suited for multi-electron storage. Lefebvre et al. report a similar investigation on an extended dppz type system (Ruoxodppqp, Fig. 6), where rR-SEC studies enabled to follow the stepwise two electron reduction of the extended dppz ligand and additionally allowed to localize the reduction on certain parts within the dppz ligand.186
Another important aspect impacting the overall efficiency of catalysis is the long-term stability and the identification of possible degradation pathways. For CuI sensitizers of the type [(P^P)CuI(N^N)]+, composed of a diimine N^N and bulky diphosphine P^P ligand (Cuphen, Fig. 6), the oxidative quenching process was simulated by oxidation of the CuI complex electrochemically and investigating the oxidized species by UV/vis and rR spectroscopy. Besides, a cyclic voltammogram (CV) revealing slow electron transfer behaviour (“irreversibility”), the UV/vis spectra did not recover completely upon cycling. The rR spectroscopy data showed that induced by oxidation, a homoleptic complex [CuI(N^N)2]+ as side product was formed, which showed only low activity as senistizer.188
Spectroelectrochemical transient-absorption spectroscopy. Spectroelectrochemical transient-absorption spectroscopy (SEC-TA) offers the possibility to investigate excited state dynamics and photoinduced electron transfer in intermediates of the catalytic cycles on femto-to-nanosecond timescales. For that purpose, chronoamperometry to produce the intermediates is integrated into a setup for fs or ns-time resolved transient absorption.
Applying this method, Bold et al. investigated a covalent dye catalyst assembly containing a push–pull organic dye as light harvesting unit linked to a cobalt diimine dioxime catalyst (TPA-Co, Fig. 6).189 In these structures, the cobalt centre is originally in the CoIII state, which presents kind of a “pre”-catalyst and needs to be activated by two successive light-driven reduction steps to form the catalytically active CoI species. Classical transient absorption measurements used to investigate excited state processes only allow to probe the first of these two steps, i.e., reduction from CoIII to CoII, without addressing the formation of the CoI species actually involved in the proton reduction process. To overcome this limitation, the authors report on a setup combining electrochemical generation of a specific redox state at the Co centre with time-resolved spectroscopic investigation of the processes occurring in the respective species after excitation. The measurements were performed in a 1 mm cell with a three-electrode arrangement (Fig. 9) to perform pump–probe experiments in transmission. The authors were able to investigate the photoinduced dynamics in the dyad with the cobalt centre in three different oxidation states: the native CoIII, CoII and the active CoI. In case of an oxidative quenching process for the activation of the catalyst, i.e., first electron transfer to the catalyst followed by rereduction of the push–pull dye, it was expected that with changing oxidation state of the Co centre, different rates and characteristic signatures of the CoII and CoI species (known from UV/vis spectroelectrochemical experiments) should be observable in the transient spectra. Neither of both could be observed.
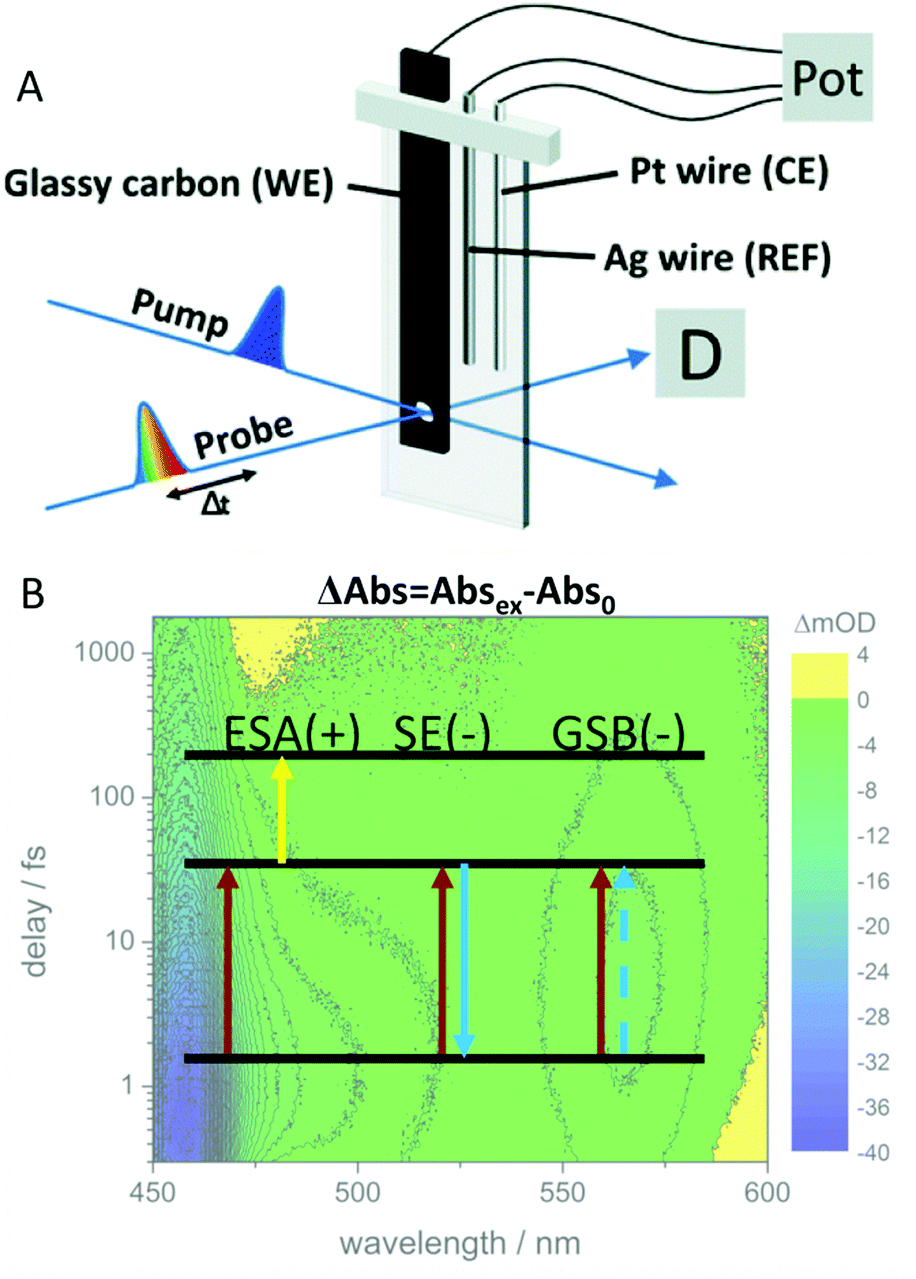 | ||
| Fig. 9 (A) Schematic representation of the cell and electrode setup used in TA-SEC experiments. (B) In transient absorption, the absorbance (or optical density) of the excited sample minus the absorbance of the unexcited sample is plotted as a function of probe wavelength. The depopulation of the ground state leads to a decreased absorbance (or increased transparency), giving rise to a negative signal contribution, the ground state bleach (GSB). A second negative contribution to the overall signal can be caused by stimulated emission (SE). The excited species shows a characteristic absorption spectrum by itself which gives rise to positive signal contribution, excited state absorption (ESA). Panel A is reproduced from ref. 189 with permission from The Royal Society of Chemistry. | ||
Irrespective of the oxidation state of the Co centre, the dyad showed similar spectral features and dynamics. This observation was interpreted as indication for missing photoinduced electron transfer under the experimental conditions. The described experiments were performed in absence of a sacrificial electron donor. Under catalytic conditions upon irradiation, the formation of the CoI centre was detected by UV/vis spectroscopy.190 From this, the authors conclude that under catalytic conditions, reductive quenching pathway occurs, i.e., the photoexcited push–pull dye is first reduced by the sacrificial agent or the photoelectrode substrate, e.g., NiO, and then subsequently an electron is transferred to the Co centre.
Zedler et al. were the first to report on the investigation of the early-time photodynamics of an electrochemically generated fully catalytically active intermediate of a photocatalyst [(tbbpy)2RuII(tpphz)RhIII(Cp*)Cl]Cl(PF6)2 (RutpphzRhCp* Fig. 6), which is a photocatalyst for the hydrogenation of nicotinamide (a nicotinamide adenine dinucleotide (NAD) analogue) and proton reduction.153 The catalytically active species, i.e., the doubly reduced [(tbbpy)2RuII(tpphz)RhICp*] is generated under catalytic conditions via two consecutive sequences of photoinduced electron transfers and rereduction of the light absorbing Ru-polypyridine unit by a sacrificial agent (triethylamine – TEA), but can also be generated by chemical reduction with cobaltocene. If the doubly reduced RutpphzRhCp* is generated by chemical reduction and tested for its reactivity in a “dark” reaction to react with benzylnicotinamide, it was observed that additional irradiation reduced the catalytic turnover significantly. The question is, why irradiation of the sample impacts the catalytic reaction? For that purpose, spectroscopic characterization of the electrochemically reduced active intermediate RutpphzRhCp* was performed. The electrochemical reduction of the RhIII centre is a two-electron reduction step caused by potential inversion of the RhIII/RhII and the RhII/RhI reduction steps induced by a loss of the chloro-ligand. For this system, the intermediate RhII species in the photochemical activation pathway is not accessible via electrochemical methods and the investigation reported solely focused on the doubly reduced species. Prior to transient absorption studies, UV/vis and rR spectroscopy in combination with TD-DFT calculations were performed to identify the electronic transitions contributing to light absorption in a certain spectral range. Already these investigations revealed that electronic transitions shifting electron density from the activated catalytic centre to the bridging tpphz ligand, significantly contribute to the absorption in the visible range in the active intermediate. Transient absorption revealed that excitation of these transitions leads to a relatively long-lived RhII state, which is inactive to any catalytic turnover, hence this pathway presents a light-driven deactivation channel for the catalytically active species (Fig. 10). On top of this, also excitation in regions where mainly the RuII sensitizer is absorbing light, relaxation into the RhII state occurs via an intramolecular hole transfer step. This means that the same light which produces the active species in the light-driven catalytic cycle opens an unwanted deactivation channel. Only the implementation of a “dark period” during which the photochemically produced RhI species is consumed successfully leads to hydrogenation of the nicotinamide.
 | ||
| Fig. 10 Transient-absorption spectra at selected delay times (A and D) and transient kinetics (B and C) for doubly reduced RutpphzRhCp* pumped at 400 nm (A and B) and 600 nm (C and D). For comparison, the inverted steady-state absorption spectrum of doubly reduced RutpphzRhCp* is also plotted (in gray) and scaled to the maximum ground-state bleach signal within the individual graphs. (E) Schematic representation of the proposed photophysical pathways for the doubly reduced photocatalyst RutpphzRhCp* upon photoexcitation at 400 and 600 nm. At 400 nm, a MLCT from RuII to the tbbpy ligand occurs, after which an electron hole is transferred on a sub-500 fs timescale, reducing RuIII and oxidizing the RhI centre. This process is followed by an inter-ligand transition shifting excitation to the tpphz ligand, this state is finally decaying via an intra-ligand charge transfer from the phenanthroline to the phenazine fragment of the bridging ligand to the ground state. In contrast, at 600 nm excitation, a MLCT from RhI to tpphz occurs which decays via an intra-ligand charge transfer to the ground state. Here, the Ru centre and the tbbpy ligands are not involved in the photodynamic processes at all. Reproduced from ref. 153 with permission from John Wiley and Sons. | ||
Zhang et al. investigated charge accumulation and excited state dynamics in intermediates of the accumulation process in a Cu-based photosensitizer.191 UV/vis-SEC and rR-SEC revealed that in principle two charges can be transferred in a light-driven fashion to the dppz-type ligand in this system.192 The question addressed with TA-SEC was how long lived the charge accumulation of two charges at the dppz ligand is. It could be shown that starting from the singly reduced complex, essentially an MLCT transition is excited which very quickly interconverts into an ILCT state and recombines leading to quenching of the accumulated charges at the ligand within 10–20 ps. This is in line with the observation also made for other systems that products of electron transfer often suffer from very short excited state lifetimes preventing photoaccumulation of charges.152,154 A further stabilization of the charge separation products is necessary. This can be realized by subsequent protonation, hence coupling of electron and proton transfer, or the presence of sacrificial electron donors in high concentrations, which is usually the case at catalytic conditions, inducing ultrafast reductive quenching processes that could prevent these fast recombinations observed under the conditions in the SEC experiment.
These discussed investigations impressively illustrate the value of TA-SEC investigation for the understanding of mechanistic aspects of multielectron photocatalysis, but also point directly towards the limitations of the technique: the investigations are performed under non-catalytic conditions, i.e., in absence of any sacrificial donor and substrate. This way, these investigations solely report on the excited-state dynamics launched by absorption of light in the intermediate species. Impact of interaction with the substrate and sacrificial agents is disregarded in these set of experiments. Nevertheless, it allows to catch a glimpse on important mechanistic steps in the electron transfer cascades occurring during the catalytic cycle. Studies under real reaction conditions, i.e., in presence of sacrificial donor and substrate are required defining the next challenge to be mastered. The adaption of pump–pump–probe schemes to photocatalytic systems might pave the way towards the next level of understanding in this respect.156,193,194
2.3 Microscopic techniques
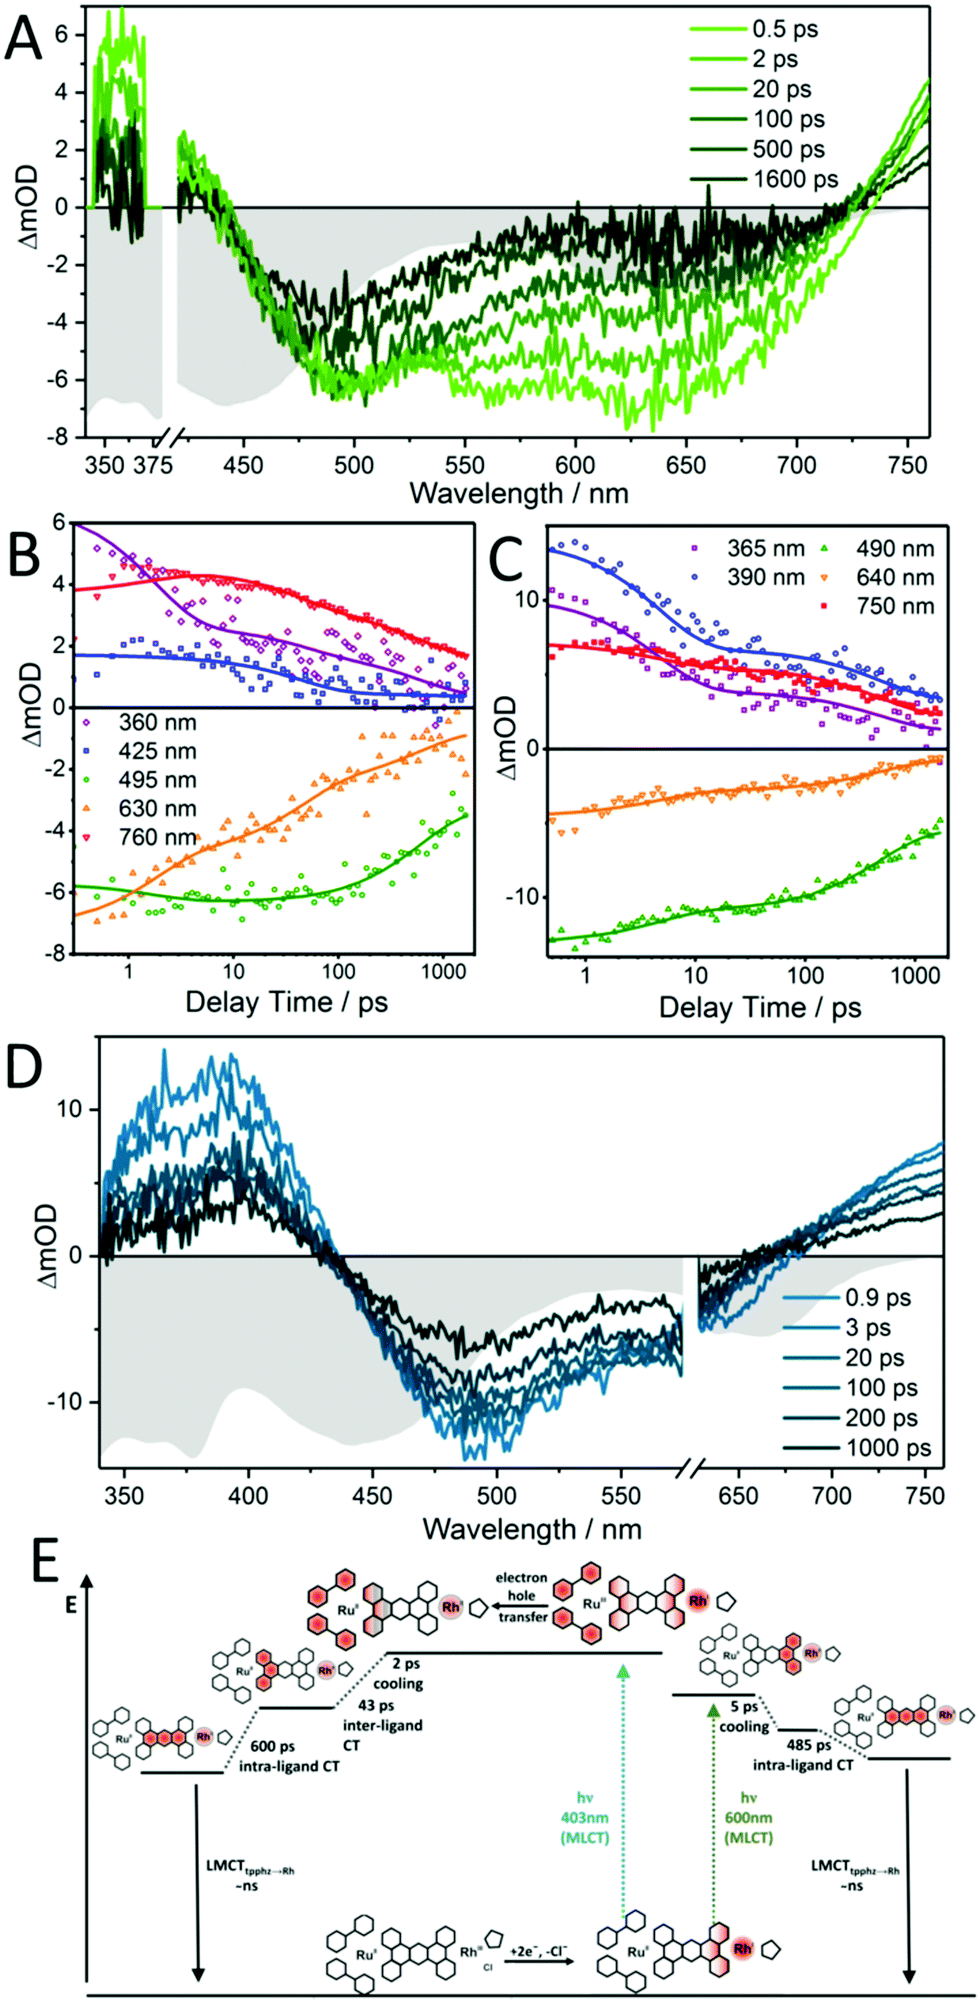
Microscopy, in particular high resolution, electron microscopic methods in combination with detectors for elemental specific information have become routine tools in ex situ characterization of hybrid photocatalysts and semiconductors, which will be highlighted in the following. Within the last decades, scanning probe microscopy has also gained interest in characterization of photocatalytic active material as in situ/operando experiments enable information not only on heterogeneity of the material but also allow mapping of morphological changes e.g., during illumination. SPM in combination with spectroscopic measurements are a promising route to elucidate electronic properties and spatial light-induced charge separation. In the following, microscopic techniques along with their advantages and limitation will be discussed.TEM and STEM have become routine tools in nanomaterial characterization also in the field of nanostructured photocatalysts and semiconductor heterostructures for water splitting.84,197 For example, Maeda and Domen presented GaN:ZnO decorated with Rh and Rh/Cr2O3 (core/shell) nanoparticles as an overall catalyst for water splitting when illuminated with visible light.198 Core/shell nanomaterials have several advantages, such as increased surface area presenting more active sites, improved stability of the photocatalyst and enhancing the activity by separating the cocatalyst, which facilitates migration and separation of photoexcited electrons that reduces the recombinations and reverse reactions.208 For example, GaN:ZnO was loaded with Rh NPs with an average size of 2–3 nm, which were not all dispersed but formed clusters on the surface (Fig. 11A). The treatment with potassium chromate (K2CrO4) led to a uniform shell around the Rh NPs with a diameter of 2 nm, as shown in Fig. 11A, which prevents rapid water formation at the Rh NPs. Using GaN:ZnO/Rh/Cr2O3, stoichiometric H2 and O2 evolution from pure water could be achieved.
 | ||
| Fig. 11 (A) Scheme and proposed reaction mechanism of the core/shell-structured noble-metal/cocatalyst (top) and HR-TEM images of GaN:ZnO loaded with photodeposited Rh and Rh/Cr2O3 (core/shell) nanoparticles. Reprinted from ref. 198 with permission from Spinger Nature. (B) Low magnification TEM images of the as-prepared Bi2Se3 (a), Bi2Se3-200 (b) and Bi2Se3-400 (c). High magnification images of as-prepared Bi2Se3 (d), Bi2Se3-200 (e) and Bi2Se3-400 (f). Reprinted from ref. 209 with permission of Elsevier. (C) Bright-field ETEM images of Cu2O nanocubes before (a) and after reaction (b), respectively, showing changes in particle shape and morphology. Reprinted from ref. 210 with permission from IOPscience. | ||
Noble-metal-free photocatalysts have gained significant attentions and the progress and remaining challenges have been recently reviewed for selected elements, their binary, ternary photocatalysts.211 As an example, Bi2Se3/Bi2SeO2 nanomaterials are promising noble-metal-free photocatalysts, which can be obtained by a thermal annealing process changing the bandgap from 0.35–1,2 eV to 1.34 V.209 The photocatalytic activity was studied in dependence of the annealing temperatures, which resulted in highest H2 evolution rate for annealing at 200 °C. TEM (Fig. 11B(a–c)) and HRTEM (Fig. 11B(d–f)) analysis revealed hexagonal morphology with interplanar spacing of 0.35 and 0.30 nm, which corresponds to (012) and (015) planes of Bi2Se3. The thickness of amorphous surface Bi2SeO2 increased from 2 nm (as prepared) to 5 nm (200 °C) to crystalline Bi2SeO2 (400 °C) with an interplanar spacing of 0.37 nm as shown in Fig. 11B(f).
A few approaches have been demonstrated regarding in situ TEM studies of photocatalytic materials.210,212,213 Such in situ studies may contribute to the understanding of structure–reactivity relationships, as well as to elucidating processes such as photo-induced corrosion. These studies are mainly performed using environmental transmission electron microscopy (ETEM), which requires either that the sample is separated from the vacuum system of the microscope using thin electron transparent membranes214 referred to as ‘window method’ or using a differential pumping system.215 The large pressure difference between the sample area and the microscope column is achieved via a series of differential pumping apertures and additional pumping capacity. Cavalca et al. developed special lens-based and fibre-based holders, which allows illumination of the sample in ETEM.210 Photo-induced corrosion of Cu2O nanotubes was investigated with water vapor leaking into the specimen chamber while illuminating the sample at λ = 450 nm with a power of 6 W cm−2 (Fig. 11C). It should be noted that the electron beam was off during illumination and exposure to water vapor, as the electron beam under these conditions already led to severe degradation. Prior to imaging, the chamber was pumped for several hours to remove the water. Such in situ experiments are quite challenging but allow insight in degradation processes.
Semiconductor nanorod heterostructures (hetero-NRs) are highly attractive as quantum confinement can be maintained and light absorptions can be tuned by radial dimension, whereas bulk carrier transport for long-distance charge separations are maintained in axial direction. Nanorod heterostructures22 such as CdSe@CdS dot-in-rod NRs as light absorbing unit functionalized with co-catalysts for effective water splitting are mostly characterized via TEM in respect to length, locations, and size, etc. of the CdS and co-catalyst, as shown for a few selected examples in Fig. 12. The position of the co-catalyst is important to optimize where photogenerated electrons preferentially transfer. Hence, high-resolution imaging of co-catalyst positions is a prerequisite to optimize such heterostructures. For example, CdSe@CdS NR core/shell geometry with varying CdS shell lengths were examined in respect to the photoinduced reduction of methyl viologen (MV2+).216 The aspect ratio (length/width) of the NR has a strong influence on the quenching of the emission by MV2+ indicating the important role of the CdS shell for determining the electron transfer step and the overall photocatalytic efficiency. These heterogeneous photocatalysts are not only highly attractive for water splitting, but also for decontamination of toxic organic pollutants. Nakibli et al. showed that the activity in H2 evolution at Ni decorated CdSe@CdS is correlated with the size of the Ni NPs with an optimum metal domain size of 5.2 nm.201 In dependence of the Ni concentration, the size was tuned from 2.3 to 10.1 nm, as shown in Fig. 12A. Interestingly, the determined charge separation time constants were found to be independent from the Ni tip size, which indicates a slow charge migration along the rods toward the interface, and an ultrafast interface crossing of the electron from the semiconductor into the metal phase. Aronovitch et al. used HRTEM and HAADF STEM (see Fig. 12B) to characterize Ag, Pd and AgPd mixed cocatalysts at CdSe@CdS in respect to the formation process of the mixed AgPd as well as before and after illumination.217Fig. 12B shows the different nanostructures before and after photocatalysis (illumination) for 36 h. The overall structure of the photocatalysts stays intact during photocatalysis, as clearly visible in the TEM images.
 | ||
| Fig. 12 (A) TEM images of CdSe@CdS rods with Ni tips of different size taken with two sets of magnifications 2.3 nm (A and B), 3.1 nm (C and D), 5.2 nm (E and F), 8.9 nm (G and H), and 10.1 nm (I and J). Reprinted from ref. 201 copyright (2018) American Chemical Society. (B) TEM images of the seeded rods with the various metal tips, as-prepared (left column) and after 36 h of illumination (right column). Reprinted from ref. 217 copyright (2019) American Chemical Society. (C) Scheme of the electrostatically driven colloidal CuOx and FeOx deposition. (c) Zero-loss filtered overview image of TiO2–FeOx (4.57 wt%) showing the agglomerated particles; (d) super-imposed map (Fe green channel using the Fe2,3 edge, Ti red channel using the Ti2,3 edge) showing the FeOx distribution within the composite. Reproduced from ref. 218 with permission from John Wiley and Sons. | ||
Kohsakowski et al. reported that electrostatically driven colloidal deposition of non-stabilized (without capping agent) nanoparticles of CuOx or FeOx onto TiO2 powder substrates (schematically shown in Fig. 12C) show enhanced photocatalytic activity.218 For high loading of FeOx, high-resolution energy-filtering TEM (EFTEM) mapping in combination with electron energy loss spectroscopy (EELS) could reveal that FeOx NPs with an average size of about 35 nm are randomly, yet uniformly distributed at the surface of TiO2 without significant agglomeration (Fig. 12C(d)). Recently, Wolff et al. presented hybrid CdS nanorods with molecular co catalysts as system for light-driven evolution of H2 and O2 in the absence of any sacrificial agents.31 H2 is generated on Pt nanoparticles, which were grown at the nanorod tips, while Ru(tpy)(bpy)Cl2-based oxidation catalysts were anchored via dithio-carbamate bonds onto the sides of the nanorods promoting O2 evolution. TEM was used to proof that the nanorods are highly monodisperse with a length of ∼95 nm and a width of 6 nm capped with Pt NPs at the end of the rods. TEM is also an important tool in addressing the question of catalyst transformations. For example, TEM was used to characterize the metal oxide or hydroxide nanoparticles, which are formed during the photocatalytic water oxidation with persulfate and [Ru(bpy)3]2+via homogeneous metal complexes (e.g., Co, Ni, Fe), which may only act as precursors. Such studies contribute to mechanistic insight of nanoparticle formation, which is dependent on metals, ligands and experimental conditions, such as pH.219
STEM was used to investigate CdS nanorods decorated with Pt clusters in respect to cluster size, which has a strong influence on the H2 evolution activity.199,220 Precise knowledge of the cluster size is important, as it was shown that the size of Pt nanoparticles has an influence on the catalytic activity at CdS nanomaterials.221 The HAADF-STEM images shown in Fig. 13A clearly reveal monodisperse homogeneously distributed clusters with different sizes ranging from Pt8 to Pt68. The highest activity in H2 evolution was obtained for Pt47 clusters.
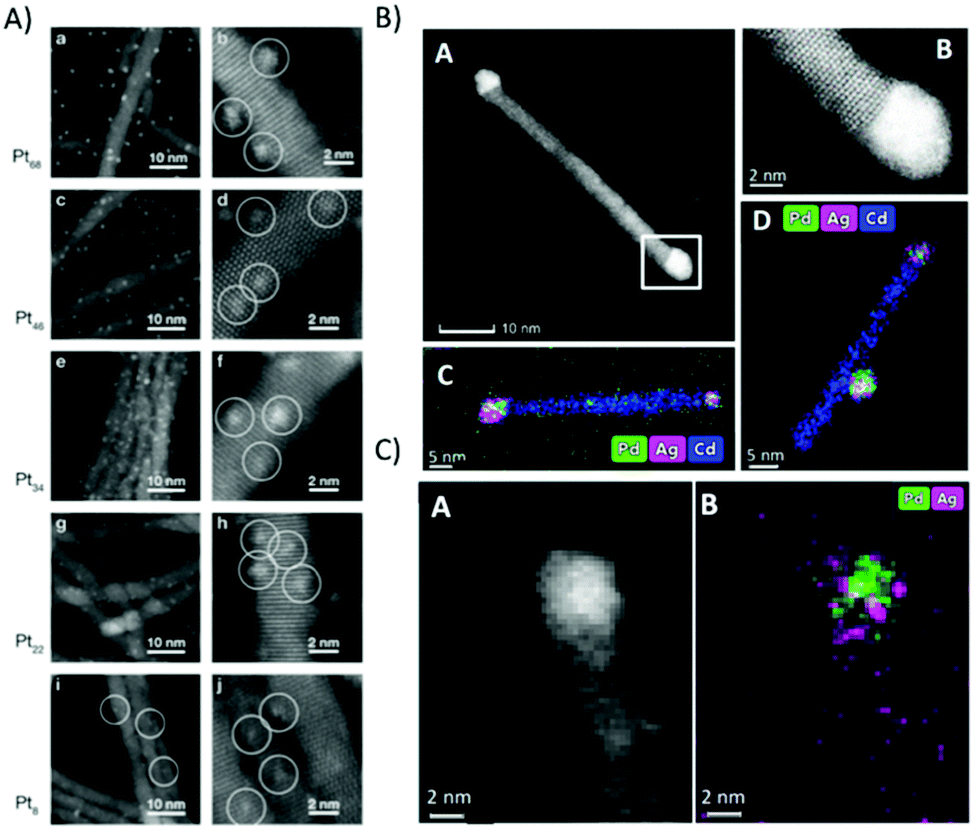 | ||
| Fig. 13 (A) HAADF STEM images of different Pt cluster sizes with similar coverage deposited onto CdS nanorod thin films. The average number of clusters per nanorod is 23 clusters. Reprinted from ref. 199 copyright (2013) American Chemical Society. (B) (A) STEM image of 5.2 nm Pd@Ag tip as synthesized, showing two tips on both edges of the rod; (B) an HR-STEM image of the atomic structure of the Wurtzite CdS rod and the metallic tip. (C and D) Elemental mappings of the same sample. (C) (A) HAADF STEM image of Pd@Ag after 36 h of illumination and (B) its EDS mapping (Pd in green, Ag in magenta). (B) and (C) reprinted from ref. 217 copyright (2019) American Chemical Society. | ||
Ag, Pd and AgPd mixed cocatalysts at CdSe@CdS (see Fig. 13B) were also investigated via STEM/EDS, however with larger metal tips and higher loading to facilitate imaging and EDS analysis. Fig. 13B(A) shows an image of the Pd@Ag seeded rods before the photocatalytic experiments, with a tip size of about 5.2 nm, deposited on both rod edges (Fig. 13B(B) high resolution STEM). EDS images shown in Fig. 13B(C) and (D) clearly reveal the mixture of both elements independent of the fabrication process.217 A high resolution HAADF STEM and EDS (Fig. 13C) shows the tip area of an AgPd/CdSe@CdS structure (with a tip size of about 3–4 nm) after photocatalysis.
Amirav et al. presented the synthesis and characterization of a hybrid heterostructure based on the well characterized CdSe/CdS dot-in-rod structures.222 As hole trapping is responsible for degradation of the chalcogenide, RuO2 was used as effective oxidation catalyst and Pt as effective reduction catalyst on these Ru–CdSe@CdS–Pt nanocomposite materials. The authors succeeded by tailored synthesis using CdSe–Ru (oxidized) dimers to tune and control the distinct positions of all 4 components. HAADF-STEM with EDS elemental mapping was also used to study the polymeric carbon nitride (PCN) membranes functionalized with oxime surface groups to covalently bind Ni as low cost co-catalyst.223 It is known that for Ni and Co, the coordination interactions with the PCN is weak. The oxime-modified samples were compared with pristine PCN modified with Ni2+. The obtained EDS data indicated that Ni is uniformly distributed on the surface of the oxime modified PCN with a higher content of Ni in comparison to pristine PCN. Selective photooxidation under UV and visible light was performed to deposit Cr2O3 and PbO2 on Au/rutile TiO2.224 Coverage of the Au NPs with an amorphous and porous Cr2O3 was observed when the sample was illuminated with visible light, suggesting that the excited electrons in the TiO2 conduction band (CB) transferred to the Au particle given the Fermi level of Au NPs. Illumination of TiO2 with UV resulted in the formation of PbO2 located on the TiO2 surface corresponding to the remained photoexcited holes. PbO2 on the Au surface and the interface led to a deactivation of the water oxidation by 30%, which was significantly further reduced by thermal treatment. STEM/EDS was used to identify the elemental distribution after photodeposition and annealing as shown in Fig. 14(A–D).
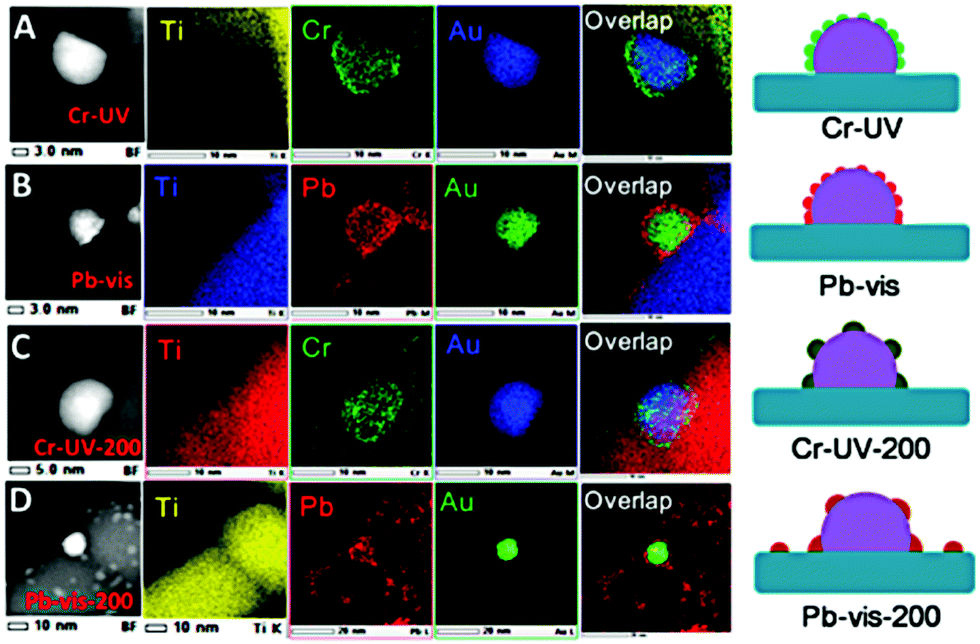 | ||
| Fig. 14 (A–D) HAADF-STEM and EDS mapping images of Au/rutile TiO2 after photodeposition with UV (<400 nm) and visible light (>440 nm). (A) Cr-UV: photoreduction deposition of Cr2O3 on Au/TiO2. (B) Pb-vis: photooxidation deposition of PbO2 on Au/TiO2. (C) Cr-UV-200: the Cr-UV sample calcined at 200 °C in air for 1 h. (D) Pb-vis-200: the Pb-vis sample calcined at 200 °C in air for 1 h. Schemes support the elemental distribution of the EDS mappings. Reprinted from ref. 224 copyright (2017) American Chemical Society. | ||
SEM is frequently used for morphological characterization of almost of kinds of semiconducting photocatalysts, as nowadays researchers have access to state-of-the-art SEMs. Although the resolution is not comparable with TEM, in combination with analytical modes, SEM is a workhorse in nanomaterial characterization. For example, TiO2 nanostructures and TiO2 containing heterostructures are widely used for water splitting, which have been recently reviewed,197 highlighting the various nanostructures and morphologic features. The influence of nanoparticle facets and co-catalyst loadings has also been studied in depth with SEM.225
Beam damage in TEM investigations are an issue for delicate samples such as polymers but also for inorganic hybrid materials and 2D materials. At high resolution, alteration of the sample may be induced via knock-on damage and atomic displacement that leads to distorted crystal lattices. In addition, morphology changes due to heating, electrostatic charging and sputtering may be observed at nanometer and micrometer length scales. The interested reader is directed towards a recent review on imaging beam sensitive materials via electron microscopy.226
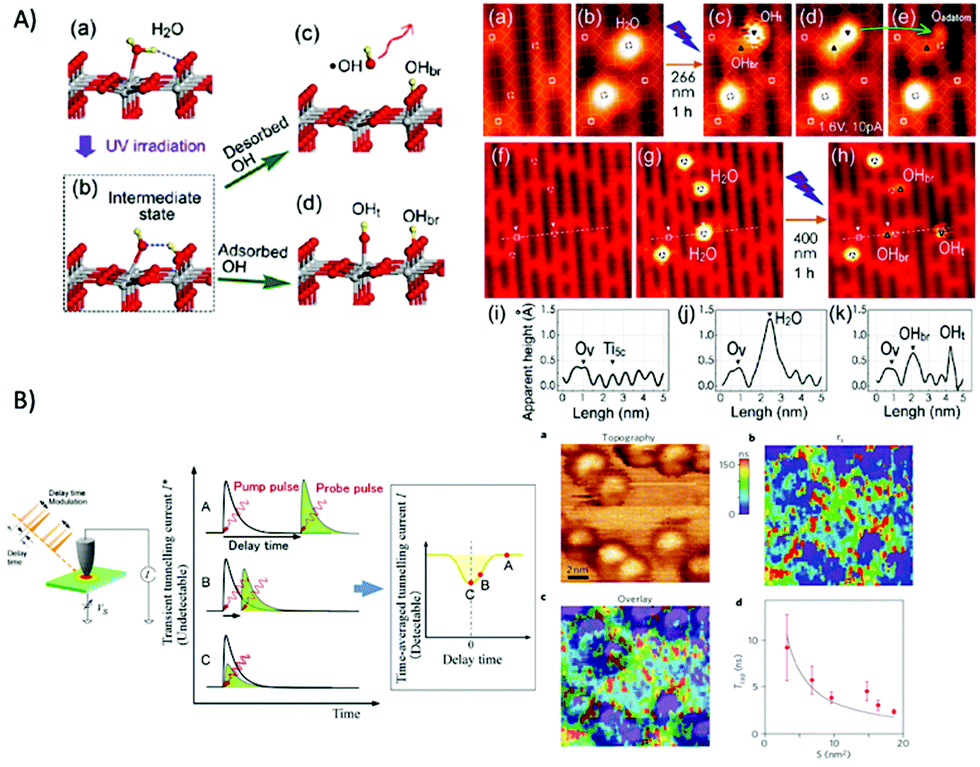 | ||
| Fig. 15 (A) Right: (a) Structural model of water at a Ti5c site under UV irradiation. (b) Possible intermediate state under UV irradiation. (c) Dissociation of the adsorbed water molecule into OHbr and desorbed ˙OH, or (d) OHbr and adsorbed OHt at a Ti5c site. Left: STM images STM images (size: 1.9 × 2.9 nm2, imaged at 1.0 V and 10 pA, 80 K) before and after water dosing. (c) Image after 266 nm UV irradiation for 1 h (Nd:YAG laser; repetition, 10 Hz; duration, 10 ns; nominal intensity, 1 mW cm−2). (d) Image acquired consecutively at 1.6 V and 10 pA. (e) Image (at 1.0 V and 10 pA) showing the further dissociation of the OHt to an Oad at the Ti5c site by applying a voltage pulse of 2.4 V. (f–h) Another set of images (6.3 × 6.6 nm2, imaged at 1.0 V and 10 pA, 80 K) showing the dissociation of water molecules under the 400 nm UV irradiation for 1 h (mercury–xenon lamp with a bandpass filter centred at 400 nm and bandwidth of 40 nm, nominal intensity: 5.1 mW cm−2). (i–k) Line profiles along the lines in (f), (g), and (h), respectively. Reprinted from ref. 229 copyright (2012) American Chemical Society. (B) Left: Principle of SPPX-STM and signal generation: relationship between delay time and transient tunnelling current I* (left), and the corresponding time-averaged tunnelling current I measured as a function of delay time (right). Reproduced from ref. 235 with permission of the American Institute of Physics. Right: Real-space analysis of the hole capture rate at cobalt nanoparticle/GaAs gap states. (a) STM image and (b) two-dimensional mapping of time-resolved signal obtained for a cobalt nanoparticle/GaAs(110) system; (c), superimposed image of (a) and (b). (d) Size dependence of hole capture rate. Reprinted from ref. 234 with permission from Springer Nature. | ||
In addition, STM can be coupled with spectroscopic methods using the entire electromagnetic window (i.e., from THz to X-rays).231 Recently, optical pump–probe methods (see also Section 2.1.4) providing femtosecond temporal resolution were combined with STM experiments to track atomic-scale ultrafast dynamics with spatial-temporal resolutions of 1 nm/sub-picosecond.232 For example, Shigekawa and coworkers used shaken-pulse-pair excited STM (SPPX-STM)233 to study gap-state-enhanced carrier recombination at cobalt nanoparticles on a GaAs(110) surface.234 The basic principle is that the sample surface beneath an STM tip is illuminated with a sequence of paired laser pulses, having a certain delay time td, while the tunnelling current is measured as a function of td. The laser pulses generate excited states (i.e., photocarrier density), which result in changes in the tunnelling current, reflecting the excitation and relaxation of the sample. At short td, the second pulse illuminates the sample in an excited state, which may result in a different intensity, depending on td. Thereby, the signal I also depends on td, because the height difference in the second current pulse changes the time-averaged value of the tunnelling current, which is mapped by STM. The STM images presented in Fig. 15B show that the decay time is short at cobalt nanoparticles (tip is directly located above) and increases when the tip is away, even at sub-nanometre distance. Recombination is only significantly increased once tunnelling electrons are injected from the STM tip to the gap states formed by the cobalt nanoparticle. If the cobalt base area (S) is increased, the capture probability should also be increased and with that TCAP decreased, as shown in Fig. 15B(d).
Among the SPM techniques, atomic force microscopy (AFM) is probably the most versatile and most commonly used method given the multitude of AFM-derived techniques. In AFM, the force interaction between a sharp tip at the end of a cantilever and the sample surface is detected based on Hooke's law. Usually, AFM is used to map the three-dimensional morphology of the sample surface. In respect to semiconductor-based photocatalysts, most morphological studies are obtained with electron microscopy as elemental specific information (EDS and EELS) is directly accessible via appropriate detectors, whereas conventional AFM without specific modification of the AFM probe is often referred to as “chemically blind”, and hence, mostly SEM or TEM studies are only supported revealing the 3D morphology by conventional AFM. For example, AFM has been used to characterize the morphology of mesoporous g-C3N4 nanomesh that shows a quantum efficiency of 5.1% at 420 nm.236 Coating AFM probes with magnetic layers or conductive materials (Ir–Pt, Ag, Au, etc.) in combination with illumination of the sample surface, gives access to information such as conductivity, work functions, electrostatic interactions but also allow spatially resolved spectroscopic studies using tip-enhanced Raman spectroscopy (TERS)237 or spatially resolved IR spectroscopic information.238 In respect to photocatalytic systems, TERS (for molecular catalysts) and Kelvin probe force microscopy (KPFM) (for semiconductors) show great promise. In combination with microscopic techniques (HRTEM, HRSEM), surface science methods, and DFT calculations, KPFM under illumination has contributed to elucidate the electronic properties and spatial light-induced charge separations based on the mapped work functions of nanostructured semiconducting photo(electro)catalysts.224,239–241 In KPFM, the contact potential difference (CPD) between a conductive AFM tip and the sample surface is measured, which is generated by an electrical force between the tip and sample surface, due to the differences in their Fermi energy levels. An AC voltage (VAC) superimposed to a DC voltage (VDC) is applied to the AFM tip. The AC voltage generates oscillating electrical forces between the AFM tip and sample surface and nullifies VDC the oscillating electrical forces that originated from the CPD between tip and sample surface. Using the known work function of the AFM probe, the work function of the sample can be calculated from the VCPD.242 Wang et al. investigated Au/rutile TiO2 as a photocatalyst prototype using selective photooxidation of Cr2O3 and PbO2 deposition shown in the STEM/EDS images in Fig. 14. The separation of plasmonic hot carriers and the location of the hot charge carriers were directly imaged by KPFM using a sample with larger Au NPs given the resolution of 30–50 nm achievable with KPFM (Fig. 16). Although the images prior to illumination and after illumination with monochromatic light at 532 nm qualitatively appeared similar, the difference in potential in the two experiments (i.e., surface potential images, (SVP)) clearly shows a ring near the Au/TiO2 interface indicating a higher surface potential that corresponds to the generation of hot carriers. The Au/TiO2 interface is the catalytic reaction site where the actual water oxidation takes place.224
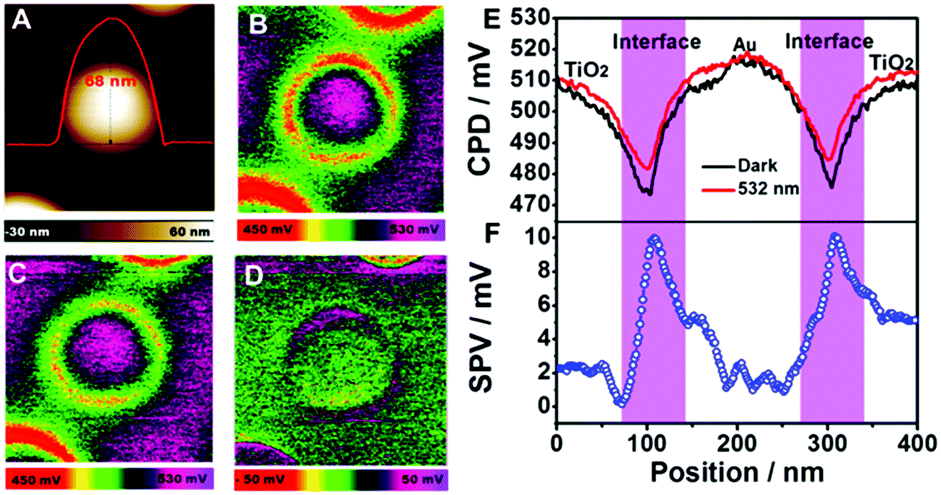 | ||
| Fig. 16 (A) AFM topography image of Au NP deposited on a TiO2 rutile single crystal. (B and C) KPFM images of Au/TiO2 (B) in the dark and (C) upon 532 nm illumination. (D) Surface voltage (SPV) image (potential under dark conditions subtracted from that under 532 nm illumination) (E) contact potential difference (CPD) profiles of dark state (black line) and light state (red line) across the Au/TiO2 particle. (F) SPV profile (the pink-coloured zones represent the Au/TiO2 interface regions). Reprinted from ref. 224 copyright (2017) American Chemical Society. | ||
For a more detailed discussion on spatially resolved surface techniques to study photogenerated charge carriers, the readers are directed to a review by Li and co-workers.243 So far, such measurements are limit to ambient conditions.
TERS is a highly attractive non-destructive method, which combines the high-resolution capability of SPM with chemical information provided by Raman spectroscopy. TERS is based on strongly enhanced electromagnetic fields at the apex of a metallized SPM tip. As other SPM based techniques, TERS has been demonstrated in ultrahigh vacuum in ambient condition as well as liquid environment.244 The metallized tip is either a modified STM tip, which is highly attractive for electrochemical TERS experiments,245 but limits its application to conductive or semi-conductive samples or metal coated AFM probes (Ag, Au), which can applied to a broad range of samples on various substrates.237 In combination with coherent anti-Stokes Raman scattering, or pulsed excitation, complementary information e.g., on electronic states can be obtained. Given all these benefits, there are still experimental limitations e.g., thermal drifts when working in ambient conditions and low stability and yields in fabricating TERS probes, which prevent routine application of TERS. Although reproducible measurements remain challenging, tremendous advantages in TERS experiments along with developing theory models have been achieved as recently reviewed by Richard-Lacroix et al.246 Large molecules such as substituted porphyrins have been studied with STM-based TERS at low temperatures and vacuum conditions.247 Van Schrojenstein Lantman et al. used TERS to investigate the dimerization of p-nitrothiophenol (p-NTP) triggered by laser light.248 A monolayer of p-NTP assembled on an Au nanoplate was excited from below as shown in Fig. 17A with a laser at 532 or 633 nm, respectively. The dimerization process to p,p′-dimercaptoazobenzene (DAMB) was induced by illuminating the sample with 532 nm light for 100–130 s (visible in Fig. 17A(a)) and a laser wavelength of 633 nm was used for spectral acquisition. Bands at 1335 cm−1 are associated with the monomer and the time resolved measurements show the disappearance of the band and the appearance of a band at 1440 cm−1 that is characteristic of the azo group in DMAB. Two representative spectra of pNTP and DMAB with the evaluated bands highlighted in grey are shown in Fig. 17B(b), whereas Fig. 17B(c) shows the intensity plot of the marker bands versus time.
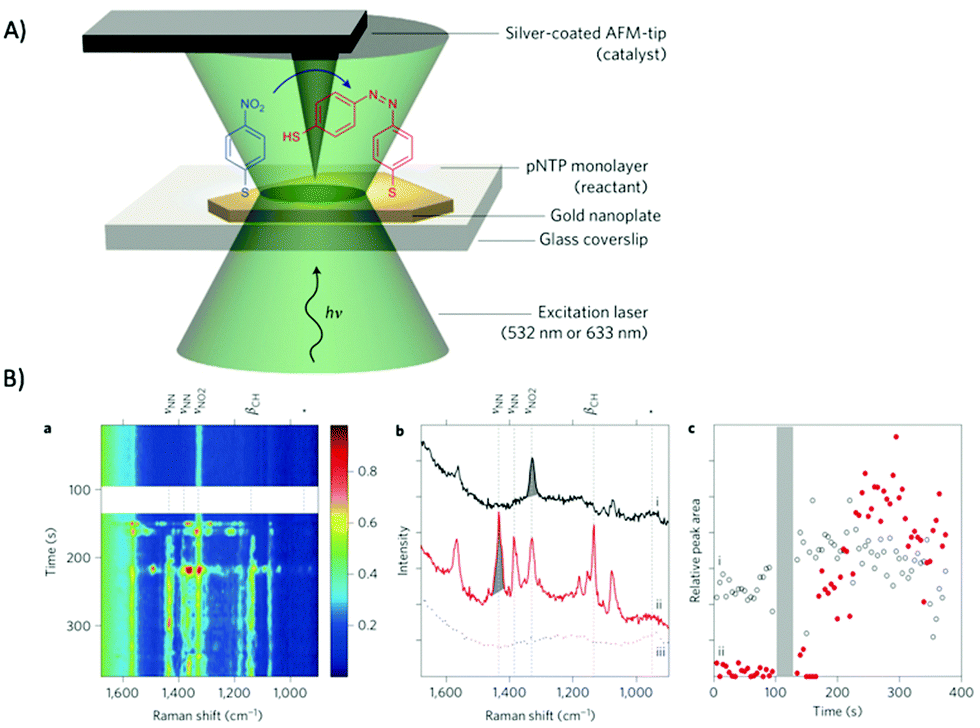 | ||
| Fig. 17 (A) Schematic overview of the experimental set-up showing the configuration for illumination, the reaction scheme and the TERS tip. (B) (a) Time-dependent TERS measurement before and after reaction (shown before (top) and after (below white band) illumination). (b) Two spectra from (a) are shown: spectrum (i) is taken at 90 s and spectrum (ii) at 265 s. Spectrum (iii) is the reference spectrum taken after the time-dependent spectra. Asterisks in (a) and (b) indicate the location of the 950 cm−1 band of the SiO2-glass signal of the glass substrate. (c) Peak areas as a function of time for the pNTP band at 1335 cm−1 (i) and for the band at 1440 cm−1 (ii), belonging to DMAB. The period of green illumination between 100 and 130 s is indicated by the shaded band. Reproduced from ref. 248 with permission from Springer Nature. | ||
Although the capacity of TERS for studying light-driven photocatalytic systems has not yet been explored, this method has great potential in particular in combination with spectroelectrochemical methods to obtain fundamental insight in photoinitiated elementary reaction steps of photocatalysis.
2.4 Scanning electrochemical probe microscopy
Within the last two decades significant progress has been made in a field that comprises scanning electrochemical probe microscopy (SEPM) techniques like scanning electrochemical microscopy (SECM),249–251 scanning electrochemical cell microscopy (SECCM),252 scanning ion conductance microscopy (SICM),253 and hybrid SEPM methods.254–256 In contrast to electrochemical (ec)-AFM or ec-STM, where electrochemical processes are triggered by applying a potential to the sample and mapping changes of the sample with the SPM probe, SEPM is based on micro- or nanosized electrochemical SPM probes such as micro- and nanoelectrodes, nanopipettes, or hybrid SICM-SECM and AFM-SECM probes.255 In contrast to the so far presented SPM techniques, SEPM are performed in solution enabling in situ/operando studies on photocatalytic processes. Although, it is still challenging to achieve spatial resolutions comparable with STM and AFM, these SEPM techniques have the unique advantage to provide information on reaction dynamics on catalyst surfaces and in situ mapping of reaction intermediates and final products (H2 and O2) of water splitting. In SECM, several modes are available for studying photo(electro)catalytic systems,257 among them generation collection mode, e.g., where the photoinduced reaction products are detected at the SECM tip. In feedback mode, the (electro)activity of the sample is probed by adding a redox species to solution, whereas in surface interrogation (SI) mode, a chemically or electrochemically adsorbed species reacts with a titrant generated at the tip. In redox competition (RC) mode, the substrate and the SECM tip are competing for the same redox active species. The properties of semiconductor oxides, such as bandgap, carrier lifetime, rates of charge recombination and charge transport are dependent on their composition and crystal structure. Bard and co-workers used SECM for rapid screening experiments on various photocatalysts using micro-spotting to form spots with different catalyst composition, which then could be locally illuminated and read-out in terms of photocatalytic efficiency using a combined optical fibre/ring microelectrode.258 Trimetallic Bi/V/Zn oxide photocatalysts were investigated under local illumination with an optical fibre containing a ring electrode using sodium sulphite Na2SO3 as sacrificial electron donor showing increase in photocurrent when atom. 10% Zn was mixed into BiVO4.259 Similar SECM screening experiment were also shown for other dopants,260–263 with improved lateral resolution by coupling the light source into the glass sheath of the microelectrode as a light guide264 and other photocatalytic materials.265,266 Wittstock and co-workers pursued another SECM approach by studying the photoinduced charge-transfer reactions at nanostructured BiVO4 at the chemically polarized immiscible liquid/liquid interface.267,268 Transition metal phosphides such as cobalt phosphide show only a slight increased overpotentials (80–100 mV) compared to Pt making them attractive materials for HER but they suffer stability issues. Ahn and Bard studied the stability of CoP under mild experimental conditions using SI-SECM.269 SI-SECM is also attractive to identify intermediates such as hydroxyl radical at semiconductor interfaces.270Within few years, tremendous progress has been made of terms of spatially resolved electrochemical measurements using nanopipettes (SICM, SECCM) or hybrid SPM approaches such as SICM-SECM, and AFM-SECM. Although, combined AFM-SECM provides high-resolution electrochemical and unsurpassed morphological information,271 nanopipette-based techniques have gained popularity, which is partially associated to the reduced costs and easy fabrication (i.e., lab-bench vs. cleanroom) of nanopipettes compared to AFM-SECM probes. Based on the concept of capillary based droplet cells,272 which can be combined with localized illumination,273 tremendous progress have been made for nanoscale electrochemical imaging with high resolution using SECCM as recently reviewed.252,274 For example, the hydrogen evolution in respect at MoS2 was investigated in respect to basal plane and step edges.275 Takahashi et al. quantitatively mapped the hydrogen evolution at 1H-MoS2 nanosheets, MoS2, and WS2 hetero-nanosheets with nanopipettes as small as 20 nm.276 Maps of HER current, overpotentials, Tafel slopes, which were retrieved from recording cyclic voltammograms at each measurement point at a triangular 1H-MoS2 sheet (see Fig. 18A(a–c) respectively) showing inhomogeneous catalytic activity between the edges and terraces as predicted by theory. Also, over-annealed 1H-MoS2 nanosheet (annealing at 300 °C in a sulphur atmosphere for 30 min) were investigated as it is known that defects improve the HER activity, which is shown in Fig. 18A(d–f). Also, Fe4.5Ni4.5S8, as a noble-metal-free HER catalyst was recently studied in HER activity in respect to surface Fe/Ni/S ratios.277 Varying the synthesis conditions or through aging processes small local variations showed a significantly altered catalytic HER activity as shown in Fig. 18B.
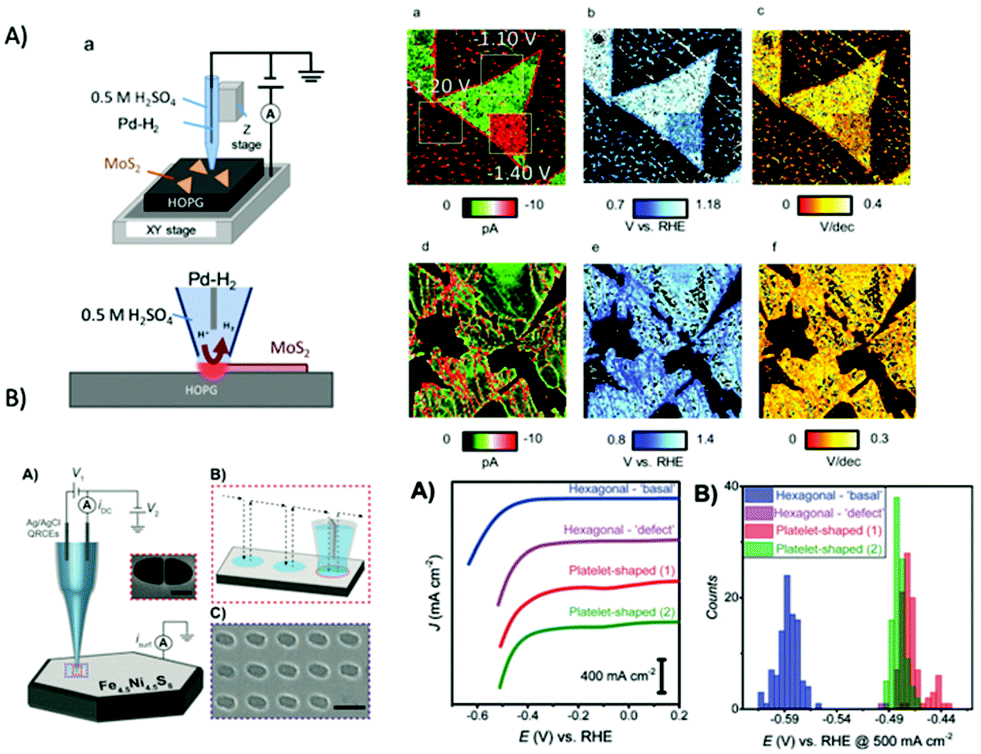 | ||
| Fig. 18 (A) (a) Scheme of SECCM measurements on MoS2 nanosheets. (B) (a) SECCM current, (b) overpotential (30 mA cm−2), and (c) Tafel slope images of electrochemical activation and imaging of 1H MoS2 nanosheets on HOPG substrate (scan size 10 × 10 mm2 and potential of −1.2 V vs. RHE. (d) Current, (e) overpotential (30 mA cm−2), and (f) Tafel slope images of heat-activated 1H MoS2 nanosheets on HOPG substrate scan size 10 × 10 mm2 and at potential of −1.1 V vs. RHE). Reproduced from ref. 276 with permission from John Wiley & Sons. (B) (left) Schematic of the SECCM measurements (A) using hopping mode (B) and SEM image after the experiments showing the droplet footprints (scale bar: 1 μm) (C). (right) (A) Averaged LSVs (scan rate: 250 mV s−1 in 0.1 M HClO4) obtained from a hexagonal Fe4.5Ni4.5S8(111) crystal basal surface (blue trace) and a macroscopic defect site (crack, pink trace), as well as Fe-rich areas of platelet-shaped crystals (red and green traces). (B) Histograms showing the distribution in potential at a current density of 500 mA cm−2. The number of measurements (n) in (A) and (B) were 98, 4, 97, and 101 for the blue, pink, red, and green traces, respectively. Reproduced from ref. 277 with permission from John Wiley & Sons. | ||
In summary, SEPM methods show great promise in mapping spatially resolved activity in situ and operando, providing important information on reaction mechanism. An issue that needs to addressed is reliability, repeatability, and reproducibility of these nano- and microelectrochemical data.250
2.5 Bulk electrochemical methods
Redox potentials, electron transfer rate constants, diffusion coefficients, charge transfer resistance and mass transport properties in light-driven catalysis processes are mainly obtained via classical bulk electrochemical methods such as cyclic voltammetry (CV), linear sweep voltammetry (LSV), pulsed voltammetric techniques (differential pulse voltammetry (DPV) and square wave, voltammetry (SWV), and electrochemical impedance spectroscopy (EIS)). These methods have the advantage that they provide a wealth of information on homogeneous and heterogeneous processes and do not require sophisticated, expensive instrumentation. Photocurrent measurements give access to the values of band edges of conduction and valence band and with that the band gap of semiconducting photo(electro)catalyst, which should be >2.0 eV considering the requirement for water splitting and possible kinetic overpotentials. Transient techniques, such as intensity modulated photocurrent spectroscopy (IMPS) and intensity modulated photovoltage spectroscopy (IMVS) are mostly used in solar cells research to study electron recombination and electron diffusion processes.278 IMPS has been pioneered by Peters and co-workers, who also developed models for analysing the frequency modulated photocurrent for 1-electron transfer reaction as well as for complex reactions with more electron transfer steps.279–281 Within the last few years, significant increase in reports using IMPS for studying photoanodes and photocathodes is noticeable, as this technique allows to distinguish between charge transfer and surface recombination processes which governs the efficiency of the material. The interested reader on both of these methods is directed to recent reviews,90,282 although it should be noted that IMVS is much less used for studying photoelectrodes for water splitting. | ||
| Fig. 19 (A) Schematic diagrams showing the energy levels and from a n-type semiconductor surface to the bulk. The blue lines indicate the corresponding space charge region of thickness, D. Reproduced from ref. 283 copyright (2012) American Chemical Society. (B) Dependence of potential from pH values (a). Flat-band potentials of nanosheet films with different compositions and at different pHs values (a). Dots are the measured data; solid lines are estimated Fermi level potentials based on calculations. (b) DFT-calculated energy diagram including conduction band minimum, valence band maximum, and band gap values for HCa2Nb3O10, HSr2Nb3O10, and HCa2Ta3O10 nanosheets. Reprinted from ref. 287 copyright (2016) American Chemical Society. | ||
Semiconductor electrodes – and more precisely the semiconductor/electrolyte interface – have been extensively studied via CVs at dark conditions and under illumination for more than 45 years.5,288,289 Heterogeneous electron transfer at metal electrodes is governed by pseudo-first-order kinetics due to the high density of electrons near the Fermi level, whereas at a semiconductor electrode, the densities of electrons, and holes remain limited to the space charge layer (i.e., depletion layer as the surface is depleted of its majority carriers); see Fig. 19A, leading to band bending. The cyclic voltammogram recorded at a semiconductor electrode depends not only on the mass transfer of the redox active species towards the electrode and the electron transfer kinetics governed by the applied potential, but also on contributions from the charge separation layer. When illuminated, the flux of photogenerated carriers has to be considered as well. It was recently shown that for semiconductor electrodes, the electron transfer rate constant cannot be simply derived from CVs like for metal electrodes (Laviron290), as contributions from the potential drop in the depletion zone have to be taken into account.291
Cyclic voltammetry is also a routine method for the electrochemical characterization of molecular and supramolecular photocatalysts in order to identify the influence of the microenvironment (e.g., ligands) on the redox potential of the transition metal centres, the electron transfer characteristic (i.e., overpotentials) and – in case of binding the catalyst to a solid electrode surface – the surface coverage and the influence of attachment on the electrochemical behaviour. Cyclic voltammetry has been employed on various photocatalysts among those, biomimetic derived hydrogenase catalysts,155,292–294 POMs295–297 and their stability in dependence of pH,298,299 and supramolecular catalysts.300–303 Habermehl et al. recently demonstrated a panchromatic osmium photocatalyst [(tbbpy)2Os(tpphz)PtI2]2+ (termed OsPt)-structure shown in Fig. 20A as effective supramolecular HER catalysts.179 They employed CV and DPV for characterization. As visible in the CV and DPV (Fig. 20B), a reversible oxidation process at 0.34 V (potentials are reported vs. Fc/Fc+) is observed related to the oxidation of Os centre. A quasi-reversible reduction process at −1.19 V is well observed, while all other redox processes in the cathodic potential region are overlapping. DPV measurements were performed to confirm and better resolve the reduction processes. The authors could show that the substitution of the metal centre had almost no influence on the reduction potential of the tpphz ligand (−1.20 V for RuPt and −1.19 V for OsPt) when compared with the parent RuPt complex. However, the oxidation potentials of the respective metals occur at significantly different potential regions (0.83 V vs. 0.34 V).179 CV has also been demonstrated as a fabrication route for K7H[Nb6O19] POM-assisted electrodeposition of Co and Ni (hydr)oxide films as effective OER catalysts.304
 | ||
| Fig. 20 (A) Structure of the supramolecular OsPt complex. (B) CV and DPV of OsPt (measurements were done at 0 °C) recorded at a glassy carbon electrode in acetonitrile solutions with nBu4NPF6 as electrolyte. Scan rate: 100 mV s−1. Adapted from ref. 179 with permission from The Royal Society of Chemistry. | ||
Given the extended accessible temporal window ranging from 10−6 to 105 s, phenomena proceeding at different rates in semiconductor-based photocatalytic systems such as charge transport at dark conditions and under illumination (i.e., reflected by the charge transfer resistance), electron–hole recombination along with the electron lifetime and redox reactions at the surface of the semiconductor, and adsorption and desorption phenomena may be studied. Hence, EIS is frequently employed as an additional characterization method for OER and HER catalysts,306e.g., nanostructured TiO2,307 or composites (graphene/TiO2, g-C3N4/BiYO3,308 MoS2/CdS/g-C3N4191). Also, supramolecular organic catalyst with associated water clusters and donor–acceptor stacks with anthracene and pyridone moieties, and with cubane-like water clusters were characterized via EIS.300 To determine the flat band potential of semiconductors, the most commonly used strategy is the Mott–Schottky method, which correlates the inverse square capacitance (1/C2) to the cell potential (E). The capacitance data required for this method are frequently obtained from EIS measurements. Hankin et al. evaluated different methods to determine the flat band potential critically discussing possible problems such as oversimplified models, if multiple processes take place at the semiconductor surface.286
In contrast to conventional photoelectrode performance studies under constant illumination, IMPS is based on a small, sinusoidal modulated light intensity that is superimposed on a constant background light intensity I0. Applying a fixed potential to the photoelectrode, a transient photocurrent (phase and magnitude) is measured as a function of the frequency. To evaluate the obtained responses, mostly the model of Ponomarev and Peter is applied,280,281 which is schematically shown in Fig. 21A. The model is based on a competition between minority carrier transfer at the interface semiconductor/electrolyte and recombination with electrons in the conduction band. From IMPS data, the AC modulated response can be expressed as photocurrent admittance (Ypc(ω)) and presented as Nyquist plots. The real and imaginary parts of the photocurrent show two semicircles, one with the negative imaginary part formed by the product of the series resistance and cell capacitance Ccell (space charge and Helmholtz capacitances) and one with a positive imaginary part (upper quadrant) as shown in Fig. 21B for different treated hematite photoanodes. From these plots, first order rate constants for charge transfer (kt) (hole injection) and charge recombination (kr) at the semiconductor electrolyte interface can be obtained at the maximum of the semicircle, reflecting the relation constant of the system (ωmax = kt + kr), considering a simplified model of competing hole capture and surface recombination. For multi-step charge transfer reactions, kt and kr have to be interpreted as phenomenological rate parameters.309 The high frequency intercept with the real axis of the photocurrent equals the hole current (i.e. no recombination), the normalized low frequency intercept reflects the fraction of the hole flux that undergoes interfacial electron transfer and hence can be expressed as kt/(kr + kt). Practically, the RC time constant of the electrochemical cell has to be taken into account, as it may attenuate the high frequency part of photocurrent response.279
 | ||
| Fig. 21 (A) Generalized reaction scheme showing the competition between charge transfer and recombination. jh is the hole flux into the surface kt and kr are first order rate constants for charge transfer and surface recombination. Reproduced from ref. 279 with permission from The Royal Society of Chemistry (B) IMPS responses (Nyquist plots) of aH (atomic layer deposition), sdH (solution synthesis), and rgH (re-growth treated) at an applied potential of 0.7 V vs. RHE. Reproduced from ref. 310 with permission from The Royal Society of Chemistry. | ||
For example, hematite has been intensively studied as material for photoanodes due to its abundance, photochemical stability and narrow bandgap, however the performance is mainly limited by its poor conductivity, low carrier mobility and high electron–hole recombination and associated with that efficiency losses.110 Thorne et al. investigated different deposition regimes and regrowth procedures along with surface decorations (NiFeOx). IMPS analysis revealed that surface recombination could be reduced while charge transfer rate constants remained unchanged.310 IMPS has become an attractive method to study hematite and doped hematite as well as other photoanode materials.282,309,311–315
3. Future perspective/outlook
Substantial progress has been made and significant efforts were dedicated towards understanding the multi-electron processes and underlying mechanisms governing photocatalysis to foster knowledge-based synthetical approaches. There are still substantial challenges that need to be addressed such as efficiency, stability/degradation, device integration etc. in order to render light-driven photocatalysis economically competitive. To date, there is still little information regarding degradation pathways, reactivity changes of photocatalysts in particular when interfaced with heterogeneous supports such as metal oxides or polymers for device development. This requires further advancements of in situ and operando spectroscopic, scattering, and microscopic techniques. The use of synchrotron radiation sources improves the spatial and temporal resolution, although beam time and costs still limit a more widespread use in catalysis research. Hyphenation of characterization methods including scanning probe techniques with electrochemical methods, spectroscopic high-resolution techniques such as TERS with pump–probe transient absorption spectroscopy and electrochemical methods, or concepts for simultaneously applied spectroscopic methods in multi-method spectroscopic cells are at the forefront.Future advancements will certainly benefit from close synergetic collaborations between synthetic chemists, materials scientists, experts in advanced analytical and physicochemical characterization methods and theoretical chemists/physicists. In particular, computational studies such as DFT modelling and multi-scale modelling to describe catalytic reactivity and understand underlying mechanisms as well as gain insight into molecule–material interactions beyond the molecular level is important for rational design of materials as well as for validation of experimental results. Quantum mechanical modelling has to be expanded from few atoms to large supramolecular aggregates embedded in complex environments. For example, continuum solvation models are available to predict properties and processes of solvated molecules. Also, alternative classical description based on molecular mechanics (MM) coupled to QM methods in hybrid QM/MM approaches are employed to model photoinduced processes.316
Analytical figures-of-merit are a relevant topic and are often not considered during the characterization of photocatalysts. While not all of the analytical criteria may apply for the methods presented within this review, precision, accuracy, trueness, limit of quantification and limit of qualification, robustness, selectivity, (intra- and inter laboratory) repeatability and reproducibility are important parameters in particular for ensuring comparability of published data. Another issue in the field of light-driven photocatalysis and especially in heterogenous photocatalysis is the comparability of photocatalytic efficiency between different laboratories, which is dependent e.g., from light source, photon flux and experimental set-up but also how data are reported. There is also some discrepancy in reporting data, which is addressed in several publications.317–320 Photocatalytic efficiency in heterogenous photocatalysis is usually reported as apparent quantum yield (AQY in %), which is defined as number of reacted electrons divided the number of incident photons multiplied by 100%, (e.g., for H2 evolution the AQY is 2 × number of evolved H2 molecules divided by number of incident photons multiplied by 100%). However, sometimes turnover numbers (TON) or turnover frequencies (TOF),320 which are dependent on the “active sites” of the catalyst are reported, a difficult number to determine for solids or hybrid materials. In addition, photocatalytically produced H2 is mostly quantified with gas chromatography, which is a highly accurate method, yet requires a sampling step. According to the Franklin diagram, sampling is a critical step that may introduce uncertainties and substantial errors. Moreover, standardization of experimental set-ups including the spectrum of the light source, the light intensity at the sample, and other factors if applicable such as co-catalyst selection and loading, type and concentration of sacrificial donor etc. are a prerequisite as the H2 and O2 evolution rates are strongly dependent on these factors. In analytical chemistry, standardized procedures such as round robin tests (i.e., interlaboratory experiments) are in place to evaluate these analytical figures-of-merit, which is often not considered in other disciplines. A known issue for example is the comparability of the H2 and O2 evolution performance of different materials reported by different groups. Data published on various aspects of light-driven photocatalysis are sometimes missing important information on repeatability of measurements or accurate descriptions, how data were produced. This is particularly an issue for measurements with high spatial and temporal resolutions and at low concentrations (e.g., in case intermediates should be determined). Horwitz et al. showed the relation of coefficient of variance with concentration known as the Horwitz trumpet,321 which basically reveals substantial deviations in variance at low concentrations. In order to advance the field and make data comparable this is another challenge that needs to be addressed in light-driven photocatalysis.
4. Conclusions
This review presents an overview on state-of-the-art systems for light-driven water splitting with a focus on state-of-the-art characterization methods covering ex situ and in situ/operando methods providing information at different time and length scales to study processes challenging the efficiency of the systems. This review is intended to give an overview on classical and state-of-the-art methods to researchers and students, who are interested in this field.Conflicts of interest
There are no conflicts to declare.Acknowledgements
The authors acknowledge financial support from the Deutsche Forschungsgemeinschaft, DFG, via TRR234 “CataLight”, project number 364549901, projects B4, C4 and Z2.Notes and references
- F. Johnsson, J. Kjärstad and J. Rootzén, Clim. Policy, 2019, 19, 258–274 CrossRef.
- D. Mitchell, R. James, P. M. Forster, R. A. Betts, H. Shiogama and M. Allen, Nat. Clim. Change, 2016, 6, 735–737 CrossRef.
- N. Muradov, Int. J. Hydrogen Energy, 2017, 42, 14058–14088 CrossRef CAS.
- Y. Wang, H. Suzuki, J. Xie, O. Tomita, D. J. Martin, M. Higashi, D. Kong, R. Abe and J. Tang, Chem. Rev., 2018, 118, 5201–5241 CrossRef CAS.
- A. J. Bard, J. Photochem., 1979, 10, 59–75 CrossRef CAS.
- K. Maeda and K. Domen, J. Phys. Chem. C, 2007, 111, 7851–7861 CrossRef CAS.
- G. Zhang and X. Wang, Angew. Chem., Int. Ed., 2019, 58, 15580–15582 CrossRef CAS.
- S. Chen, T. Takata and K. Domen, Nat. Rev. Mater., 2017, 2, 17050 CrossRef CAS.
- A. Kudo and Y. Miseki, Chem. Soc. Rev., 2009, 38, 253–278 RSC.
- A. Fujishima and K. Honda, Nature, 1972, 238, 37–38 CrossRef CAS.
- S. Martha, P. Chandra Sahoo and K. M. Parida, RSC Adv., 2015, 5, 61535–61553 RSC.
- K. Maeda, D. Lu and K. Domen, Chem. – Eur. J., 2013, 19, 4986–4991 CrossRef CAS.
- C. Pan, T. Takata, M. Nakabayashi, T. Matsumoto, N. Shibata, Y. Ikuhara and K. Domen, Angew. Chem., Int. Ed., 2015, 54, 2955–2959 CrossRef CAS.
- M. Tabata, K. Maeda, T. Ishihara, T. Minegishi, T. Takata and K. Domen, J. Phys. Chem. C, 2010, 114, 11215–11220 CrossRef CAS.
- X. Chen, S. Shen, L. Guo and S. S. Mao, Chem. Rev., 2010, 110, 6503–6570 CrossRef CAS.
- G. Zhang, Z.-A. Lan, L. Lin, S. Lin and X. Wang, Chem. Sci., 2016, 7, 3062–3066 RSC.
- G. Zhang, M. Zhang, X. Ye, X. Qiu, S. Lin and X. Wang, Adv. Mater., 2014, 26, 805–809 CrossRef CAS.
- K. Maeda, T. Takata, M. Hara, N. Saito, Y. Inoue, H. Kobayashi and K. Domen, J. Am. Chem. Soc., 2005, 127, 8286–8287 CrossRef CAS.
- J. Sato, N. Saito, Y. Yamada, K. Maeda, T. Takata, J. N. Kondo, M. Hara, H. Kobayashi, K. Domen and Y. Inoue, J. Am. Chem. Soc., 2005, 127, 4150–4151 CrossRef CAS.
- Q. Wang, M. Nakabayashi, T. Hisatomi, S. Sun, S. Akiyama, Z. Wang, Z. Pan, X. Xiao, T. Watanabe, T. Yamada, N. Shibata, T. Takata and K. Domen, Nat. Mater., 2019, 18, 827–832 CrossRef CAS.
- Y. Xu, Y. Huang and B. Zhang, Inorg. Chem. Front., 2016, 3, 591–615 RSC.
- K. Wu and T. Lian, Chem. Soc. Rev., 2016, 45, 3781–3810 RSC.
- Y. Ben-Shahar and U. Banin, Top. Curr. Chem., 2016, 374, 54 CrossRef.
- M. S. Kodaimati, K. P. McClelland, C. He, S. Lian, Y. Jiang, Z. Zhang and E. A. Weiss, Inorg. Chem., 2018, 57, 3659–3670 CrossRef CAS.
- N. Razgoniaeva, P. Moroz, S. Lambright and M. Zamkov, J. Phys. Chem. Lett., 2015, 6, 4352–4359 CrossRef CAS.
- J. K. Stolarczyk, S. Bhattacharyya, L. Polavarapu and J. Feldmann, ACS Catal., 2018, 8, 3602–3635 CrossRef CAS.
- A. Vaneski, J. Schneider, A. S. Susha and A. L. Rogach, J. Photochem. Photobiol., C, 2014, 19, 52–61 CrossRef CAS.
- L. Yang, H. Zhou, T. Fan and D. Zhang, Phys. Chem. Chem. Phys., 2014, 16, 6810 RSC.
- R. D. Harris, S. Bettis Homan, M. Kodaimati, C. He, A. B. Nepomnyashchii, N. K. Swenson, S. Lian, R. Calzada and E. A. Weiss, Chem. Rev., 2016, 116, 12865–12919 CrossRef CAS.
- M. Wang, K. Han, S. Zhang and L. Sun, Coord. Chem. Rev., 2015, 287, 1–14 CrossRef CAS.
- C. M. Wolff, P. D. Frischmann, M. Schulze, B. J. Bohn, R. Wein, P. Livadas, M. T. Carlson, F. Jäckel, J. Feldmann, F. Würthner and J. K. Stolarczyk, Nat. Energy, 2018, 3, 862–869 CrossRef CAS.
- T. Hisatomi and K. Domen, Faraday Discuss., 2017, 198, 11–35 RSC.
- Z. Wang, C. Li and K. Domen, Chem. Soc. Rev., 2019, 48, 2109–2125 RSC.
- X. Xia, M. Song, H. Wang, X. Zhang, N. Sui, Q. Zhang, V. L. Colvin and W. W. Yu, Nanoscale, 2019, 11, 11071–11082 RSC.
- J. Cui, C. Li and F. Zhang, ChemSusChem, 2019, 12, 1872–1888 CrossRef CAS.
- Y. Goto, T. Hisatomi, Q. Wang, T. Higashi, K. Ishikiriyama, T. Maeda, Y. Sakata, S. Okunaka, H. Tokudome, M. Katayama, S. Akiyama, H. Nishiyama, Y. Inoue, T. Takewaki, T. Setoyama, T. Minegishi, T. Takata, T. Yamada and K. Domen, Joule, 2018, 2, 509–520 CrossRef CAS.
- A. A. Ismail and D. W. Bahnemann, Sol. Energy Mater. Sol. Cells, 2014, 128, 85–101 CrossRef CAS.
- J. Low, C. Jiang, B. Cheng, S. Wageh, A. A. Al-Ghamdi and J. Yu, Small Methods, 2017, 1, 1700080 CrossRef.
- S. J. A. Moniz, S. A. Shevlin, D. J. Martin, Z. X. Guo and J. Tang, Energy Environ. Sci., 2015, 8, 731–759 RSC.
- B. J. Ng, L. K. Putri, X. Y. Kong, Y. W. Teh, P. Pasbakhsh and S. P. Chai, Adv. Sci., 2020, 7, 1903171 CrossRef CAS.
- Y. Chen, X. Feng, Y. Liu, X. Guan, C. Burda and L. Guo, ACS Energy Lett., 2020, 5, 844–866 CrossRef CAS.
- J. W. Ager, M. R. Shaner, K. A. Walczak, I. D. Sharp and S. Ardo, Energy Environ. Sci., 2015, 8, 2811–2824 RSC.
- B. Zhang and L. Sun, Chem. Soc. Rev., 2019, 48, 2216–2264 RSC.
- C. Herrero, A. Quaranta, W. Leibl, A. W. Rutherford and A. Aukauloo, Energy Environ. Sci., 2011, 4, 2353 RSC.
- W. T. Eckenhoff, Coord. Chem. Rev., 2018, 373, 295–316 CrossRef CAS.
- Y.-J. Yuan, Z.-T. Yu, D.-Q. Chen and Z.-G. Zou, Chem. Soc. Rev., 2017, 46, 603–631 RSC.
- S. W. Gersten, G. J. Samuels and T. J. Meyer, J. Am. Chem. Soc., 1982, 104, 4029–4030 CrossRef CAS.
- L. Duan, L. Wang, F. Li, F. Li and L. Sun, Acc. Chem. Res., 2015, 48, 2084–2096 CrossRef CAS.
- J. M. Thomsen, D. L. Huang, R. H. Crabtree and G. W. Brudvig, Dalton Trans., 2015, 44, 12452–12472 RSC.
- T. Liu, B. Zhang and L. Sun, Chem. – Asian J., 2019, 14, 31–43 CrossRef CAS.
- J. D. Blakemore, R. H. Crabtree and G. W. Brudvig, Chem. Rev., 2015, 115, 12974–13005 CrossRef CAS.
- J. Li, R. Güttinger, R. Moré, F. Song, W. Wan and G. R. Patzke, Chem. Soc. Rev., 2017, 46, 6124–6147 RSC.
- K. Sakai and H. Ozawa, Coord. Chem. Rev., 2007, 251, 2753–2766 CrossRef CAS.
- E. D. Cline, S. E. Adamson and S. Bernhard, Inorg. Chem., 2008, 47, 10378–10388 CrossRef CAS.
- T. Stoll, M. Gennari, I. Serrano, J. Fortage, J. Chauvin, F. Odobel, M. Rebarz, O. Poizat, M. Sliwa, A. Deronzier and M.-N. Collomb, Chem. – Eur. J., 2013, 19, 782–792 CrossRef CAS.
- S. Fukuzumi, T. Kobayashi and T. Suenobu, Angew. Chem., Int. Ed., 2011, 50, 728–731 CrossRef CAS.
- D. Schilter, J. M. Camara, M. T. Huynh, S. Hammes-Schiffer and T. B. Rauchfuss, Chem. Rev., 2016, 116, 8693–8749 CrossRef CAS.
- B. B. Beyene and C.-H. Hung, Coord. Chem. Rev., 2020, 410, 213234 CrossRef CAS.
- H. I. Karunadasa, E. Montalvo, Y. Sun, M. Majda, J. R. Long and C. J. Chang, Science, 2012, 335, 698–702 CrossRef CAS.
- H. I. Karunadasa, C. J. Chang and J. R. Long, Nature, 2010, 464, 1329–1333 CrossRef CAS.
- K. E. Dalle, J. Warnan, J. J. Leung, B. Reuillard, I. S. Karmel and E. Reisner, Chem. Rev., 2019, 119, 2752–2875 CrossRef CAS.
- M. Schulz, M. Karnahl, M. Schwalbe and J. G. Vos, Coord. Chem. Rev., 2012, 256, 1682–1705 CrossRef CAS.
- A. Le Goff, V. Artero, B. Jousselme, P. D. Tran, N. Guillet, R. Metaye, A. Fihri, S. Palacin and M. Fontecave, Science, 2009, 326, 1384–1387 CrossRef CAS.
- M. A. Alonso-Lomillo, O. Rüdiger, A. Maroto-Valiente, M. Velez, I. Rodríguez-Ramos, F. J. Muñoz, V. M. Fernández and A. L. De Lacey, Nano Lett., 2007, 7, 1603–1608 CrossRef CAS.
- E. S. Andreiadis, P.-A. Jacques, P. D. Tran, A. Leyris, M. Chavarot-Kerlidou, B. Jousselme, M. Matheron, J. Pécaut, S. Palacin, M. Fontecave and V. Artero, Nat. Chem., 2013, 5, 48–53 CrossRef CAS.
- L. Tong, M. Göthelid and L. Sun, Chem. Commun., 2012, 48, 10025 RSC.
- K. E. deKrafft, C. Wang, Z. Xie, X. Su, B. J. Hinds and W. Lin, ACS Appl. Mater. Interfaces, 2012, 4, 608–613 CrossRef CAS.
- M. Tavakkoli, M. Nosek, J. Sainio, F. Davodi, T. Kallio, P. M. Joensuu and K. Laasonen, ACS Catal., 2017, 7, 8033–8041 CrossRef CAS.
- X. Zhou, T. Zhang, C. W. Abney, Z. Li and W. Lin, ACS Appl. Mater. Interfaces, 2014, 6, 18475–18479 CrossRef CAS.
- F. Li, B. Zhang, X. Li, Y. Jiang, L. Chen, Y. Li and L. Sun, Angew. Chem., Int. Ed., 2011, 50, 12276–12279 CrossRef CAS.
- X. Li, H. Lei, X. Guo, X. Zhao, S. Ding, X. Gao, W. Zhang and R. Cao, ChemSusChem, 2017, 10, 4632–4641 CrossRef CAS.
- M. Wang, Y. Yang, J. Shen, J. Jiang and L. Sun, Sustainable Energy Fuels, 2017, 1, 1641–1663 RSC.
- F. Zhao, J. Zhang, T. Abe, D. Wöhrle and M. Kaneko, J. Mol. Catal. A: Chem., 1999, 145, 245–256 CrossRef CAS.
- B. Zhang, F. Li, F. Yu, X. Wang, X. Zhou, H. Li, Y. Jiang and L. Sun, ACS Catal., 2014, 4, 804–809 CrossRef CAS.
- D. K. Dogutan, R. McGuire and D. G. Nocera, J. Am. Chem. Soc., 2011, 133, 9178–9180 CrossRef CAS.
- L. Wang, K. Fan, Q. Daniel, L. Duan, F. Li, B. Philippe, H. Rensmo, H. Chen, J. Sun and L. Sun, Chem. Commun., 2015, 51, 7883–7886 RSC.
- F. Li, K. Fan, L. Wang, Q. Daniel, L. Duan and L. Sun, ACS Catal., 2015, 5, 3786–3790 CrossRef CAS.
- S. K. Ibrahim, X. Liu, C. Tard and C. J. Pickett, Chem. Commun., 2007, 1535 RSC.
- I. Romanenko, A. Rajagopal, C. Neumann, A. Turchanin, C. Streb and F. H. Schacher, J. Mater. Chem. A, 2020, 8, 6238–6244 RSC.
- A. Dhakshinamoorthy, Z. Li and H. Garcia, Chem. Soc. Rev., 2018, 47, 8134–8172 RSC.
- K. Meyer, M. Ranocchiari and J. A. van Bokhoven, Energy Environ. Sci., 2015, 8, 1923–1937 RSC.
- K. Takanabe, ACS Catal., 2017, 7, 8006–8022 CrossRef CAS.
- A. S. Cherevan, S. P. Nandan, I. Roger, R. Liu, C. Streb and D. Eder, Adv. Sci., 2020, 1903511 CrossRef CAS.
- L. Zhang, J. Ran, S.-Z. Qiao and M. Jaroniec, Chem. Soc. Rev., 2019, 48, 5184–5206 RSC.
- G. Mestl, J. Mol. Catal. A: Chem., 2000, 158, 45–65 CrossRef CAS.
- H. Knoezinger and G. Mestl, Top. Catal., 1999, 8, 45–55 CrossRef.
- E. A. Reyes-Garcia, Y. Sun, K. R. Reyes-Gil and D. Raftery, Solid State Nucl. Magn. Reson., 2009, 35, 74–81 CrossRef CAS.
- Z.-A. Lan, G. Zhang and X. Wang, Appl. Catal., B, 2016, 192, 116–125 CrossRef CAS.
- L. Yang, N. Feng, Q. Wang, Y. Chu, J. Xu and F. Deng, Cell Rep. Phys. Sci., 2020, 1, 100013 CrossRef.
- H. L. Tan, F. F. Abdi and Y. H. Ng, Chem. Soc. Rev., 2019, 48, 1255–1271 RSC.
- L. Zhang, J. Ran, S. Z. Qiao and M. Jaroniec, Chem. Soc. Rev., 2019, 48, 5184–5206 RSC.
- L. Buzzetti, G. E. M. Crisenza and P. Melchiorre, Angew. Chem., Int. Ed., 2019, 58, 3730–3747 CrossRef CAS.
- H. Kim, K. M. Kosuda, R. P. Van Duyne and P. C. Stair, Chem. Soc. Rev., 2010, 39, 4820 RSC.
- M. Wächtler, J. Guthmuller, L. González and B. Dietzek, Coord. Chem. Rev., 2012, 256, 1479–1508 CrossRef.
- U. Caudillo-Flores, I. Barba-Nieto, M. J. Muñoz-Batista, A. Kubacka and M. Fernández-García, Top. Curr. Chem., 2019, 377, 24 CrossRef.
- M. A. Bañares, Catal. Today, 2005, 100, 71–77 CrossRef.
- M. A. Bañares, Adv. Mater., 2011, 23, 5293–5301 CrossRef.
- X. Li, H.-Y. Wang, H. Yang, W. Cai, S. Liu and B. Liu, Small Methods, 2018, 2, 1700395 CrossRef.
- Y. Zhai, Z. Zhu, S. Zhou, C. Zhu and S. Dong, Nanoscale, 2018, 10, 3089–3111 RSC.
- D. Hollmann, N. Rockstroh, K. Grabow, U. Bentrup, J. Rabeah, M. Polyakov, A.-E. Surkus, W. Schuhmann, S. Hoch and A. Brückner, ChemElectroChem, 2017, 4, 2117–2122 CrossRef CAS.
- D. G. H. Hetterscheid, Chem. Commun., 2017, 53, 10622–10631 RSC.
- T. Takashima, K. Ishikawa and H. Irie, J. Phys. Chem. C, 2016, 120, 24827–24834 CrossRef CAS.
- S. Wahl, S. M. El-Refaei, P. Amsalem, A. G. Buzanich, N. Koch and N. Pinna, Catal. Sci. Technol., 2020, 10, 517–528 RSC.
- K. S. Joya and X. Sala, Phys. Chem. Chem. Phys., 2015, 17, 21094–21103 RSC.
- K. Zhu, X. Zhu and W. Yang, Angew. Chem., Int. Ed., 2019, 58, 1252–1265 CrossRef CAS.
- Y. Yuan, M. Li, Z. Bai, G. Jiang, B. Liu, T. Wu, Z. Chen, K. Amine and J. Lu, Adv. Mater., 2019, 31, 1805609 CrossRef.
- J. J. A. Lozeman, P. Führer, W. Olthuis and M. Odijk, Analyst, 2020, 145, 2482–2509 RSC.
- U. Caudillo-Flores, M. J. Muñoz-Batista, A. Kubacka and M. Fernández-García, ChemPhotoChem, 2018, 2, 777–785 CrossRef CAS.
- C. Y. Cummings, F. Marken, L. M. Peter, A. A. Tahir and K. G. U. Wijayantha, Chem. Commun., 2012, 48, 2027–2029 RSC.
- P. Y. Tang and J. Arbiol, Nanoscale Horiz., 2019, 4, 1256–1276 RSC.
- F. Le Formal, E. Pastor, S. D. Tilley, C. A. Mesa, S. R. Pendlebury, M. Grätzel and J. R. Durrant, J. Am. Chem. Soc., 2015, 137, 6629–6637 CrossRef CAS.
- Y. Ma, A. Kafizas, S. R. Pendlebury, F. Le Formal and J. R. Durrant, Adv. Funct. Mater., 2016, 26, 4951–4960 CrossRef CAS.
- O. Zandi and T. W. Hamann, Nat. Chem., 2016, 8, 778–783 CrossRef CAS.
- S. Fischer, O. S. Bokareva, E. Barsch, S. I. Bokarev, O. Kühn and R. Ludwig, ChemCatChem, 2016, 8, 404–411 CrossRef CAS.
- S. I. Bokarev, D. Hollmann, A. Pazidis, A. Neubauer, J. Radnik, O. Kühn, S. Lochbrunner, H. Junge, M. Beller and A. Brückner, Phys. Chem. Chem. Phys., 2014, 16, 4789 RSC.
- H. Junge, N. Rockstroh, S. Fischer, A. Brückner, R. Ludwig, S. Lochbrunner, O. Kühn and M. Beller, Inorganics, 2017, 5, 14 CrossRef.
- C. Godemann, D. Hollmann, M. Kessler, H. Jiao, A. Spannenberg, A. Brückner and T. Beweries, J. Am. Chem. Soc., 2015, 137, 16187–16195 CrossRef CAS.
- A. Indra, P. W. Menezes, K. Kailasam, D. Hollmann, M. Schröder, A. Thomas, A. Brückner and M. Driess, Chem. Commun., 2016, 52, 104–107 RSC.
- R. Sivasankaran, N. Rockstroh, D. Hollmann, C. Kreyenschulte, G. Agostini, H. Lund, A. Acharjya, J. Rabeah, U. Bentrup, H. Junge, A. Thomas and A. Brückner, Catalysts, 2018, 8, 52 CrossRef.
- X. L. Wang, W. Liu, Y.-Y. Yu, Y. Song, W. Q. Fang, D. Wei, X.-Q. Gong, Y.-F. Yao and H. G. Yang, Nat. Commun., 2016, 7, 11918 CrossRef CAS.
- M. Zhang, M. de Respinis and H. Frei, Nat. Chem., 2014, 6, 362–367 CrossRef CAS.
- H. Frei, Curr. Opin. Chem. Eng., 2016, 12, 91–97 CrossRef.
- S. Wang, A. Aster, M. Mirmohades, R. Lomoth and L. Hammarström, Inorg. Chem., 2018, 57, 768–776 CrossRef CAS.
- S. Wang, S. Pullen, V. Weippert, T. Liu, S. Ott, R. Lomoth and L. Hammarström, Chem. – Eur. J., 2019, 25, 11135–11140 CrossRef CAS.
- M. Mirmohades, S. Pullen, M. Stein, S. Maji, S. Ott, L. Hammarström and R. Lomoth, J. Am. Chem. Soc., 2014, 136, 17366–17369 CrossRef CAS.
- Z.-J. Li, F. Zhan, H. Xiao, X. Zhang, Q.-Y. Kong, X.-B. Fan, W.-Q. Liu, M.-Y. Huang, C. Huang, Y.-J. Gao, X.-B. Li, Q.-Y. Meng, K. Feng, B. Chen, C.-H. Tung, H.-F. Zhao, Y. Tao and L.-Z. Wu, J. Phys. Chem. Lett., 2016, 7, 5253–5258 CrossRef CAS.
- G. Smolentsev, B. Cecconi, A. Guda, M. Chavarot-Kerlidou, J. A. van Bokhoven, M. Nachtegaal and V. Artero, Chem. – Eur. J., 2015, 21, 15158–15162 CrossRef CAS.
- Y. Liu, C. Wei, C. K. Ngaw, Y. Zhou, S. Sun, S. Xi, Y. Du, J. S. C. Loo, J. W. Ager and Z. J. Xu, ACS Appl. Energy Mater., 2018, 1, 814–821 CrossRef.
- T. J. Miao and J. Tang, J. Chem. Phys., 2020, 152, 194201 CrossRef CAS.
- M. Barroso, S. R. Pendlebury, A. J. Cowan and J. R. Durrant, Chem. Sci., 2013, 4, 2724 RSC.
- L. Hammarström, R. Lomoth, C. S. Ponseca, P. Chábera, J. Uhlig and V. Sundström, in Molecular Devices for Solar Energy Conversion and Storage, ed. H. Tian, G. Boschloo and A. Hagfeldt, Springer, Singapore, 2018, pp. 385–432 Search PubMed.
- J.-Y. Xu, X. Tong, P. Yu, G. E. Wenya, T. McGrath, M. J. Fong, J. Wu and Z. M. Wang, Adv. Sci., 2018, 5, 1800221 CrossRef.
- A. Päpcke, A. Friedrich and S. Lochbrunner, J. Phys.: Condens. Matter, 2020, 32, 153001 CrossRef.
- D. M. Arias-Rotondo and J. K. McCusker, Chem. Soc. Rev., 2016, 45, 5803–5820 RSC.
- C. S. Ponseca, P. Chábera, J. Uhlig, P. Persson and V. Sundström, Chem. Rev., 2017, 117, 10940–11024 CrossRef CAS.
- K. Wu, H. Zhu and T. Lian, Acc. Chem. Res., 2015, 48, 851–859 CrossRef CAS.
- S. Neppl, J. Mahl, A. S. Tremsin, B. Rude, R. Qiao, W. Yang, J. Guo and O. Gessner, Faraday Discuss., 2016, 194, 659–682 RSC.
- G. C. O’Neil, L. Miaja-Avila, Y. Il Joe, B. K. Alpert, M. Balasubramanian, D. M. Sagar, W. Doriese, J. W. Fowler, W. K. Fullagar, N. Chen, G. C. Hilton, R. Jimenez, B. Ravel, C. D. Reintsema, D. R. Schmidt, K. L. Silverman, D. S. Swetz, J. Uhlig and J. N. Ullom, J. Phys. Chem. Lett., 2017, 8, 1099–1104 CrossRef.
- S. E. Canton, K. S. Kjær, G. Vankó, T. B. van Driel, S. Adachi, A. Bordage, C. Bressler, P. Chabera, M. Christensen, A. O. Dohn, A. Galler, W. Gawelda, D. Gosztola, K. Haldrup, T. Harlang, Y. Liu, K. B. Møller, Z. Németh, S. Nozawa, M. Pápai, T. Sato, T. Sato, K. Suarez-Alcantara, T. Togashi, K. Tono, J. Uhlig, D. A. Vithanage, K. Wärnmark, M. Yabashi, J. Zhang, V. Sundström and M. M. Nielsen, Nat. Commun., 2015, 6, 6359 CrossRef CAS.
- S. E. Canton, X. Zhang, J. Zhang, T. B. van Driel, K. S. Kjaer, K. Haldrup, P. Chabera, T. Harlang, K. Suarez-Alcantara, Y. Liu, J. Pérez, A. Bordage, M. Pápai, G. Vankó, G. Jennings, C. A. Kurtz, M. Rovezzi, P. Glatzel, G. Smolentsev, J. Uhlig, A. O. Dohn, M. Christensen, A. Galler, W. Gawelda, C. Bressler, H. T. Lemke, K. B. Møller, M. M. Nielsen, R. Lomoth, K. Wärnmark and V. Sundström, J. Phys. Chem. Lett., 2013, 4, 1972–1976 CrossRef CAS.
- M. Chergui, Struct. Dyn., 2016, 3, 031001 CrossRef.
- A. Huijser, Q. Pan, D. van Duinen, M. G. Laursen, A. El Nahhas, P. Chabera, L. Freitag, L. González, Q. Kong, X. Zhang, K. Haldrup, W. R. Browne, G. Smolentsev and J. Uhlig, J. Phys. Chem. A, 2018, 122, 6396–6406 CrossRef CAS.
- Q.-H. Xu, Y.-Z. Ma and G. R. Fleming, Chem. Phys. Lett., 2001, 338, 254–262 CrossRef CAS.
- G. D. Goodno, G. Dadusc and R. J. D. Miller, J. Opt. Soc. Am. B, 1998, 15, 1791 CrossRef CAS.
- W. Y. Sohn, M. Inaba, T. Tokubuchi, J. E. Thorne, D. Wang and K. Katayama, J. Phys. Chem. C, 2019, 123, 6693–6700 CrossRef CAS.
- W. Y. Sohn, S. Kuwahara, J. E. Thorne, D. Wang and K. Katayama, ACS Omega, 2017, 2, 1031–1035 CrossRef CAS.
- Y. Gao, W. Nie, X. Wang, F. Fan and C. Li, Chem. Commun., 2020, 56, 1007–1021 RSC.
- S. R. Pendlebury, M. Barroso, A. J. Cowan, K. Sivula, J. Tang, M. Grätzel, D. Klug and J. R. Durrant, Chem. Commun., 2011, 47, 716–718 RSC.
- F. M. Pesci, A. J. Cowan, B. D. Alexander, J. R. Durrant and D. R. Klug, J. Phys. Chem. Lett., 2011, 2, 1900–1903 CrossRef CAS.
- Y. Ma, S. R. Pendlebury, A. Reynal, F. Le Formal and J. R. Durrant, Chem. Sci., 2014, 5, 2964–2973 RSC.
- J. Ravensbergen, F. F. Abdi, J. H. van Santen, R. N. Frese, B. Dam, R. van de Krol and J. T. M. Kennis, J. Phys. Chem. C, 2014, 118, 27793–27800 CrossRef CAS.
- S. Karlsson, J. Boixel, Y. Pellegrin, E. Blart, H.-C. Becker, F. Odobel and L. Hammarström, Faraday Discuss., 2012, 155, 233–252 RSC.
- L. Zedler, A. K. Mengele, K. M. Ziems, Y. Zhang, M. Wächtler, S. Gräfe, T. Pascher, S. Rau, S. Kupfer and B. Dietzek, Angew. Chem., Int. Ed., 2019, 58, 13140–13148 CrossRef CAS.
- M. Skaisgirski, X. Guo and O. S. Wenger, Inorg. Chem., 2017, 56, 2432–2439 CrossRef CAS.
- A. M. Kluwer, R. Kapre, F. Hartl, M. Lutz, A. L. Spek, A. M. Brouwer, P. W. N. M. van Leeuwen and J. N. H. Reek, Proc. Natl. Acad. Sci. U. S. A., 2009, 106, 10460–10465.
- S. Neumann, C. Kerzig and O. S. Wenger, Chem. Sci., 2019, 10, 5624–5633 RSC.
- L. M. Kiefer and K. J. Kubarych, Chem. Sci., 2018, 9, 1527–1533 RSC.
- P. N. Nguyen, H. Watanabe, Y. Tamaki, O. Ishitani and S. Kimura, Sci. Rep., 2019, 9, 11772 CrossRef.
- G. Kwon, Y.-H. Cho, K.-B. Kim, J. D. Emery, I. S. Kim, X. Zhang, A. B. F. Martinson and D. M. Tiede, J. Synchrotron Radiat., 2019, 26, 1600–1611 CrossRef CAS.
- L. Francàs, S. Corby, S. Selim, D. Lee, C. A. Mesa, R. Godin, E. Pastor, I. E. L. Stephens, K.-S. Choi and J. R. Durrant, Nat. Commun., 2019, 10, 5208 CrossRef.
- E. Pastor, F. Le Formal, M. T. Mayer, S. D. Tilley, L. Francàs, C. A. Mesa, M. Grätzel and J. R. Durrant, Nat. Commun., 2017, 8, 14280 CrossRef CAS.
- T. E. Rosser and E. Reisner, ACS Catal., 2017, 7, 3131–3141 CrossRef CAS.
- C. W. Machan, Curr. Opin. Electrochem., 2019, 15, 42–49 CrossRef CAS.
- W. Chen, A. Yu, Z.-J. Sun, B.-Q. Zhu, J. Cai and Y.-X. Chen, Curr. Opin. Electrochem., 2019, 14, 113–123 CrossRef CAS.
- K. J. Lee, N. Elgrishi, B. Kandemir and J. L. Dempsey, Nat. Rev. Chem., 2017, 1, 0039 CrossRef CAS.
- Y. Zhang, S. Kupfer, L. Zedler, J. Schindler, T. Bocklitz, J. Guthmuller, S. Rau and B. Dietzek, Phys. Chem. Chem. Phys., 2015, 17, 29637–29646 RSC.
- L. Zedler, S. Krieck, S. Kupfer and B. Dietzek, Molecules, 2019, 24, 245 CrossRef.
- R. Konduri, N. R. de Tacconi, K. Rajeshwar and F. M. MacDonnell, J. Am. Chem. Soc., 2004, 126, 11621–11629 CrossRef CAS.
- J. Nomrowski and O. S. Wenger, J. Am. Chem. Soc., 2018, 140, 5343–5346 CrossRef CAS.
- P. A. Scattergood, M. Delor, I. V. Sazanovich, O. V. Bouganov, S. A. Tikhomirov, A. S. Stasheuski, A. W. Parker, G. M. Greetham, M. Towrie, E. S. Davies, A. J. H. M. Meijer and J. A. Weinstein, Dalton Trans., 2014, 43, 17677–17693 RSC.
- Y. Luo, K. Barthelmes, M. Wächtler, A. Winter, U. S. Schubert and B. Dietzek, Chem. – Eur. J., 2017, 23, 4917–4922 CrossRef CAS.
- J. Hankache, M. Niemi, H. Lemmetyinen and O. S. Wenger, Inorg. Chem., 2012, 51, 6333–6344 CrossRef CAS.
- K. Hu, A. D. Blair, E. J. Piechota, P. A. Schauer, R. N. Sampaio, F. G. L. Parlane, G. J. Meyer and C. P. Berlinguette, Nat. Chem., 2016, 8, 853–859 CrossRef CAS.
- L. Zedler, J. Guthmuller, I. Rabelo de Moraes, S. Krieck, M. Schmitt, J. Popp and B. Dietzek, J. Phys. Chem. C, 2013, 117, 6669–6677 CrossRef CAS.
- A. K. Mengele, S. Kaufhold, C. Streb and S. Rau, Dalton Trans., 2016, 45, 6612–6618 RSC.
- S. Rau, B. Schäfer, D. Gleich, E. Anders, M. Rudolph, M. Friedrich, H. Görls, W. Henry and J. G. Vos, Angew. Chem., Int. Ed., 2006, 45, 6215–6218 CrossRef CAS.
- M. G. Pfeffer, T. Kowacs, M. Wächtler, J. Guthmuller, B. Dietzek, J. G. Vos and S. Rau, Angew. Chem., Int. Ed., 2015, 54, 6627–6631 CrossRef CAS.
- M. G. Pfeffer, B. Schäfer, G. Smolentsev, J. Uhlig, E. Nazarenko, J. Guthmuller, C. Kuhnt, M. Wächtler, B. Dietzek, V. Sundström and S. Rau, Angew. Chem., Int. Ed., 2015, 54, 5044–5048 CrossRef CAS.
- J. Habermehl, D. Nauroozi, M. Martynow, Y. E. Vilk, R. Beranek, J. Guthmuller and S. Rau, Sustainable Energy Fuels, 2020, 4, 619–624 RSC.
- M. Karnahl, C. Kuhnt, F. Ma, A. Yartsev, M. Schmitt, B. Dietzek, S. Rau and J. Popp, ChemPhysChem, 2011, 12, 2101–2109 CrossRef CAS.
- C. Kuhnt, M. Karnahl, S. Tschierlei, K. Griebenow, M. Schmitt, B. Schäfer, S. Krieck, H. Görls, S. Rau, B. Dietzek and J. Popp, Phys. Chem. Chem. Phys., 2010, 12, 1357–1368 RSC.
- S. Tschierlei, M. Karnahl, M. Presselt, B. Dietzek, J. Guthmuller, L. González, M. Schmitt, S. Rau and J. Popp, Angew. Chem., Int. Ed., 2010, 49, 3981–3984 CrossRef CAS.
- S. Tschierlei, M. Presselt, C. Kuhnt, A. Yartsev, T. Pascher, V. Sundström, M. Karnahl, M. Schwalbe, B. Schäfer, S. Rau, M. Schmitt, B. Dietzek and J. Popp, Chem. – Eur. J., 2009, 15, 7678–7688 CrossRef CAS.
- M. Wächtler, J. Guthmuller, S. Kupfer, M. Maiuri, D. Brida, J. Popp, S. Rau, G. Cerullo and B. Dietzek, Chem. – Eur. J., 2015, 21, 7668–7674 CrossRef.
- L. Zedler, J. Guthmuller, I. Rabelo de Moraes, S. Kupfer, S. Krieck, M. Schmitt, J. Popp, S. Rau and B. Dietzek, Chem. Commun., 2014, 50, 5227 RSC.
- J.-F. Lefebvre, J. Schindler, P. Traber, Y. Zhang, S. Kupfer, S. Gräfe, I. Baussanne, M. Demeunynck, J.-M. Mouesca, S. Gambarelli, V. Artero, B. Dietzek and M. Chavarot-Kerlidou, Chem. Sci., 2018, 9, 4152–4159 RSC.
- L. Zedler, S. Kupfer, I. R. de Moraes, M. Wächtler, R. Beckert, M. Schmitt, J. Popp, S. Rau and B. Dietzek, Chem. – Eur. J., 2014, 20, 3793–3799 CrossRef CAS.
- Y. Zhang, M. Heberle, M. Wächtler, M. Karnahl and B. Dietzek, RSC Adv., 2016, 6, 105801 RSC.
- S. Bold, L. Zedler, Y. Zhang, J. Massin, V. Artero, M. Chavarot-Kerlidou and B. Dietzek, Chem. Commun., 2018, 54, 10594–10597 RSC.
- N. Kaeffer, J. Massin, C. Lebrun, O. Renault, M. Chavarot-Kerlidou and V. Artero, J. Am. Chem. Soc., 2016, 138, 12308–12311 CrossRef CAS.
- Y. Zhang, M. Schulz, M. Wächtler, M. Karnahl and B. Dietzek, Coord. Chem. Rev., 2018, 356, 127–146 CrossRef CAS.
- Y. Zhang, P. Traber, L. Zedler, S. Kupfer, S. Gräfe, M. Schulz, W. Frey, M. Karnahl and B. Dietzek, Phys. Chem. Chem. Phys., 2018, 20, 24843–24857 RSC.
- T.-T. Tran, M.-H. Ha-Thi, T. Pino, A. Quaranta, C. Lefumeux, W. Leibl and A. Aukauloo, J. Phys. Chem. Lett., 2018, 9, 1086–1091 CrossRef CAS.
- S. Mendes Marinho, M.-H. Ha-Thi, V.-T. Pham, A. Quaranta, T. Pino, C. Lefumeux, T. Chamaillé, W. Leibl and A. Aukauloo, Angew. Chem., Int. Ed., 2017, 56, 15936–15940 CrossRef CAS.
- D. Liu, S. Zhang, J. Wang, T. Peng and R. Li, ACS Appl. Mater. Interfaces, 2019, 11, 27913–27923 CrossRef CAS.
- H. Tong, S. Ouyang, Y. Bi, N. Umezawa, M. Oshikiri and J. Ye, Adv. Mater., 2012, 24, 229–251 CrossRef CAS.
- J. Cai, J. Shen, X. Zhang, Y. H. Ng, J. Huang, W. Guo, C. Lin and Y. Lai, Small Methods, 2019, 3, 1–24 Search PubMed.
- K. Maeda and K. Domen, Topics in Current Chemistry, Springer-Verlag, Berlin Heidelberg, 2011, pp. 95–119 Search PubMed.
- F. F. Schweinberger, M. J. Berr, M. Döblinger, C. Wolff, K. E. Sanwald, A. S. Crampton, C. J. Ridge, F. Jäckel, J. Feldmann, M. Tschurl and U. Heiz, J. Am. Chem. Soc., 2013, 135, 13262–13265 CrossRef CAS.
- Y. Nakibli, P. Kalisman and L. Amirav, J. Phys. Chem. Lett., 2015, 6, 2265–2268 CrossRef CAS.
- Y. Nakibli, Y. Mazal, Y. Dubi, M. Wächtler and L. Amirav, Nano Lett., 2018, 18, 357–364 CrossRef CAS.
- Y. Ben-Shahar, F. Scotognella, I. Kriegel, L. Moretti, G. Cerullo, E. Rabani and U. Banin, Nat. Commun., 2016, 7, 10413 CrossRef CAS.
- K. W. Urban, Science, 2008, 321, 506–510 CrossRef CAS.
- C. Kisielowski, B. Freitag, M. Bischoff, H. van Lin, S. Lazar, G. Knippels, P. Tiemeijer, M. van der Stam, S. von Harrach, M. Stekelenburg, M. Haider, S. Uhlemann, H. Müller, P. Hartel, B. Kabius, D. Miller, I. Petrov, E. A. Olson, T. Donchev, E. A. Kenik, A. R. Lupini, J. Bentley, S. J. Pennycook, I. M. Anderson, A. M. Minor, A. K. Schmid, T. Duden, V. Radmilovic, Q. M. Ramasse, M. Watanabe, R. Erni, E. A. Stach, P. Denes and U. Dahmen, Microsc. Microanal., 2008, 14, 469–477 CrossRef CAS.
- U. Kaiser, J. Biskupek, J. C. Meyer, J. Leschner, L. Lechner, H. Rose, M. Stöger-Pollach, A. N. Khlobystov, P. Hartel, H. Müller, M. Haider, S. Eyhusen and G. Benner, Ultramicroscopy, 2011, 111, 1239–1246 CrossRef CAS.
- F. Börrnert and U. Kaiser, Phys. Rev. A, 2018, 98, 1–10 CrossRef.
- M. T. Otten, J. Electron Microsc. Tech., 1991, 17, 221–230 CrossRef CAS.
- D. Wang, T. Hisatomi, T. Takata, C. Pan, M. Katayama, J. Kubota and K. Domen, Angew. Chem., Int. Ed., 2013, 52, 11252–11256 CrossRef CAS.
- X. Wang, X. Yang, L. Miao, J. Gao, L. Wu, N. Wang and X. Li, Int. J. Hydrogen Energy, 2018, 43, 10950–10958 CrossRef CAS.
- F. Cavalca, A. B. Laursen, B. E. Kardynal, R. E. Dunin-Borkowski, S. Dahl, J. B. Wagner and T. W. Hansen, Nanotechnology, 2012, 23, 075705 CrossRef CAS.
- M. Z. Rahman, M. G. Kibria and C. B. Mullins, Chem. Soc. Rev., 2020, 49, 1887–1931 RSC.
- P. A. Crozier and T. W. Hansen, MRS Bull., 2015, 40, 38–45 CrossRef.
- L. Zhang, B. K. Miller and P. A. Crozier, Nano Lett., 2013, 13, 679–684 CrossRef CAS.
- G. M. Parkinson, Catal. Lett., 1989, 2, 303–307 CrossRef CAS.
- E. D. Boyes and P. L. Gai, Ultramicroscopy, 1997, 67, 219–232 CrossRef CAS.
- V. L. Bridewell, R. Alam, C. J. Karwacki and P. V. Kamat, Chem. Mater., 2015, 27, 5064–5071 CrossRef CAS.
- E. Aronovitch, L. Houben and M. Bar-Sadan, Chem. Mater., 2019, 31, 7231–7237 CrossRef CAS.
- S. Kohsakowski, P. Pulisova, D. Mitoraj, S. Neubert, J. Biskupek, U. Kaiser, S. Reichenberger, G. Marzun and R. Beranek, Small Methods, 2019, 3, 1800390 CrossRef.
- S. Fukuzumi, J. Jung, Y. Yamada, T. Kojima and W. Nam, Chem. – Asian J., 2016, 11, 1138–1150 CrossRef CAS.
- M. Berr, A. Vaneski, A. S. Susha, J. Rodriguez-Fernandez, M. Doblinger, F. Jackel, A. L. Rogach and J. Feldmann, Appl. Phys. Lett., 2010, 97(9), 093108 CrossRef.
- I. Vamvasakis, B. Liu and G. S. Armatas, Adv. Funct. Mater., 2016, 26, 8062–8071 CrossRef CAS.
- L. Amirav, F. Oba, S. Aloni and A. P. Alivisatos, Angew. Chem., Int. Ed., 2015, 54, 7007–7011 CrossRef CAS.
- W. Zhen, X. Yuan, X. Ning, X. Gong and C. Xue, ACS Appl. Mater. Interfaces, 2020, 12, 868–876 CrossRef CAS.
- S. Wang, Y. Gao, S. Miao, T. Liu, L. Mu, R. Li, F. Fan and C. Li, J. Am. Chem. Soc., 2017, 139, 11771–11778 CrossRef CAS.
- M. Hesari, X. Mao and P. Chen, J. Am. Chem. Soc., 2018, 140, 6729–6740 CrossRef CAS.
- Q. Chen, C. Dwyer, G. Sheng, C. Zhu, X. Li, C. Zheng and Y. Zhu, Adv. Mater., 2020, 32, 1907619 CrossRef CAS.
- Q. Guo, Z. Ma, C. Zhou, Z. Ren and X. Yang, Chem. Rev., 2019, 119, 11020–11041 CrossRef CAS.
- B. Hammer, S. Wendt and F. Besenbacher, Top. Catal., 2010, 53, 423–430 CrossRef CAS.
- S. Tan, H. Feng, Y. Ji, Y. Wang, J. Zhao, A. Zhao, B. Wang, Y. Luo, J. Yang and J. G. Hou, J. Am. Chem. Soc., 2012, 134, 9978–9985 CrossRef CAS.
- H. Hussain, G. Tocci, T. Woolcot, X. Torrelles, C. L. Pang, D. S. Humphrey, C. M. Yim, D. C. Grinter, G. Cabailh, O. Bikondoa, R. Lindsay, J. Zegenhagen, A. Michaelides and G. Thornton, Nat. Mater., 2017, 16, 461–467 CrossRef CAS.
- S. Wieghold and L. Nienhaus, Joule, 2020, 4, 524–538 CrossRef CAS.
- Y. Tian, F. Yang, G. Chaoyu and Y. Jiang, Surf. Rev. Lett., 2018, 25, 1841003 CrossRef CAS.
- O. Takeuchi, R. Morita, M. Yamashita and H. Shigekawa, Jpn. J. Appl. Phys., 2002, 41, 4994–4997 CrossRef CAS.
- Y. Terada, S. Yoshida, O. Takeuchi and H. Shigekawa, Nat. Photonics, 2010, 4, 869–874 CrossRef CAS.
- Y. Terada, S. Yoshida, O. Takeuchi and H. Shigekawa, J. Phys.: Condens. Matter, 2010, 22, 26400 CrossRef.
- Q. Han, B. Wang, J. Gao, Z. Cheng, Y. Zhao, Z. Zhang and L. Qu, ACS Nano, 2016, 10, 2745–2751 CrossRef CAS.
- T. Deckert-Gaudig, A. Taguchi, S. Kawata and V. Deckert, Chem. Soc. Rev., 2017, 46, 4077–4110 RSC.
- S. Ghosh, N. A. Kouamé, L. Ramos, S. Remita, A. Dazzi, A. Deniset-Besseau, P. Beaunier, F. Goubard, P.-H. Aubert and H. Remita, Nat. Mater., 2015, 14, 505–511 CrossRef CAS.
- L. Lin, Y. Ma, J. Wu, F. Pang, J. Ge, S. Sui, Y. Yao, R. Qi, Y. Cheng, C. G. Duan, J. Chu and R. Huang, J. Phys. Chem. C, 2019, 123, 20949–20959 CrossRef CAS.
- X. Lu, C. Y. Toe, F. Ji, W. Chen, X. Wen, R. J. Wong, J. Seidel, J. Scott, J. N. Hart and Y. H. Ng, ACS Appl. Mater. Interfaces, 2020, 12, 8324–8332 CrossRef CAS.
- J. Zhu, F. Fan, R. Chen, H. An, Z. Feng and C. Li, Angew. Chem., Int. Ed., 2015, 54, 9111–9114 CrossRef CAS.
- W. Melitz, J. Shen, A. C. Kummel and S. Lee, Surf. Sci. Rep., 2011, 66, 1–27 CrossRef CAS.
- R. Chen, F. Fan, T. Dittrich and C. Li, Chem. Soc. Rev., 2018, 47, 8238–8262 RSC.
- Z. Zhang, P. Xu, X. Yang, W. Liang and M. Sun, J. Photochem. Photobiol., C, 2016, 27, 100–112 CrossRef CAS.
- Z.-C. Zeng, S.-C. Huang, D.-Y. Wu, L.-Y. Meng, M.-H. Li, T.-X. Huang, J.-H. Zhong, X. Wang, Z.-L. Yang and B. Ren, J. Am. Chem. Soc., 2015, 137, 11928–11931 CrossRef CAS.
- M. Richard-Lacroix, Y. Zhang, Z. Dong and V. Deckert, Chem. Soc. Rev., 2017, 46, 3922–3944 RSC.
- N. Chiang, N. Jiang, D. V. Chulhai, E. A. Pozzi, M. C. Hersam, L. Jensen, T. Seideman and R. P. Van Duyne, Nano Lett., 2015, 15, 4114–4120 CrossRef CAS.
- E. M. van Schrojenstein Lantman, T. Deckert-Gaudig, A. J. G. Mank, V. Deckert and B. M. Weckhuysen, Nat. Nanotechnol., 2012, 7, 583–586 CrossRef CAS.
- S. Amemiya, A. J. Bard, F.-R. F. Fan, M. V. Mirkin and P. R. Unwin, Annu. Rev. Anal. Chem., 2008, 1, 95–131 CrossRef CAS.
- J. Izquierdo, P. Knittel and C. Kranz, Anal. Bioanal. Chem., 2018, 410, 307–324 CrossRef CAS.
- D. Polcari, P. Dauphin-Ducharme and J. Mauzeroll, Chem. Rev., 2016, 116, 13234–13278 CrossRef CAS.
- N. Ebejer, A. G. Güell, S. C. S. Lai, K. McKelvey, M. E. Snowden and P. R. Unwin, Annu. Rev. Anal. Chem., 2013, 6, 329–351 CrossRef CAS.
- C.-C. Chen, Y. Zhou and L. A. Baker, Annu. Rev. Anal. Chem., 2012, 5, 207–228 CrossRef CAS.
- C. L. Bentley, J. Edmondson, G. N. Meloni, D. Perry, V. Shkirskiy and P. R. Unwin, Anal. Chem., 2019, 91, 84–108 CrossRef CAS.
- A. N. Patel and C. Kranz, Annu. Rev. Anal. Chem., 2018, 11, 329–350 CrossRef CAS.
- Y. Takahashi, A. Kumatani, H. Shiku and T. Matsue, Anal. Chem., 2017, 89, 342–357 CrossRef CAS.
- G. Wittstock, S. Rastgar and S. Scarabino, Curr. Opin. Electrochem., 2019, 13, 25–32 CrossRef CAS.
- A. Bard, H. C. Lee, K. Leonard, H. S. Park and S. Wang, in Photoelectrochemical Water Splitting: Materials, Processes and Architectures, ed. H.-J. Lewerenz and L. M. Peter, Royal Society of Chemistry, Cambridge, UK, 2013, pp. 132–153 Search PubMed.
- J. Lee, H. Ye, S. Pan and A. J. Bard, Anal. Chem., 2008, 80, 7445–7450 CrossRef CAS.
- H. Ye, J. Lee, J. S. Jang and A. J. Bard, J. Phys. Chem. C, 2010, 114, 13322–13328 CrossRef CAS.
- S. K. Cho, H. S. Park, H. C. Lee, K. M. Nam and A. J. Bard, J. Phys. Chem. C, 2013, 117, 23048–23056 CrossRef CAS.
- H. S. Park, K. E. Kweon, H. Ye, E. Paek, G. S. Hwang and A. J. Bard, J. Phys. Chem. C, 2011, 115, 17870–17879 CrossRef CAS.
- B. Zhang, X. Zhang, X. Xiao and Y. Shen, ACS Appl. Mater. Interfaces, 2016, 8, 1606–1614 CrossRef CAS.
- F. Conzuelo, K. Sliozberg, R. Gutkowski, S. Grützke, M. Nebel and W. Schuhmann, Anal. Chem., 2017, 89, 1222–1228 CrossRef CAS.
- Y.-C. Weng and H. Chang, RSC Adv., 2016, 6, 41376–41384 RSC.
- G. Liu, C. Liu and A. J. Bard, J. Phys. Chem. C, 2010, 114, 20997–21002 CrossRef CAS.
- S. Rastgar, M. Pilarski and G. Wittstock, Chem. Commun., 2016, 52, 11382–11385 RSC.
- S. Rastgar and G. Wittstock, J. Phys. Chem. C, 2017, 121, 25941–25948 CrossRef CAS.
- H. S. Ahn and A. J. Bard, Anal. Chem., 2017, 89, 8574–8579 CrossRef CAS.
- D. Zigah, J. Rodríguez-López and A. J. Bard, Phys. Chem. Chem. Phys., 2012, 14, 12764 RSC.
- X. Shi, W. Qing, T. Marhaba and W. Zhang, Electrochim. Acta, 2020, 332, 135472 CrossRef CAS.
- A. W. Hassel and M. M. Lohrengel, Electrochim. Acta, 1997, 42, 3327–3333 CrossRef CAS.
- J. P. Kollender, A. I. Mardare and A. W. Hassel, ChemPhysChem, 2013, 14, 560–567 CrossRef CAS.
- C. L. Bentley, M. Kang and P. R. Unwin, J. Am. Chem. Soc., 2019, 141, 2179–2193 CrossRef CAS.
- C. L. Bentley, M. Kang, F. M. Maddar, F. Li, M. Walker, J. Zhang and P. R. Unwin, Chem. Sci., 2017, 8, 6583–6593 RSC.
- Y. Takahashi, Y. Kobayashi, Z. Wang, Y. Ito, M. Ota, H. Ida, A. Kumatani, K. Miyazawa, T. Fujita, H. Shiku, Y. E. Korchev, Y. Miyata, T. Fukuma, M. Chen and T. Matsue, Angew. Chem., Int. Ed., 2020, 59, 3601–3608 CrossRef CAS.
- C. L. Bentley, C. Andronescu, M. Smialkowski, M. Kang, T. Tarnev, B. Marler, P. R. Unwin, U.-P. Apfel and W. Schuhmann, Angew. Chem., Int. Ed., 2018, 57, 4093–4097 CrossRef CAS.
- S. Ravishankar, A. Riquelme, S. K. Sarkar, M. Garcia-Batlle, G. Garcia-Belmonte and J. Bisquert, J. Phys. Chem. C, 2019, 123, 24995–25014 CrossRef CAS.
- K. G. Upul Wijayantha, S. Saremi-Yarahmadi and L. M. Peter, Phys. Chem. Chem. Phys., 2011, 13, 5264–5270 RSC.
- E. A. Ponomarev and L. M. Peter, J. Electroanal. Chem., 1995, 397, 45–52 CrossRef.
- E. A. Ponomarev and L. M. Peter, J. Electroanal. Chem., 1995, 396, 219–226 CrossRef.
- D. Klotz, D. S. Ellis, H. Dotan and A. Rothschild, Phys. Chem. Chem. Phys., 2016, 18, 23438–23457 RSC.
- Z. Zhang and J. T. Yates, Chem. Rev., 2012, 112, 5520–5551 CrossRef CAS.
- Z. Chen, T. G. Deutsch, H. N. Dinh, K. Domen, K. Emery, A. J. Forman, N. Gaillard, R. Garland, C. Heske, T. F. Jaramillo, A. Kleiman-Shwarsctein, E. Miller, K. Takanabe and J. Turner, Photoelectrochemical Water Splitting, 2013, pp. 63–85 Search PubMed.
- B. Miao, A. Iqbal and K. H. Bevan, J. Phys. Chem. C, 2019, 123, 28593–28603 CrossRef.
- A. Hankin, F. E. Bedoya-Lora, J. C. Alexander, A. Regoutz and G. H. Kelsall, J. Mater. Chem. A, 2019, 7, 26162–26176 RSC.
- P. Xu, T. J. Milstein and T. E. Mallouk, ACS Appl. Mater. Interfaces, 2016, 8, 11539–11547 CrossRef CAS.
- S. N. Frank and A. J. Bard, J. Am. Chem. Soc., 1975, 97, 7427–7433 CrossRef CAS.
- A. B. Bocarsly, E. G. Walton, M. G. Bradley and M. S. Wrighton, J. Electroanal. Chem., 1979, 100, 283–306 CrossRef CAS.
- E. Laviron, J. Electroanal. Chem., 1979, 101, 19–28 CrossRef CAS.
- Y. B. Vogel, A. Molina, J. Gonzalez and S. Ciampi, Anal. Chem., 2019, 91, 5929–5937 CrossRef CAS.
- H. Abul-Futouh, M. El-khateeb, H. Görls and W. Weigand, Heteroat. Chem., 2018, 29, e21446 CrossRef.
- S. Fukuzumi, Y.-M. Lee and W. Nam, Coord. Chem. Rev., 2018, 355, 54–73 CrossRef CAS.
- F. Gloaguen, J. D. Lawrence and T. B. Rauchfuss, J. Am. Chem. Soc., 2001, 123, 9476–9477 CrossRef CAS.
- N. Ross, N. Nqakala, S. Willenberg, S. Sifuba and E. Iwuoha, Electrocatalysis, 2019, 10, 392–398 CrossRef CAS.
- C. Besson, Z. Huang, Y. V. Geletii, S. Lense, K. I. Hardcastle, D. G. Musaev, T. Lian, A. Proust and C. L. Hill, Chem. Commun., 2010, 46, 2784 RSC.
- R. Cao, H. Ma, Y. V. Geletii, K. I. Hardcastle and C. L. Hill, Inorg. Chem., 2009, 48, 5596–5598 CrossRef CAS.
- S. J. Folkman and R. G. Finke, ACS Catal., 2017, 7, 7–16 CrossRef CAS.
- F. Evangelisti, P.-E. Car, O. Blacque and G. R. Patzke, Catal. Sci. Technol., 2013, 3, 3117 RSC.
- K. Nath, M. Chandra, D. Pradhan and K. Biradha, ACS Appl. Mater. Interfaces, 2018, 10, 29417–29424 CrossRef CAS.
- S. Schönweiz, M. Heiland, M. Anjass, T. Jacob, S. Rau and C. Streb, Chem. – Eur. J., 2017, 23, 15370–15376 CrossRef.
- F. L. Huber, D. Nauroozi, A. K. Mengele and S. Rau, Eur. J. Inorg. Chem., 2017, 4020–4027 CrossRef CAS.
- B. Yang, X. Jiang, Q. Guo, T. Lei, L.-P. Zhang, B. Chen, C.-H. Tung and L.-Z. Wu, Angew. Chem., Int. Ed., 2016, 55, 6229–6234 CrossRef CAS.
- Y. Liu, S.-X. Guo, L. Ding, C. A. Ohlin, A. M. Bond and J. Zhang, ACS Appl. Mater. Interfaces, 2015, 7, 16632–16644 CrossRef CAS.
- F. Ciucci, Curr. Opin. Electrochem., 2019, 13, 132–139 CrossRef CAS.
- J. Joe, H. Yang, C. Bae and H. Shin, Catalysts, 2019, 9, 149–186 CrossRef.
- J. Ângelo, P. Magalhães, L. Andrade and A. Mendes, Appl. Surf. Sci., 2016, 387, 183–189 CrossRef.
- R. Ma, L. Dong, B. Li, T. Su, X. Luo, Z. Qin and H. Ji, ChemistrySelect, 2018, 3, 5891–5899 CrossRef CAS.
- C. Zachäus, F. F. Abdi, L. M. Peter and R. Van De Krol, Chem. Sci., 2017, 8, 3712–3719 RSC.
- J. E. Thorne, J. W. Jang, E. Y. Liu and D. Wang, Chem. Sci., 2016, 7, 3347–3354 RSC.
- S. Y. Chae, C. S. Lee, H. Jung, O.-S. Joo, B. K. Min, J. H. Kim and Y. J. Hwang, ACS Appl. Mater. Interfaces, 2017, 9, 19780–19790 CrossRef CAS.
- T. A. Kandiel, J. Photochem. Photobiol., A, 2020, 403, 112825 CrossRef CAS.
- L. Girardi, G. A. Rizzi, L. Bigiani, D. Barreca, C. Maccato, C. Marega and G. Granozzi, ACS Appl. Mater. Interfaces, 2020, 12, 31448–31458 CrossRef CAS.
- L. M. Peter, K. G. U. Wijayantha and A. A. Tahir, Faraday Discuss., 2012, 155, 309–322 RSC.
- A. Tsyganok, D. Klotz, K. D. Malviya, A. Rothschild and D. A. Grave, ACS Catal., 2018, 8, 2754–2759 CrossRef CAS.
- B. Mennucci and S. Corni, Nat. Rev. Chem., 2019, 3, 315–330 CrossRef.
- S. E. Braslavsky, A. M. Braun, A. E. Cassano, A. V. Emeline, M. I. Litter, L. Palmisano, V. N. Parmon and N. Serpone, Pure Appl. Chem., 2011, 83, 931–1014 CAS.
- H. Kisch and D. Bahnemann, J. Phys. Chem. Lett., 2015, 6, 1907–1910 CrossRef CAS.
- M. Qureshi and K. Takanabe, Chem. Mater., 2017, 29, 158–167 CrossRef CAS.
- N. Serpone, J. Photochem. Photobiol., A, 1997, 104, 1–12 CrossRef CAS.
- W. Horwitz, Anal. Chem., 1982, 54, 67A–76A CrossRef CAS.
| This journal is © The Royal Society of Chemistry 2021 |