 Open Access Article
Reversible electrowetting transitions on superhydrophobic surfaces
D.
Vanzo
,
A.
Luzar†
and
D.
Bratko
 *
*
Department of Chemistry, Virginia Commonwealth University, Richmond, Virginia 23221, USA. E-mail: dbratko@vcu.edu
First published on 5th November 2021
Abstract
An electric field applied across the interface has been shown to enable transitions from the Cassie to the Wenzel state on superhydrophobic surfaces with miniature corrugations. Molecular dynamics (MD) simulations manifest the possibility of reversible cycling between the two states when narrow surface wells support spontaneous expulsion of water in the absence of the field. With approximately 1 nm sized wells between the surface asperities, the response times to changes in the electric field are of O(0.1) ns, allowing up to GHz frequency of the cycle. Because of the orientation preferences of interfacial water in contact with the solid, the phenomenon depends on the polarity of the field normal to the interface. The threshold field strength for the Cassie-to-Wenzel transition is significantly lower for the field pointing from the aqueous phase to the surface; however, once in the Wenzel state, the opposite field direction secures tighter filling of the wells. Considerable hysteresis revealed by the delayed water retraction at decreasing field strength indicates the presence of moderate kinetic barriers to expulsion. Known to scale approximately with the square of the length scale of the corrugations, these barriers preclude the use of increased corrugation sizes while the reduction of the well diameter necessitates stronger electric fields. Field-controlled Cassie-to-Wenzel transitions are therefore optimized by using superhydrophobic surfaces with nanosized corrugations. Abrupt changes indicate a high degree of cooperativity reflecting the correlations between the wetting states of interconnected wells on the textured surface.
1 Introduction
Electrowetting allows the precise tuning of solid–liquid interfacial tension by the adjustment of the applied electric field across the interface.1,2 This method is applicable in various geometries including corrugated surfaces.3,4 When the surface material is sufficiently hydrophobic, a corrugated surface in contact with water can exist either in the fully permeated Wenzel state or in the Cassie state where liquid maintains contact with the top area of the asperities but minimizes the energetically unfavorable solid/liquid area by avoiding the wells between pillars.5–7 Transitions between the two states, driven by changes in the pressure, temperature, or applied field, are subject to strong hysteresis that typically prevents the recovery of the Cassie state4 when it becomes thermodynamically favored. Kinetic barriers between the two states can be significantly reduced by using nanocorrugated surfaces8,9 or a multi-level topography extending to the nanoscale regime.10 Because of shortened timescales associated with cavitation in nanosized wells,11,12 molecular simulations present a valuable tool to study this regime.8,9In the present work, we use molecular dynamics simulations to explore the possibility of reversible cycling between the Cassie state favored in the unperturbed system and the Wenzel state induced by the applied electric field. The persistence of the metastable Wenzel state after the cessation of the external field4 is related to the free-energy cost associated with the liquid/vapor area (alv) created during vapor cavitation in the wells. In the case of macroscopic corrugations, activation free energy (dominated by the term alvγ where γ is the surface tension)12–15 can substantially exceed thermal energy (kT). In nanometer-sized pores with cavity surfaces alv of O(nm2), on the other hand, the barriers can descend to O(10) kT and are readily overcome by thermal fluctuations.8,9 At the same time, narrower wells are harder to turn to the Wenzel state as the required pressure or electric stress16 increases roughly in proportion to the inverse confinement diameter, d−1.17 Following previous work, we model the superhydrophobic surface as a pillared surface with ‘wells’ corresponding to the free space between the four adjacent pillars, and diameter d is determined by the spacing between the opposite pillars.8 A similar topology with somewhat increased dimensions was examined in ref. 9. Our study explores if surface wells sufficiently narrow to expel water in the absence of an external field can still be wetted under experimentally realizable electric fields. Our molecular dynamics simulations manifest the existence of a regime of pore widths where hydrophobic grooves wet at achievable fields and hysteresis is adequately alleviated to allow the transition in both directions, enabling significant wettability changes under reversible electric control. At near-molecular dimensions of the corrugations where most of the water molecules in the well are in contact with the surface, the necessary field strength is shown to depend on the polarity of the field orienting the molecules in the hydration layer. Earlier studies revealed a stronger wetting propensity in fields pointing from the nonpolar solid into the aqueous phase (by convention, this direction is defined as a positive field).18,19 On a superhydrophobic surface, positive field results in a more compact well filling in the completed Wenzel state. However, when the substrate consists of decorated graphene, alignment in the negative field supports attractive correlations among water dipoles across the sheet facilitating the initial wetting of the wells. In these cases, the threshold field strength triggering intrusion is lowered in the negative (outgoing) field although it ultimately leads to a somewhat inferior filling of the wells. With nanosized corrugations, response times indicated by the simulations in changing field or from fluctuation relaxation are typically within a sub-nanosecond range. Because transitions between the Cassie and Wenzel states involve the exchange of water between the wells and the aqueous phase just above the surface, the observed timescales and transition field strengths (of O(10−3) Å−1) should be at most weakly affected by the size of the sampled area and are hence equally applicable to macroscopic surfaces with identical corrugations.
2 Model and methods
2.1 The model system
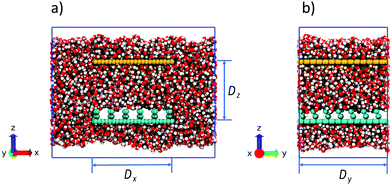
Our model system is designed for studies of reversibility and dynamics of wetting transitions between the Cassie and Wenzel states on a nanopillared surface submerged in water under ambient conditions. The transition from the superhydrophobic Cassie state to the water-permeated Wenzel state is induced by a localized electric field spanning the interface. To ensure the surface's ability to support a stable Cassie state, we employ a surface topology tested in an earlier study8 of field-free systems. The nanostructured surface consists of a graphene-like monolayer with bi-atomic posts (two-atom wide and two-atom tall) carved out of (hypothetical) 2nd and 3rd graphitic layers atop the continuous bottom sheet (Fig. 1).The stoichiometric surface-coverage (ratio of the number of pillar atoms in either of the top two layers divided by the number of atoms in the bottom graphene layer) is 1/16. Because of the horizontal shift of consecutive graphite layers, the posts are not entirely vertical as shown in the side view of the system in Fig. 2b. A full description of the pillar topology is given in an earlier study.8 The precise positions of pillar atoms correspond to the 3rd system in Fig. 1 of that work. Since the Lennard-Jones diameter of carbon atoms (∼3.2 Å) considerably exceeds the distance among the covalently bonded atoms in graphene, the projected area of a two-atom wide pillar is ∼2.3 times bigger than for a pair of graphene atoms, bringing the surface fraction f covered by the pillars close to f = 1/7, well above the stoichiometric coverage. The sterically excluded volume of the pillars (volume inaccessible to the centers of water molecules) extends to the height of ∼8.3 Å. The Wenzel roughness factor r defined as the relative increase of the solvent-accessible surface area due to the corrugations is r ∼ 5.1.
All carbon atom positions are kept fixed during the simulation. The length of the sheet in the y direction, Dy, is 59.6 Å and is periodically replicated according to laterally periodic boundary conditions. The length Dy corresponds to 7 rows of posts and 7 grooves (Fig. 2b) inside the simulation box. Surface width along the x direction Dx = 54 Å. This width accommodates 6 rows of posts and 5 grooves of consecutive wells. To maintain constant pressure of the bulk-like environment, the field-exposed region spanning the space between the corrugated surface and a hydrophilic plate at the height Dz = 40 Å is embedded in a bigger reservoir between a pair of repulsive surfaces placed at the top and bottom of the simulation box to conserve the number of molecules in the system. The width of the box along the x axis equals twice the width of the corrugated surface enabling the free flow of water between the bulk and confined phases (Fig. 2a). The upper surface placed 40 Å above the corrugated one has identical dimensions but is weakly hydrophilic and devoid of corrugations (Fig. 2). The simulation box size is 110 Å × 59.6 Å × 96.7 Å. The height (96.7 Å) does not include the free space added between the replicated boxes in the vertical dimension to accommodate the 2-dimensional periodic conditions.20 The system is filled with water from a previously equilibrated bulk while removing redundant molecules at the positions of vapor pockets or overlapping with the walls. Two 5 Å wide slab-shaped bubbles parallel to the two surfaces at the top and bottom of the box (Fig. 2) are left empty in order to allow the system to self-barostat21–23 when the electric field is applied. The net number of water molecules in the box is 13![[thin space (1/6-em)]](https://www.rsc.org/images/entities/char_2009.gif) 494. Fig. 2 shows the snapshots of the box in the absence of the field when the system is in the Cassie state.
494. Fig. 2 shows the snapshots of the box in the absence of the field when the system is in the Cassie state.
2.2 Simulation method and force field
Molecular dynamics simulations were performed using the modified version of the LAMMPS package,24 which includes the in-house setup to model the localized electric field inside the confinement. The field smoothly fades away at the boundary with the unperturbed reservoir.17,23To enable continuity and facilitate comparisons with previous studies,8,9,18,25–37 water was modelled using the SPC/E potential38 known for satisfactory performance in characterizing the dielectric properties of interfacial water.39,40 The nanostructured surface was characterized by Lennard-Jones parameters for carbon atoms σcc = 3.2145 Å and εcc = 0.151 kJ mol−1 (systems 1–7 of Werder and coworkers41). The cutoff distance of 11 Å was used to truncate Lennard-Jones and real-space electrostatic interactions. The PPPM algorithm was used for long-range electrostatics. Due to the presence of the two vapor pockets, the periodic boundary conditions were limited to the xy directions along with the Yeh-Berkowitz Ewald sum correction.20 The two repulsive walls placed at the top and bottom faces of the simulation box interacted with water via a harmonic repulsion with a spring constant of 40 kJ Å−1 and cutoff distance of 5 Å. Serving solely as a barrier preventing any vapor molecules from escaping from the box, the precise form of this short-range repulsion showed no visible effects on the conditions of the system. Nose–Hoover thermostat acting on water molecules was applied to maintain the temperature at 300 K.
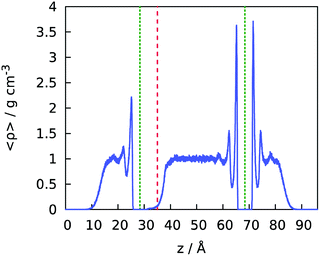
The upper confinement wall devoid of corrugations (yellow) was rendered slightly hydrophilic by using Lennard-Jones parameters for wall atoms σw = 3.2145 Å and εw = 0.489 kJ mol−1, which correspond to the water/wall contact angle just below 90° in the absence of water on the opposite side of the sheet.41,42 When water is present on both sides, the contact angle is reduced to ∼82°,42,43 which proves sufficient to trigger spontaneous filling of the laterally finite confinement between the superhydrophobic bottom surface and the weakly hydrophilic one on the top when the simulation starts with an initially empty confinement. Fig. 3 shows the equilibrium density profile of water in the simulation cell in the Cassie regime in the absence of an electric field.
Lennard-Jones interactions among the distinct atom species (here denoted by subscripts a and b) were determined according to the Lorentz–Berthelot mixing rules44εab = (εaaεbb)1/2 and σab = (σaa+σbb)/2 Å. With the above choices, the contact angle of water on the superhydrophobic surface calculated from the extrapolated nanodroplet contour as described in full detail in ref. 8 was 150 ± 10°.
2.3 Localized electric field
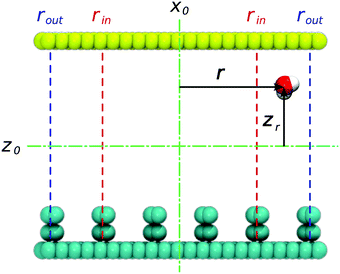
To restrict the applied electric field to the confinement, we adopt the formulation previously developed for the disk-like shape of the pore. The unscreened (input) field Eiz = Eo is presumed to be uniform within the confinement area corresponding to r < rin, (Fig. 4), where r denotes the absolute distance from the y axis. In this region, Eix = Eiy = 0. To secure a smooth fading of the field at the confinement boundaries, necessary for correct integration of equations of motion,17,23 the field decays from its core value to zero over the interval rout ≥ r ≥ rin, with rout = Dx/2. The decay is described by the expression45| Eiz(r) = f(r)Eo | (1) |
| f(r) = 1 if r < rin, |
 | (2) |
| f(r) = 0 if r > rout |
 | (3) |
 and zr =z − zo.
with zo = Dz/2. As described in detail in the former work,45 the above formulation prevents the temperature drift observed in the MD simulation in the presence of a discontinuous electric field. The ∼1 nm wide transition window rout ≥ |x| ≥ rin coincided with the area occupied by the two edge grooves (rout ∼ 26 Å and rin ∼ 16 Å) such that a uniform field of maximal strength (Eo) pervaded the three central grooves on the surface.
3. Results and discussion
3.1 Reversibility of superhydrophobic transition
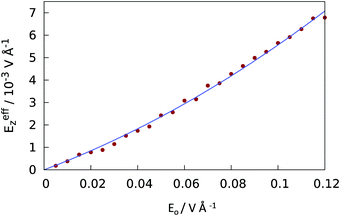
Below we present the results for water infiltration into and evacuation from the wells observed when the surface was exposed to a slowly increasing electric field to span a predetermined interval of strengths. At a maximal field, the process was reversed and the field gradually returned to zero. The cycle was repeated several times in two distinct sets of runs, one with a positive field (pointing from the superhydrophobic surface to the liquid) and the other with a negative field.The field strength was controlled through the imposition of a uniform (non-screened) field Ez = Eo, applied in the aqueous core inside the confinement over lateral distances |x| < rin. At distances rin < |x| < rout = Dx/2, the field Ez gradually decays and reaches zero at x = ±Dx/2 (see Fig. 4 and eqn (1)–(3)). While the applied field Eo represents the natural input for molecular simulations in a dielectrically nonuniform system, the actual, spatially varying field modified by dielectric screening emerges as a result of the simulation. In our system, Eo was increased from 0 to 0.12 V Å−1 in increments of 0.005 V Å−1 every 100 ps over 2.4 ns when the trend was reversed. We estimated the mean strength of the actual (screened) field inside the confined aqueous phase from the calculated water polarization46 as described in ref. 23. Fig. 5 shows the average dielectrically screened field, Eeffz, in the confined aqueous slab above the superhydrophobic surface as a function of the nonscreened input field Eo. Eeffz varies between 0 and 0.007 V Å−1, which corresponds to the spatially averaged z component of the (tensorial) dielectric constant 〈1/εzz〉−1 between 25.5 ± 1 at vanishing fields and 17 ± 1 at the strongest field considered. The zero-field value of 〈1/εzz〉−1 agrees well with the linear response result for the static dielectric constant in SPC/E water in a hydrophobic slit40 of width 3.1 nm (this width is essentially equal to the separation between the asperity tips and the upper confining wall in our system). In all results presented below, we report Eeffz values deduced from the input Eo using the smooth calibration curve from Fig. 5. Since there is no uncertainty in Eo, the accuracy of the reported Eeffz values depends solely on any systematic imprecision of the calibration. Given the large number of points used to determine the calibration curve, any uncertainty of the curve is much smaller than for individual points and hence insignificant for present purposes. Furthermore, eventual imprecision can only lead to a systematic error without affecting relative field strengths when comparing the results for a narrow range of fields in the proximity to the Cassie-to-Wenzel transition. The maximal effective field considered (Eeffz = ±0.007 V Å−1) is well below the decomposition field Ed of water (Ed ∼ 0.3 V Å−1)47 and about an order of magnitude weaker than fields in ion channels, reverse micelles, near polyelectrolyte chains48–51 or at the tip/solution interface in AFM measurements.52 Experimentally, deionized water in a micron-sized capacitor was shown to sustain static field of strength 0.012 V Å−1 over long times when current is prevented by adequate insulation and the stability is increased further by descending to submicron pores.53
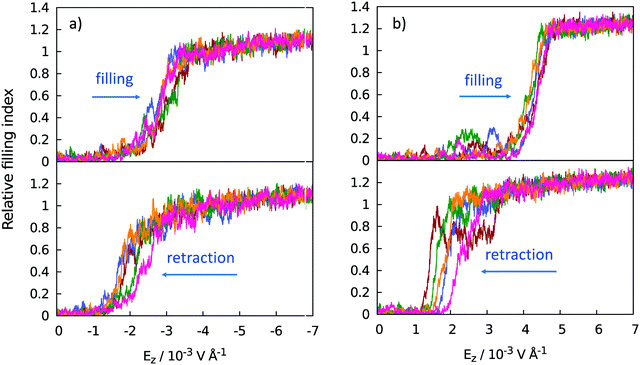
Fig. 6 illustrates the filling and evacuation transitions observed under the influence of the cycling field. Transitions are reflected in water uptake or release by the wells, quantified in terms of the relative filling index for all the wells on the substrate. Index 0 applies to the Cassie state, and values at or above 1 apply to the Wenzel state of the superhydrophobic surface. Index 1.00 corresponds to 275 water molecules confined inside the grooves on the entire surface measured at the minimal field securing a complete Wenzel state, i.e., negative (downward) field Eeffz ∼ −0.0033 V Å−1. Continued compression brings the filling index well above 1.00 with further strengthening of the field.
Simulation results show that transitions between the Cassie and Wenzel states can be controlled reversibly by the external electric field. Distinct intrusion field strengths are observed for different polarities of the field. While field strengths we consider have a small impact on the structure of liquid water32,46 they can affect the liquid/solid interaction. Enhanced surface wettability18,19 demonstrated in fields pointing toward the aqueous phase (positive field in the present setup) explains superior filling of the wells under positive fields. The threshold intrusion field is, however, weaker when the field is negative. This is possible since molecular orientations relative to the surface only become significant at close contact, corresponding to compressed situations in well-established Wenzel states. At the early stage of intrusion, there are very few contacts with the wall and the alignment with the negative field (hydrogens pointing toward the surface) is preferable with respect to long-range dipole correlations with water molecules in the polarized hydration layer below the substrate surface. Dipolar correlations across thin surfaces like graphene have been well established42,43 and the molecules below the sheet show preference for hydrogens pointing slightly away from the sheet.18,35,43 This causes unfavorable interactions with water dipoles aligned by the positive field. The disadvantage, reflected in a shallow barrier to intrusion in the positive field, is outweighed by orienting water/wall forces18,54 cooperating with the field-induced alignment when the molecules are brought into direct contact with the sheet in a complete Wenzel transition. With our simplified model surface, preferred water orientations stem solely from generic steric effects and the trend to optimize hydrogen bonding among the water molecules without addressing the possibility of additional orienting effects that can be expected on polar surfaces.37,55–57
The presence of a barrier to water infiltration into the wells is also indicated by the spread of sampled intrusion field strengths in repeated runs under the positive field. According to the above arguments, the advantage of earlier transition to the Wenzel state in the negative field should diminish with the increasing thickness of the substrate.
The appreciable hysteresis shown in Fig. 6 and the strong size-dependence of kinetic barriers to water expulsion from the wells indicate that reversible cycling would be hard or impossible in wider wells. Narrower wells, on the other hand, require stronger intrusion fields.17 The reversible electric control of the Cassie-to-Wenzel transitions illustrated in the above examples is hence of primary interest on superhydrophobic surfaces with nanosized corrugations.
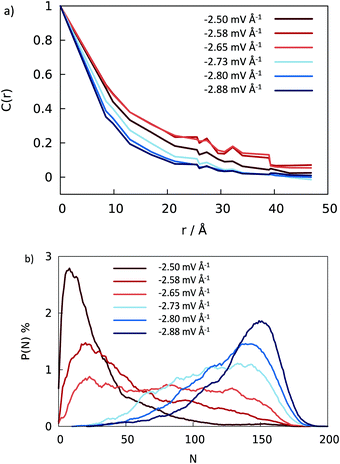
Abrupt changes between the Cassie and Wenzel states on the entire surface illustrated in Fig. 6 point to cooperative processes where most of the wells fill or evacuate together. In view of the connectedness of the wells on a pillared surface, wetting or dewetting of an individual well affects the filling probability of its neighbors. To quantify this correlation, we define a spatial correlation function C(ri,rj) between two wells with well center positions ri and rj on the super-hydrophobic surface
 | (4) |
3.2 Dynamics
 | (5) |
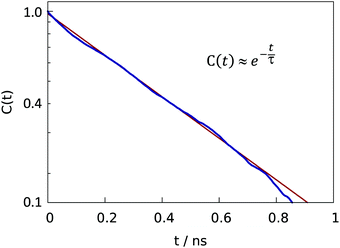 | ||
| Fig. 8 Semilogarithic plot of time correlation function describing fluctuations of water content (eqn (5)) in central grooves on the superhydrophobic surface at the Cassie-to-Wenzel transition field strength Eeffz = −2.7 ± 0.1 mV Å−1. At given field strength, the decay of C(t) is approximately exponential with characteristic time τ ∼ 0.39 ns. | ||
3.3 Projections for macroscopic surfaces
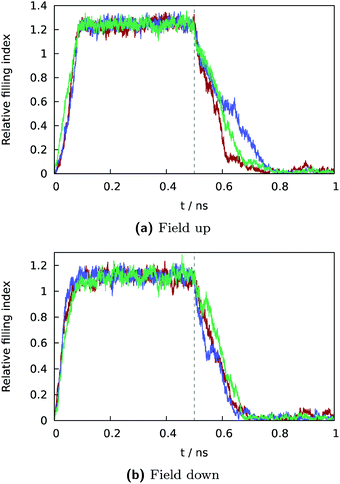
While substantial computational costs precluded simulations for increased surface dimensions, the expected behavior of an extended superhydrophobic surface can be estimated from the simulated properties of the central grooves. Filling probabilities shown in Fig. 7b exclude the contributions from the grooves at the edges of the surface where the applied field (eqn (1)–(3)) is weaker than in the region above the central section. Comparison of the threshold fields for the formation of the Wenzel state in the central region (Fig. 7b) with the result for the entire surface (left panel of Fig. 6) shows the Wenzel state in the central region to occur at just about 5% weaker field than necessary to observe the transition over the entire model surface (Fig. 6). The results shown in Fig. 7 suggest that, for the corrugation topology used in this study, the negative (downward) field of strength of no more than Eeffz ∼ (2.7 ± 0.1) × 10−3 V Å−1 should suffice to trigger the Cassie-to-Wenzel state transition on experimentally relevant surfaces with macroscopic lateral dimensions. As long as the surface and applied field are uniform, essentially identical average transition rates should apply at any location on the entire surface. Increasing the size of the surface can slightly accelerate the overall dewetting transition as a bigger area provides more opportunities for initial vapor-nucleation events11,13 that can stimulate the process in adjacent wells. In general, dynamic responses on a macroscopic surface should occur at timescales at least as fast as observed in finite-size model calculations.4 Concluding remarks
Computational modeling of electrowetting on a textured surface manifests the possibility of reversible cycling between the Cassie and Wenzel states on a superhydrophobic surface with nanoscale corrugations. Nanosized wells capable of spontaneous expulsion of water in the absence of an external field can be brought to the Wenzel state by the application of experimentally achievable electric fields and the changes between the two states can occur below nanosecond timescales in both directions. The minimal field strength required to induce the Cassie-to-Wenzel state transition shows considerable dependence on field polarity. While the incoming field (pointing from the surface to water) produces more compact groove filling, the threshold field strength securing the transition is smaller in the field pointing toward the solid phase. The hysteresis of the wetting/expulsion cycle reflects a kinetic barrier to expulsion from surface wells and a shallower barrier is indicated to slow groove wetting primarily in the incoming field. The findings can assist the design of tunable surfaces with large wettability amplitudes and essentially instantaneous response. Tunable superhydrophobic coating can also be used to control the permeability of nanochannels in nanofluidics,59,60e.g., in miniature lab-on-chip devices under electric control.Conflicts of interest
There are no conflicts to declare.Acknowledgements
We thank the National Science Foundation for support (award CHE-1800120) and the Extreme Science and Engineering Discovery Environment (XSEDE), funded by NSF Grant No. OCI-1053575, and the National Energy Research Scientific Computing Center (NERSC), funded by the Office of Science of the U.S. Department of Energy (No. DEAC02-05CH11231) for supercomputing time allocations.References
- B. Shapiro, H. Moon, R. L. Garrell and C. J. Kim, Equilibrium behavior of sessile drops under surface tension, applied external fields, and material variations, J. Appl. Phys., 2003, 93, 5794–5811 CrossRef CAS.
- F. Mugele and J. C. Baret, Electrowetting: from basics to applications, J. Phys. Condens. Matter, 2005, 17, R705–R774 CrossRef CAS.
- M. S. Dhindsa, N. R. Smith, J. Heikenfeld, P. D. Rack, J. D. Fowlkes, M. J. Doktycz, A. V. Melechko and M. L. Simpson, Reversible electrowetting of vertically aligned superhydrophobic carbon nanofibers, Langmuir, 2006, 22, 9030–9034 CrossRef CAS PubMed.
- J. Heikenfeld and M. Dhindsa, Electrowetting on superhydrophobic surfaces: present status and prospects, J. Adhesion Sci. Technol., 2008, 22, 319–334 CrossRef CAS.
- J. Bico, U. Thiele and D. Quere, Wetting of textured surfaces, Colloids Surf., A, 2002, 206, 41–46 CrossRef CAS.
- M. Ramiasa, J. Ralston, R. Fetzer and R. Sedev, The influence of topography on dynamic wetting, Adv. Colloid Interface Sci., 2014, 206, 275–293 CrossRef CAS PubMed.
- S. Manakasettharn, J. A. Taylor and T. Krupenkin, Superhydrophobicity at Micron and Submicron Scale, Comprehensive Nanoscience and Technology, Nanofabrication and Devices, 2011, 4, 383–411 Search PubMed.
- C. D. Daub, J. H. Wang, S. Kudesia, D. Bratko and A. Luzar, The influence of molecular-scale roughness on the surface spreading of an aqueous nanodrop, Faraday Discuss., 2010, 146, 67–77 RSC.
- S. Prakash, E. Xi and A. J. Patel, Spontaneous recovery of superhydrophobicity on nanotextured surfaces, Proc. Natl. Acad. Sci. U. S. A., 2016, 113, 5508–5513 CrossRef CAS PubMed.
- T. Verho, J. T. Korhonen, L. Sainiemi, V. Jokinen, C. Bower, K. Franze, S. Franssila, P. Andrew, O. Ikkala and R. H. A. Ras, Reversible switching between superhydrophobic states on a hierarchically structured surface, Proc. Natl. Acad. Sci. U. S. A., 2012, 109, 10210–10213 CrossRef CAS PubMed.
- K. Leung, A. Luzar and D. Bratko, Dynamics of capillary drying in water, Phys. Rev. Lett., 2003, 90, 065502 CrossRef PubMed.
- S. Sharma and P. G. Debenedetti, Free Energy Barriers to Evaporation of Water in Hydrophobic Confinement, J. Phys. Chem. B, 2012, 116, 13282–13289 CrossRef CAS PubMed.
- K. Leung and A. Luzar, Dynamics of capillary evaporation. II. Free energy barriers, J. Chem. Phys., 2000, 113, 5845–5852 CrossRef CAS.
- D. Bratko, R. A. Curtis, H. W. Blanch and J. M. Prausnitz, Interaction between hydrophobic surfaces with metastable intervening liquid, J. Chem. Phys., 2001, 115, 3873–3877 CrossRef CAS.
- K. Lum and D. Chandler, Phase diagram and free energies of vapor films and tubes for a confined fluid, Int. J. Thermophys., 1998, 19, 845–855 CrossRef CAS.
- F. Mugele, Electrical switching of wetting states on superhydrophobic surfaces: a route towards reversible Cassie-to-Wenzel transitions, Phys. Rev. Lett., 2011, 106, 014501 CrossRef PubMed.
- D. Vanzo, D. Bratko and A. Luzar, Dynamic Control of Nanopore Wetting in Water and Saline Solutions under an Electric Field, J. Phys. Chem. B, 2015, 119, 8890–8899 CrossRef CAS PubMed.
- D. Bratko, C. D. Daub, K. Leung and A. Luzar, Effect of field direction on electrowetting in a nanopore, J. Am. Chem. Soc., 2007, 129, 2504–2510 CrossRef CAS PubMed.
- C. D. Daub, D. Bratko, K. Leung and A. Luzar, Electrowetting at the nanoscale, J. Phys. Chem. C, 2007, 111, 505–509 CrossRef CAS.
- I. C. Yeh and M. L. Berkowitz, Ewald summation for systems with slab geometry, J. Chem. Phys., 1999, 111, 3155–3162 CrossRef CAS.
- P. G. Bolhuis and D. Chandler, Transition path sampling of cavitation between molecular scale solvophobic surfaces, J. Chem. Phys., 2000, 113, 8154–8160 CrossRef CAS.
- Y. J. Lei and Y. S. Leng, Hydrophobic Drying and Hysteresis at Different Length Scales by Molecular Dynamics Simulations, Langmuir, 2012, 28, 3152–3158 CrossRef CAS PubMed.
- D. Vanzo, D. Bratko and A. Luzar, Nanoconfined water under electric field at constant chemical potential undergoes electrostriction, J. Chem. Phys., 2014, 140, 074710 CrossRef PubMed.
- S. Plimpton, Fast Parallel Algorithms for Short-Range Molecular-Dynamics, J. Comput. Phys., 1995, 117, 1–19 CrossRef CAS.
- P. G. Kusalik and I. M. Svishchev, The spatial structure in liquid water, Science, 1994, 265, 1219–1221 CrossRef CAS PubMed.
- F. Moucka, D. Bratko and A. Luzar, Salt and Water Uptake in Nanoconfinement under Applied Electric Field: An Open Ensemble Monte Carlo Study, J. Phys. Chem. C, 2015, 119, 20416–20425 CrossRef CAS.
- D. Bratko, C. D. Daub and A. Luzar, Field-exposed water in a nanopore: liquid or vapour?, Phys. Chem. Chem. Phys., 2008, 10, 6807–6813 RSC.
- M. Shafiei, N. Ojaghlou, S. G. Zamfir, D. Bratko and A. Luzar, Modulation of structure and dynamics of water under alternating electric field and the role of hydrogen bonding, Mol. Phys., 2019, 117, 3282–3296 CrossRef CAS.
- J. R. Choudhuri, D. Vanzo, P. A. Madden, M. Salanne, D. Bratko and A. Luzar, Dynamic Response in Nanoelectrowetting on a Dielectric, ACS Nano, 2016, 10, 8536–8544 CrossRef CAS PubMed.
- N. Ojaghlou, H. V. Tafreshi, D. Bratko and A. Luzar, Dynamical insights into the mechanism of a droplet detachment from a fiber, Soft Matter, 2018, 14, 8924–8934 RSC.
- Q. Z. Yuan and Y. P. Zhao, Statics and dynamics of electrowetting on pillar-arrayed surfaces at the nanoscale, Nanoscale, 2015, 7, 2561–2567 RSC.
- M. Shafiei, M. von Domaros, D. Bratko and A. Luzar, Anisotropic structure and dynamics of water under static electric fields, J. Chem. Phys., 2019, 150, 074505 CrossRef PubMed.
- X. He, B. X. Zhang, S. L. Wang, Y. F. Wang, Y. R. Yang, X. D. Wang and D. J. Lee, Electrowetting-based control of wetting transition of a nanodroplet on pillar-arrayed surfaces, J. Mol. Liq., 2021 DOI:10.1016/j.molliq.2021.117049.
- S. Khan and J. K. Singh, Wetting transition of nanodroplets of water on textured surfaces: a molecular dynamics study, Mol. Simul., 2014, 40, 458–468 CrossRef CAS.
- M. von Domaros, D. Bratko, B. Kirchner and A. Luzar, Dynamics at a Janus Interface, J. Phys. Chem. C, 2013, 117, 4561–4567 CrossRef CAS.
- S. Chatterjee, I. Kumar, K. C. Ghanta, A. Hens and G. Biswas, Insight into molecular rearrangement of a sessile ionic nanodroplet with applied electric field, Chem. Eng. Sci., 2022, 247, 117083 CrossRef CAS.
- C. D. Daub, N. M. Cann, D. Bratko and A. Luzar, Electrokinetic flow of an aqueous electrolyte in amorphous silica nanotubes, Phys. Chem. Chem. Phys., 2018, 20, 27838–27848 RSC.
- H. J. C. Berendsen, J. R. Grigera and T. P. Straatsma, The Missing Term in Effective Pair Potentials, J. Phys. Chem., 1987, 91, 6269–6271 CrossRef CAS.
- A. Schlaich, E. W. Knapp and R. R. Netz, Water Dielectric Effects in Planar Confinement, Phys. Rev. Lett., 2016, 117, 048001 CrossRef PubMed.
- S. Gekle and R. R. Netz, Anisotropy in the dielectric spectrum of hydration water and its relation to water dynamics, J. Chem. Phys., 2012, 137, 104704 CrossRef PubMed.
- T. Werder, J. H. Walther, R. L. Jaffe, T. Halicioglu and P. Koumoutsakos, On the water-carbon interaction for use in molecular dynamics simulations of graphite and carbon nanotubes, J. Phys. Chem. B, 2003, 107, 1345–1352 CrossRef CAS.
- J. Driskill, D. Vanzo, D. Bratko and A. Luzar, Wetting transparency of graphene in water, J. Chem. Phys., 2014, 141, 18C517 CrossRef PubMed.
- N. Ojaghlou, D. Bratko, M. Salanne, M. Shafiei and A. Luzar, Solvent-Solvent Correlations across Graphene: The Effect of Image Charges, ACS Nano, 2020, 14, 7987–7998 CrossRef CAS PubMed.
- M. P. Allen and D. J. Tildesley, Computer Simulation of Liquids, Oxford University Press, New York, 2nd edn, 2017 Search PubMed.
- D. Vanzo, D. Bratko and A. Luzar, Pressure and electric field induced superhydrophobic transitions: reversibility and dynamics, Abstr. Pap., Jt. Conf. - Chem. Inst. Can. Am. Chem. Soc., 2014, 248, 71-COLL Search PubMed.
- J. Y. Yan, S. D. Overduin and G. N. Patey, Understanding electrofreezing in water simulations, J. Chem. Phys., 2014, 141, 074501 CrossRef CAS PubMed.
- M. A. Saitta, F. Saija and P. Giaquinta, Ab initio molecular dynamics study of dissociation of water under an electric field, Phys. Rev. Lett., 2012, 108, 207801 CrossRef PubMed.
- J. Dzubiella and J. P. Hansen, Electric-field-controlled water and ion permeation of a hydrophobic nanopore, J. Chem. Phys., 2005, 122, 234706 CrossRef CAS PubMed.
- D. Bratko, H. L. Friedman, S. H. Chen and L. Blum, Interpretation of Intermicellar Structure Factors in Hypernetted Chain/Percus-Yevick Approximation, Phys. Rev. A, 1986, 34, 2215–2219 CrossRef CAS PubMed.
- D. Bratko, C. E. Woodward and A. Luzar, Charge Fluctuation in Reverse Micelles, J. Chem. Phys., 1991, 95, 5318–5326 CrossRef CAS.
- D. Bratko and D. Dolar, Ellipsoidal Model of Poly-Electrolyte Solutions, J. Chem. Phys., 1984, 80, 5782–5789 CrossRef CAS.
- A. Philippsen, W. P. Im, A. Engel, T. Schirmer, B. Roux and D. J. Muller, Imaging the electrostatic potential of transmembrane channels: atomic probe microscopy of OmpF porin, Biophys. J., 2002, 82, 1667–1676 CrossRef CAS PubMed.
- C. R. Song and P. S. Wang, High electric field effects on gigahertz dielectric properties of water measured with microwave microfluidic devices, Rev. Sci. Instrum., 2010, 81, 054702 CrossRef PubMed.
- J. C. Shelley and G. N. Patey, Boundary condition effects in simulations of water confined between planar walls, Mol. Phys., 1996, 88, 385–398 CrossRef CAS.
- J. A. Martinez-Gonzalez, N. J. English and A. A. Gowen, Molecular simulation of water adsorption on hydrophilic and hydrophobic surfaces of silicon: IR-spectral explorations, Mol. Simul., 2021, 47, 666–673 CrossRef CAS.
- Z. Futera and N. J. English, Electric-Field Effects on Adsorbed-Water Structural and Dynamical Properties at Rutile- and Anatase-TiO2 Surfaces, J. Phys. Chem. C, 2016, 120, 19603–19612 CrossRef CAS.
- D. Bratko, A. Striolo, J. Z. Wu, H. W. Blanch and J. M. Prausnitz, Orientation-Averaged Pair Potentials between Dipolar Proteins or Colloids, J. Phys. Chem. B, 2002, 106, 2714–2720 CrossRef CAS.
- S. Gupta, A. Irback, B. Petersson, R. V. Gavai and F. Karsch, The Correlation Lengths and the order of the Phase Transition in 3-Dimensional Z-3 Symmetric Models, Nucl. Phys. B, 1990, 329, 263–284 CrossRef.
- M. R. Powell, L. Cleary, M. Davenport, K. J. Shea and Z. S. Siwy, Electric-field-induced wetting and dewetting in single hydrophobic nanopores, Nat. Nanotechnol., 2011, 6, 798–802 CrossRef CAS PubMed.
- S. N. Smirnov, I. V. Vlassiouk and N. V. Lavrik, Voltage-Gated Hydrophobic Nanopores, ACS Nano, 2011, 5, 7453–7461 CrossRef CAS PubMed.
Footnote |
| † Deceased March 5, 2019. |
| This journal is © the Owner Societies 2021 |


