
 Open Access Article
 This Open Access Article is licensed under a
 Creative Commons Attribution 3.0 Unported Licence
Simultaneous neutron powder diffraction and microwave characterisation at elevated temperatures†
Michael
Barter
 *a,
Gemma
Smith
b,
Sihai
Yang
b,
Martin
Schröder
b,
Martin Owen
Jones
cd and
Adrian
Porch
a
*a,
Gemma
Smith
b,
Sihai
Yang
b,
Martin
Schröder
b,
Martin Owen
Jones
cd and
Adrian
Porch
a
aCentre for High Frequency Engineering, School of Engineering, Cardiff University, Wales, UK. E-mail: BarterM@Cardiff.ac.uk
bSchool of Chemistry, University of Manchester, Manchester, UK
cSTFC Rutherford Appleton Laboratory, Harwell Oxford, Didcot, UK
dUniversity of St Andrews, St Andrews, Fife, UK
First published on 8th October 2021
Abstract
The use of simultaneous neutron powder diffraction (NPD) and microwave characterisation can provide more information than the use of either technique individually; for example, it enables the differentiation of physisorbed and metal-coordinated species. Many possible experiments using these combined techniques can benefit from the addition of a heat source for sample heating, such as real-time measurements of solvent removal, or chemical and catalytic reactions. This paper documents the design of equipment to conduct simultaneous NPD and 2.5 GHz microwave cavity resonance techniques at elevated temperatures and confirms the use of this equipment for successful desolvation of a metal–organic framework (MOF) sample at 150 °C. The high sensitivity of microwave characterisation of lossy and polar materials is demonstrated at levels much lower than those that can be detected using crystallographic techniques.
1 Introduction
The microwave cavity perturbation technique has been used extensively to assess the in situ dielectric properties of materials in a non-invasive way.1–4 Using this technique simultaneously with neutron powder diffraction (NPD) allows the monitoring of both the dielectric and structural properties of the material, and thus establishes a correlation between them. These combined complimentary techniques have been shown to provide additional information not available from the use of these techniques individually. Such methods have been successfully used to investigate a range of samples, from simple compounds such as metal salts,5,6 to complex systems such as metal–organic frameworks (MOFs).7MOFs are a class of porous crystalline materials which have been investigated for a range of applications including storage of alternative fuels,8–11 gas separations,12–14 chemical sensing,15–17 and catalysis.18–20 In order to create void spaces required for sorption-based applications, adsorbed molecules, such as solvents from the synthesis and water from air, must be removed from the pores of the material. This desolvation procedure is typically achieved at elevated temperatures, either under vacuum or in an inert gas flow. The instrumentation described in this work allows for in situ desolvation of the MOF sample via removal of solvent from within the pores at elevated temperatures, as well as acceleration of experimental desorption processes. These processes can be monitored in real time by continuous measurement of microwave data.
To date, all reported experiments with the simultaneous use of a microwave cavity resonator (MCR) and NPD have been conducted at ambient temperatures.5,7 In addition to the benefits of in situ solvent removal to avoid complex handling methods of air/water-sensitive samples, the scope of experiments applicable for MCR-NPD studies will be vastly widened by the addition of a heat source to control the sample temperature. These may include the investigation of catalytic reactions, thermal properties of materials (including phase changes and decomposition mechanisms), adsorption/desorption processes, and thermodynamic studies. Here we report the design and testing of instrumentation for experimental equipment in order to carry out simultaneous MCR and NPD measurements at elevated temperatures. The equipment has been tested by activating a MOF sample in situ. The material used in this experiment, MFM-170 (MFM = Manchester Framework Material), is a highly chemically and thermally stable copper(II) MOF comprising of [Cu2(O2CR)4] paddlewheel nodes bridged by carboxylate ligands.12
2 Experiment design
The microwave cavity designed for these experiments was made to resonate at 2.5 GHz when empty in the TM010 mode, with a cavity diameter of 90 mm. The cylindrical cavity side wall was thinned to a thickness of 1 mm to maximise the resolution of Bragg data, by minimising neutron scattering by the sample environment. A cavity height of 26 mm was selected. This accommodates the neutron beam at a height of 20 mm and allows 3 mm either side to the top and bottom plates of the cavity. This radius was introduced in the machining process. Minimising the height of the cavity allows the heating coils to be placed as close as possible to the sample, thus ensuring the sample temperature is maintained as close to the measured temperature as possible. The sample tube hole through the central axis of the cavity has a diameter of 16 mm to allow room for the sample tube, with outer diameter of 12 mm. The thickness of the top and bottom plates of the cavity are 8 mm, which is small enough to allow heating coils to be placed close to the sample, but large enough to minimise radiative microwave losses from the cavity. Capacitive coupling in the form of SMA coupling antennas is used to excite the electric field of the TM010 mode, as shown in Fig. 1. The cavity is constructed from aluminium due to its high electrical conductivity (3.77e7 S/m),21 which delivers not only a high cavity Q factor, but also a minimal total bound scattering cross section (1.503 b).22 Reducing the length of the cavity compromises its Q factor but, for the geometry used here, Q is measured to be 7400 for the empty cavity, which is high enough to provide a sensitive measurement of the dielectric properties of the sample. | ||
| Fig. 1 (a) Render of microwave cavity, quartz tube and heating coils. (b) Schematic diagram of the microwave cavity showing the electric field of the TM010 mode, sample in quartz tube, SMA connectors with antenna coupling, and locations of the top and bottom heating coils, with associated thermocouples in relation to the cavity and sample. | ||
The microwave cavity has been built into a rig which holds the cavity, quartz sample tube and gas fixtures in place. This rig is constructed to be placed in the sample chamber of the POLARIS NPD instrument (ISIS Neutron and Muon source, UK) which has a maximum d-spacing of approximately 40 Å.23 This rig is also used to locate the thinned section of the microwave cavity in line with the neutron beam, thus minimising the amount of scattering from the cavity. This sample environment, including quartz tube, provides very little interference, apart from a small increase in background and very small individual Bragg peaks associated with the thinned Al wall of the cavity. The microwave cavity was connected via RF (Radio Frequency) cables, capable of operating under vacuum and at temperatures up to 200 °C, to a vector network analyser (Copper Mountain S5085). The power transmission coefficient |S21|2 was measured in the frequency domain and non-linear, least-squares curve fitting to a Lorentzian response was used to determine resonant frequencies, Q factors, insertion losses and resonant bandwidths. Microwave data were recorded every 2 seconds, and NPD data were collected every 2 minutes – the fastest possible rate at POLARIS. This maximised the capture of changes in structure during the adsorption/desorption processes, but still allows adequate NPD signal-to-noise ratio for monitoring changes. The schematic diagram showing the experimental setup is shown in Fig. 2.
 | ||
| Fig. 2 Schematic diagram of the simultaneous neutron diffraction and microwave measurement setup with variable temperature, showing neutron beam, gas lines and measurement apparatus.24. | ||
The cavity was suspended using 4 steel rods, connected via ceramic bolts to minimise heat transfer. The dimensions of this rig are designed such that the neutron beam can pass through the thinned wall section of microwave cavity, when used at the POLARIS instrument.
A heating coil located inside the quartz tube is used to heat the sample indirectly by thermal contact with the inlet gas stream, as shown in Fig. 1. The temperature of this top coil is monitored by a thermocouple located at the central axis of the quartz tube and as close to the sample as possible, without entering the microwave cavity. This configuration minimises the material in the path of the neutron beam, whilst retaining good temperature control and accuracy. A second heating coil, located below the sample and outside the narrower section of the quartz tube, is used predominantly to limit the temperature gradient rather than to heat the sample. The thermocouple for this heating coil is located on the outer wall of the cavity in a small gap between the cavity and coil. The heating coils are controlled by temperature controllers using the temperatures read from the thermocouples. Finally, a platinum thermometer is secured to the top plate of the microwave cavity to monitor cavity temperature.
During sample heating, the temperature of the microwave cavity, coupling ports and cables also increase which can lead to problems during measurement. A change in cavity temperature changes the resonant frequency of the cavity, which can be accounted for using temperature correction techniques.25 Heat transfer from the quartz tube to the cavity and connections is limited in this setup as there is no physical contact, and therefore no heat conduction. Also, the experimental rig is used in a vacuum in the instrument sample tank so there is no convection. This means that the cavity will only heat through radiation, leading to minimal heat transfer into the cavity. This heat transfer was modelled using COMSOL Multiphysics and can be seen in Fig. 3. This shows the cavity temperature reaching a maximum of under 40 °C after 10 hours, despite the 150 °C quartz tube inserted through it. The cavity temperature is constant throughout the material owing to its high thermal conductivity.
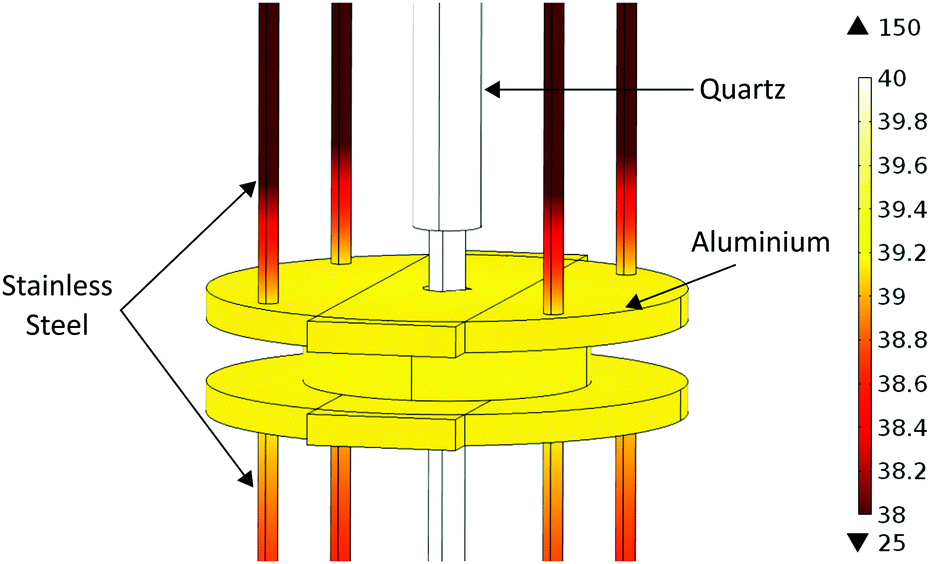 | ||
| Fig. 3 COMSOL simulation of the temperature distribution throughout the microwave cavity, quartz tube and supports at maximum temperature of 150 °C after 10 hours. Temperature across the cavity is constant at below 40 °C. | ||
MFM-170 has recently been reported as a promising adsorbent of sulfur dioxide and was chosen as the test material in this study due to its high porosity (pore volume = 0.87 cm3 g−1 and BET surface area = 2408 m2 g−1) and exceptional chemical stability.12 This MOF is constructed from copper(II) [Cu2(O2CR)4] paddlewheel nodes and pyridyl-containing tetracarboxylate linkers which assemble into a cubic structure (space group = lm![[3 with combining macron]](https://www.rsc.org/images/entities/char_0033_0304.gif) m, a = 33.609(2) Å). Here, MFM-170 was prepared as a bulk powder according to the reported procedure and acetone exchanged to remove DMF molecules from the pores. The solvated structure contains one coordinated water molecule per paddlewheel (i.e. 1
m, a = 33.609(2) Å). Here, MFM-170 was prepared as a bulk powder according to the reported procedure and acetone exchanged to remove DMF molecules from the pores. The solvated structure contains one coordinated water molecule per paddlewheel (i.e. 1![[thin space (1/6-em)]](https://www.rsc.org/images/entities/char_2009.gif) :2 H2O/Cu; formula excluding pore solvents is [Cu2(C33H17NO8)(H2O)]), and this coordinated water can be removed by heating the sample under vacuum or in an inert gas flow.
:2 H2O/Cu; formula excluding pore solvents is [Cu2(C33H17NO8)(H2O)]), and this coordinated water can be removed by heating the sample under vacuum or in an inert gas flow.
3 Results
The results in this section are presented to demonstrate the effectiveness of the equipment to perform simultaneous NPD and microwave characterisation at elevated temperatures. To test the capability of the equipment designed in Section II on the POLARIS instrument, an as-synthesised MFM-170 sample was heated to remove the water and solvents in the pores. This experiment is documented in 5 sections, Sections A–E. Section A is the setup of gas flow rate and heating equipment. The experiment began with the sample under vacuum before a flow of N2 of approximately 10 ml min−1 was introduced. As mass flowmeters were not available for this experiment, gas flow rates were estimated by volumetric displacement methods. The gas pressure required to achieve the desired flow rate was recorded and used to set flow rates for this experiment. PID values for temperature controllers were set in this section with a setpoint of 60 °C. Section B involves the desolvation of the MOF sample. The temperature of the heating coils was raised to 150 °C to desolvate the MOF, and the flow of N2 at 150 °C continued until the MOF was fully desolvated. The sample was held under a dynamic vacuum in Section C to ensure the sample was, and remained, fully desolvated. The vacuum pump was connected to the gas line at the bottom of the sample, so as to cause as little disturbance of the sample as possible. The sample was rehydrated during Section D, which was achieved by using a pump to flow humid air through the sample. Section E is the second desolvation of the sample, and for this, the flow rate is increased to approximately 40 ml min−1. The heating coils were set to 150 °C once again for desolvation and were able to achieve and maintain this temperature with this more rapid N2 gas flow.3.1 Temperature
The temperatures of the top heating coil, bottom heating coil, and microwave cavity during this experiment are shown in Fig. 4. During Section A (Fig. 4), the heating coils were set to 60 °C to ensure PID values of the temperature controllers were correct. The temperature of the top heating coil stabilised within 15 minutes; however, the temperature of the bottom coil initially fluctuated by approximately 20 °C, thus PID values for the bottom coil were altered to correct for this. Once PID values had been optimised the temperature of both coils stabilised within 20 minutes. The PID values used can be seen in Table S1 (ESI†), and the values given should be used as representative values as subtle changes in sample environment would require changes to these values. | ||
| Fig. 4 Temperature measurements from the centre of the top heating coil (inside the quartz tube), directly above the bottom heating coil (outside the quartz tube), and the cavity (affixed to the top plate).24 | ||
In Section B the heating coils are set to 150 °C in order to remove both coordinated water and solvent from the pores of the molecules from the MOF. This temperature was maintained for approximately 18 hours. The cavity temperature increased to a maximum temperature of 53 °C after approximately 12 hours. It is possible to cool the cavity using active cooling, as demonstrated by Dietrich et al.3 For this experiment, no additional cooling was required due to the maximum temperature reached by the cavity not exceeding the operating temperatures of the chosen equipment.
During Section C the sample was exposed to a dynamic vacuum to ensure the sample is fully desolvated. No heating from the top coil for this section was applied as the top coil did not have enough thermal load while in a vacuum. The bottom coil, which has thermal contact with the quartz tube, was heated to 100 °C to maximise solvent desorption from the MOF. The small rise in temperature measured by the top coil thermocouple reflected the increase in temperature of the apparatus. Once it was confirmed that the MOF was fully desolvated, as indicated by a plateau in frequency shift and unchanging Bragg reflections, the cavity and sample were left to cool. The sample was rehydrated in Section D by passing humid air through the sample, which readily adsorbs the water vapour present. The heating coils are switched off for the duration of the rehydration process. Temperatures measured by both thermocouples for the heating coils and the cavity were maintained at 20–25 °C during this period.
Section E repeats the desolvation of the rehydrated MFM-170 sample, this time using a faster N2 flow rate of 40 ml min−1 to increase the rate of desorption. With this flow rate, the heating coils reach their set point of 150 °C in under 15 minutes. Due to the reduced heating time compared to Section B, the cavity temperature did not plateau and reached a maximum of 40 °C. After complete desorption of guest molecules, the system was allowed to cool to ambient temperature.
3.2 Dielectric response
The dielectric response of a substance as water is released, is expected to show a change in both frequency and Q factor. The high polarity and associated dielectric loss of water will cause an increase in fractional frequency shift and a decrease in inverse Q factor, respectively, as water is removed from the sample.In this work, changes in dielectric parameters are plotted as Δf/f and Δ(1/Q). As the electric field is parallel to the sample and the sample is small in comparison to the cavity volume, the full perturbation equations26 simplify to the following, where the powdered sample is assumed to be a bulk sample:
 | (1) |
 | (2) |
:1. When observing changes in Δf/f and Δ(1/Q) during adsorption or desorption of water from a sample, it would be expected for there to be a four times larger shift in the Δf/f response than the Δ(1/Q) response. Alternatively, loss tangent analysis can be performed by plotting ε1/ε2 and is shown in Fig. 5b, where the relationship of real and imaginary permittivity can be observed. Plotting changes in fractional frequency and inverse Q factor in this way can show more information about the sample, and its changes, in real and imaginary permittivity than plotting changes in raw frequency and Q factor, as we can use this information to infer the polar species being exchanged during the cavity perturbation. This ratio of changes of fractional frequency and inverse Q factor is independent of volume.
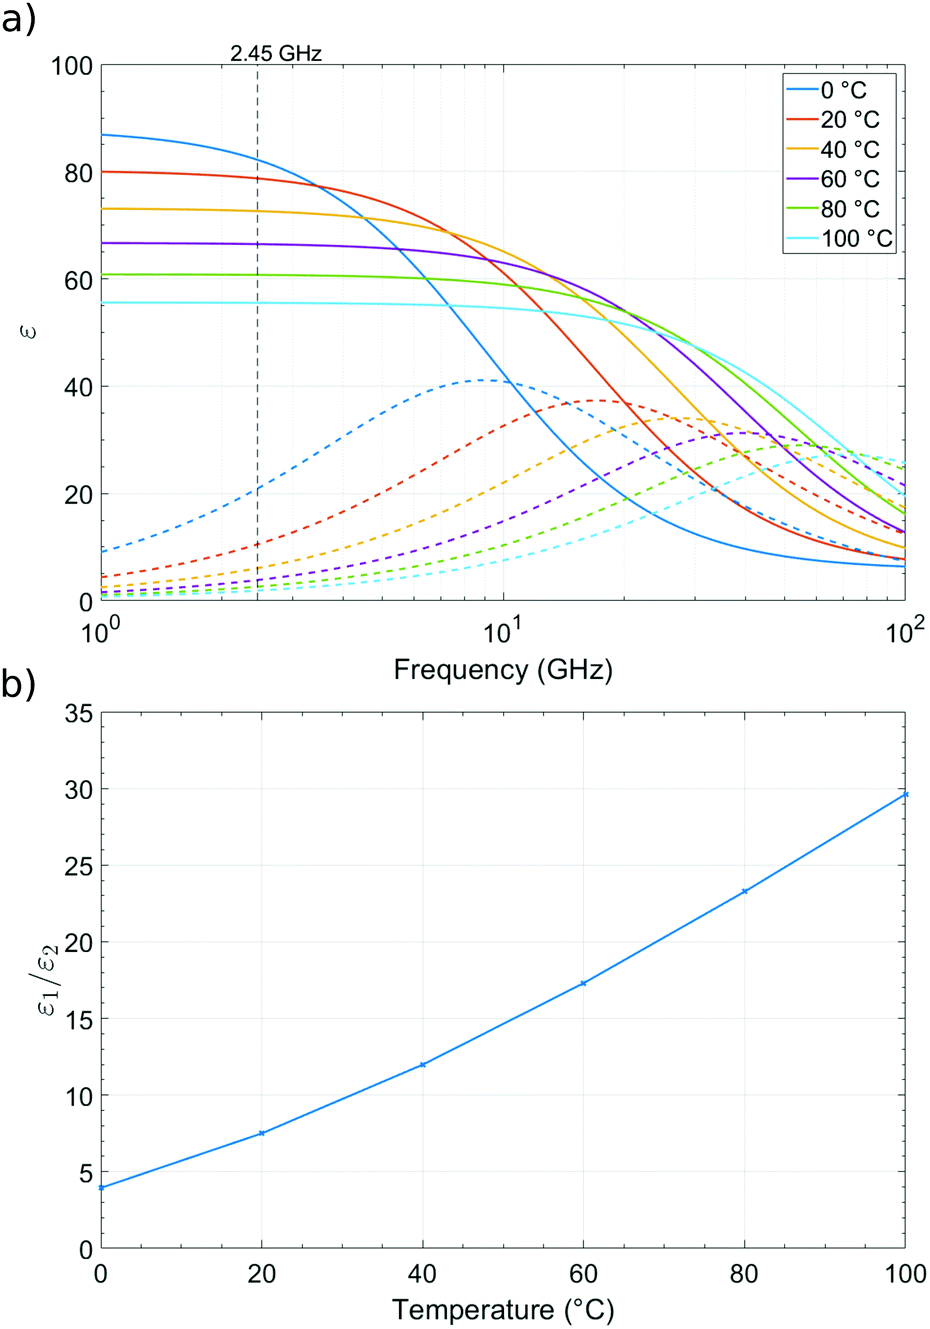 | ||
| Fig. 5 (a) Real (ε1 solid lines) and imaginary (ε2 dotted lines) parts of the complex permittivity of water at 0 °C, 20 °C, 40 °C, 60 °C, 80 °C, and 100 °C as a function of frequency, data from Kaatze.27 (b) ε1/ε2vs. temperature at 2.45 GHz. | ||
With the absorption or desorption of another solvent, such as acetone, the dielectric ratio would be different to that with water. The ratio is significantly higher for acetone compared to water owing to its smaller relative microwave loss, at 20 °C giving a ratio of approximately 20:1 as opposed to 4:1 for water.28 If the ambient temperature changes, then the lack of reliable complex dielectric data as a function of temperature in the published literature makes a precise quantitative analysis impossible. We also note that the dielectric properties of bound and free solvents molecules will differ, and again there is a lack of quantitative data in the literature on these different species. However, we can still strongly rely on our concept of the dielectric ratio as a semi-quantitative guide for understanding the polar solvents exchanged with the sample, particularly for water, which is a major factor in the measurements presented.
The dielectric response of the system is shown in Fig. 6. At the start of Section A, the sample is under vacuum with no heating. As the sample was filtered from acetone, acetone is present on the surface of the materials as well as within the pores of the MOF. This surface solvent is not strongly bound to the MOF and readily evaporates at room temperature. This causes the fractional frequency to increase and dielectric loss to decrease before any heating is applied. Once the heating coils are set to 60 °C, between approximately 4 and 6 hours, more acetone and some weakly physisorbed water are removed from the system, consistent with TGA-MS collected ex situ (Fig. S3, ESI†). This caused a further decrease in polarisation and dielectric loss.
 | ||
| Fig. 6 Fractional frequency shift and inverse Q factor shift during desolvation of MFM-170 through heating, and rehydrating of the sample under N2 flow. Where A is the setup of heating coils and gas flow, B is the first desolvation of the MOF, C is under vacuum and cooling, D is the rehydration of the MOF, and E is the second desolvation.24 | ||
During Section B, the temperature was raised to 150 °C, resulting in an increase of the fractional frequency shift. This corresponds to a faster rate of desorption of both physisosorbed and metal-coordinated water molecules. At ca. 7 hours, the change in gradient for the frequency shift is likely caused by the different rates of removal of acetone, physisorbed water, and coordinated water molecules. Surprisingly, the dielectric loss initially increases from 5 × 10⁻³ to 9 × 10⁻³ at the start of Section B (time = 6–7.5 hours). This is not the expected response when a lossy substance, such as water, is removed from the sample. As the system is not yet under thermal equilibrium, and there are multiple solvents present in the sample, it is not possible to pinpoint the reason for this increase in dielectric loss. After 7.5 hours, dielectric loss began to decrease, as expected, and both polarity and dielectric loss plateau before the end of Section B. This suggests the sample has been fully desolvated.
At the start of Section C, there is a step change in the fractional frequency shift. This jump is caused by the switching on of a vacuum pump causing the sample to move physically and is not related to any change in dielectric properties. This is confirmed as the fractional frequency shift returns to its value before this jump when the vacuum pump was switched off. Dielectric loss also shows a smaller jump during this time. There is no change in dielectric properties whilst the sample is under vacuum during this section, confirming the sample was fully desolvated during Section B. This proves the effectiveness of the equipment to be used for in situ desolvation of this material.
The rehydration of the sample during Section D causes an increase in the polarity of the sample, as well as an increase in dielectric loss. The rehydration process by passing air through the sample took approximately 6 hours. As expected, final values for fractional frequency shift and inverse Q factor did not return to the values at the start of the experiment, due to the original sample also containing acetone. In addition, the amount of water adsorbed by the MOF in Section D is limited by the partial pressure of water vapour in the air. Therefore, the polarity and dielectric loss of the sample is much higher at the start of Section A than at the end of Section D.
Section E is the second desolvation of the MOF, where the temperature is set to 150 °C and the flow rate is 40 ml min−1. This increased flow rate causes the MOF desolvation to take less than 1 hour, confirmed by the fractional frequency shift and inverse Q factor shift values matching those of the first desolvation. After the first hour, the dielectric loss continued to subtly decrease. This is due to the cooling of the microwave cavity. The frequency response is not affected by this, as it has been temperature corrected.25 This latter correction cannot reliably be used to correct for changes in Q factor caused by changes in cavity temperature. For this second sample desolvation, the ratio of changes in Δf/f to Δ(1/Q) is approximately 8:1. As the sample was fully desolvated in Section B and rehydrated such that only water was present in the sample, this ratio of change in Δf/f to Δ(1/Q) is entirely due to the loss of water from the sample.
3.3 Structural properties
The Bragg diffraction patterns for MFM-170 are shown in Fig. 7. The Bragg peaks observed show no change in D spacing and that the material does not undergo a phase change on desolvation or re-solvation. This is the expected behaviour as MFM-170 has been shown to be stable to reversible adsorption/desorption of water.12 Furthermore, as this material has a rigid txt topology, no significant change in unit cell parameters are expected.12,29,30 Changes in relative peak intensities are observed throughout the experiment and are consistent with the inclusion or removal of ordered guest species within the pore. However, reliable refinements of guest molecule sites and occupancy were not possible here, due to the relatively low signal-to-noise ratio of the NPD data caused by the 2 minute runs for data collection.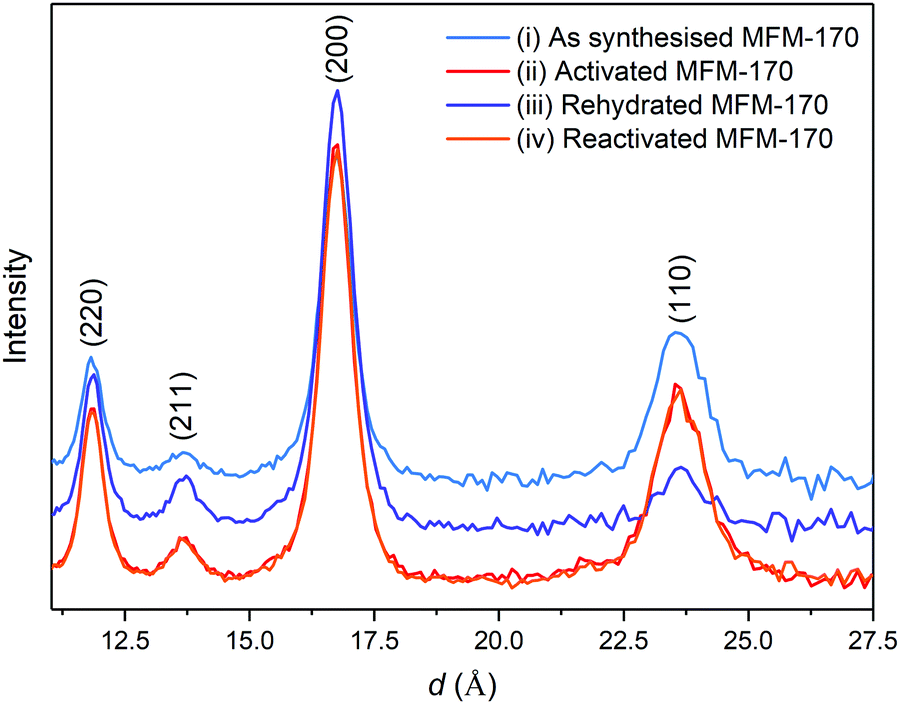 | ||
| Fig. 7 Summed NPD patterns (15 × 2 minute runs) for MFM-170 under various equilibrated conditions: (i) as synthesised, at the end of Section A (blue); (ii) desolvated under 10 ml min−1 N2 flow at 150 °C, at the end of Section B (red); (iii) rehydrated under a humid air flow, at the end of Section D (purple); and (iv) desolvated again under 40 ml min−1 N2 flow at 150 °C, at the end of Section E. The high background for (i) and (iii) is due to the presence of adsorbed water molecules. | ||
The diffraction pattern for the as-synthesised sample, Fig. 7(i), shows a high level of background scattering due to the high incoherent scattering of hydrogen (80.3 b) present in the water and solvent. As these guest molecules are removed from the material under a 10 ml min−1 flow of nitrogen with heating coils set to 150 °C, the background scattering is significantly reduced (Fig. 7(ii)). The changes in relative peak intensities are consistent with the removal of ordered solvent molecules. As the sample is rehydrated by passing air through the sample from the experiment hall, the levels of background scattering increased. This is shown in Fig. 7(iii) where the levels of background scattering are higher than the desolvated sample, but not as high as the as synthesised sample. This difference is attributed to the significant amount of solvent present on the surface of the material at the beginning of the experiment. As water was adsorbed, the intensities of the (110) and (200) reflections decrease and increase, respectively, indicating ordering of water molecules in the MOF. The Bragg data after the MOF was resolvated, shown in Fig. 7(iv), very closely matches that from the first MOF desolvation experiments.
Fig. 8 shows the dielectric data superimposed onto the time-resolved Bragg data. The white gaps in the data represent the time spent making changes to gas lines during the experiment, where the neutron beam had to be stopped. In Section A, there are considerable changes in dielectric properties before the sample is exposed to neutrons and high temperature nitrogen gas. This is likely due to volatile solvents being flushed from the sample. In Section B, after 5 hours, no further changes in Bragg diffraction were observed, suggesting that the MOF is desolvated in under 5 hours. Conversely, the dielectric data confirms that the MOF is not fully desolvated until at least 12 hours into the 150 °C N2 flow experiment. This demonstrated the high sensitivity of microwave characterisation to lossy and polar materials such as water, at levels much lower than those that can be detected with crystallographic techniques.
 | ||
| Fig. 8 Superimposition of the surface plot of Bragg diffraction and dielectric data during desolvation through heating, and rehydration of MFM-170 under N2 flow.24. | ||
Section C shows no changes in either dielectric or structural data. During Section D, the dielectric response shows a change in properties before there is a visible change in background scattering. There is less water present at the end of Section D than at the beginning of the experiment. This is reflected by the dielectric response, with the frequency and Q factor not returning to their original values. It is also shown in the Bragg data, as there was less background scattering and therefore a higher signal-to-noise ratio at the end of Section D. The second dehydration process (Section E) occurs multiple times faster than the first, indicated by the time taken for the dielectric data to plateau and the changes in NPD data to stabilise.
Differing experiments can be performed depending on how the sample environment is used. The experimental procedure used here is typical for more dynamic systems, faster data sets (maximum speed on POLARIS is 1 data set per 2 minutes) with inherently lower quality diffraction data. For very slow changing or static/frozen samples, long data sets can be obtained with high quality diffraction data.
4 Conclusion
Here we have reported the design and testing of a new system, which has allowed guest molecules to be desorbed from a porous material at elevated temperature during simultaneous microwave dielectric and structural characterisation. The microwave cavity used gave an adequate signal-to-noise ratio of neutron diffraction data, as well as having a suitably high Q factor for dielectric measurements. The desolvation process of the MOF has been shown to be effective and repeatable at 150 °C with gas flow rates of 10 and 40 ml min−1. These results demonstrate the ability of the equipment used to maintain high gas temperatures at various flow rates. The use of the microwave cavity resonance technique has been shown to be highly sensitive to the removal of water from the material, showing dielectric changes for some time after the changes in diffraction are visible. Temperature correction methods used on the frequency measurements ensure that all observed changes in frequency are associated with the sample, and not due to changes in cavity temperature. During this experiment, the heating equipment was used at a maximum temperature of 150 °C but has been tested up to 200 °C, with potential for even higher temperatures.The development of the instrumentation described here will permit a range of future experiments to be conducted with the need for in situ desolvation of materials under high temperature gas flows. Other possible uses for this equipment include investigation of elevated temperature catalytic processes, variable temperature measurements, and study of thermally-induced phase changes or decomposition mechanisms.
This work has shown the use of conventional heating to heat samples during measurement. It is, of course, possible to heat the sample using pulsed microwave heating using the TM010 mode to heat the sample using microwaves, while conducting dielectric characterisation. This is the subject of future work.
Conflicts of interest
There are no conflicts to declare.Acknowledgements
We thank the EPSRC (EP/I011870), and the European Research Council (ERC) under the European Union's Horizon 2020 research and innovation programme (grant agreement no. 742401, NANOCHEM). Information on the data underpinning the results presented here, including how to access them, can be found in the Cardiff University data catalogue at http://doi.org/10.17035/d.2021.0140099870.Notes and references
- L. Shihe, C. Akyel and R. Bosisio, IEEE Trans. Microwave Theory Tech., 1981, 29, 1041–1048 CrossRef.
- M. Lin, M. H. Duane and M. N. Afsar, IEEE Trans. Magn., 2006, 42, 2885–2887 Search PubMed.
- M. Dietrich, D. Rauch, U. Simon, A. Porch and R. Moos, J. Sens. Sens. Syst., 2015, 4, 263–269 CrossRef.
- M. Eichelbaum, R. Stößer, A. Karpov, C.-K. Dobner, F. Rosowski, A. Trunschke and R. Schlögl, Phys. Chem. Chem. Phys., 2012, 14, 1302–1312 RSC.
- M. O. Jones, J. Hartley and A. Porch, Phys. Chem. Chem. Phys., 2016, 18, 23340–23347 RSC.
- J. Hartley, A. Porch and M. Jones, Sens. Actuators, B, 2015, 210, 726–730 CrossRef CAS.
- M. Barter, J. Hartley, F.-J. Yazigi, R. J. Marshall, R. S. Forgan, A. Porch and M. O. Jones, Phys. Chem. Chem. Phys., 2018, 20, 10460–10469 RSC.
- S. S. Kaye, A. Dailly, O. M. Yaghi and J. R. Long, J. Am. Chem. Soc., 2007, 129, 14176–14177 CrossRef CAS PubMed.
- J. A. Mason, M. Veenstra and J. R. Long, Chem. Sci., 2014, 5, 32–51 RSC.
- H. G. W. Godfrey, I. da Silva, L. Briggs, J. H. Carter, C. G. Morris, M. Savage, T. L. Easun, P. Manuel, C. A. Murray, C. C. Tang, M. D. Frogley, G. Cinque, S. Yang and M. Schröder, Angew. Chem., Int. Ed., 2018, 57, 14778–14781 CrossRef CAS PubMed.
- J. Jiang, H. Furukawa, Y.-B. Zhang and O. M. Yaghi, J. Am. Chem. Soc., 2016, 138, 10244–10251 CrossRef CAS PubMed.
- G. L. Smith, J. E. Eyley, X. Han, X. Zhang, J. Li, N. M. Jacques, H. G. W. Godfrey, S. P. Argent, L. J. McCormick McPherson, S. J. Teat, Y. Cheng, M. D. Frogley, G. Cinque, S. J. Day, C. C. Tang, T. L. Easun, S. Rudić, A. J. Ramirez-Cuesta, S. Yang and M. Schröder, Nat. Mater., 2019, 1–8 Search PubMed.
- J. D. Humby, O. Benson, G. L. Smith, S. P. Argent, I. da Silva, Y. Cheng, S. Rudić, P. Manuel, M. D. Frogley, G. Cinque, L. K. Saunders, I. J. Vitórica-Yrezábal, G. F. S. Whitehead, T. L. Easun, W. Lewis, A. J. Blake, A. J. Ramirez-Cuesta, S. Yang and M. Schröder, Chem. Sci., 2019, 10, 1098–1106 RSC.
- P. Verma, X. Xu and D. G. Truhlar, J. Phys. Chem. C, 2013, 117, 12648–12660 CrossRef CAS.
- V. Chernikova, O. Yassine, O. Shekhah, M. Eddaoudi and K. N. Salama, J. Mater. Chem. A, 2018, 6, 5550–5554 RSC.
- Z. Hu, B. J. Deibert and J. Li, Chem. Soc. Rev., 2014, 43, 5815–5840 RSC.
- W. Li, X. Wu, N. Han, J. Chen, X. Qian, Y. Deng, W. Tang and Y. Chen, Sens. Actuators, B, 2016, 225, 158–166 CrossRef CAS.
- A. Herbst, A. Khutia and C. Janiak, Inorg. Chem., 2014, 53, 7319–7333 CrossRef CAS PubMed.
- X. Wang, J. Zhou, H. Fu, W. Li, X. Fan, G. Xin, J. Zheng and X. Li, J. Mater. Chem. A, 2014, 2, 14064–14070 RSC.
- A. Herbst and C. Janiak, CrystEngComm, 2017, 19, 4092–4117 RSC.
- R. Serway, Principles of physics, Saunders College pub, Fort Worth, 2nd edn, 1998 Search PubMed.
- V. F. Sears, Neutron News, 1992, 3, 26–37 CrossRef.
- R. I. Smith, S. Hull, M. G. Tucker, H. Y. Playford, D. J. McPhail, S. P. Waller and S. T. Norberg, Rev. Sci. Instrum., 2019, 90, 115101 CrossRef CAS PubMed.
- M. Barter, Investigating Simultaneous Microwave Dielectric and Structural Characterisation of Heterogeneous Gas Sorption Processes, PhD thesis, Cardiff University, 2019 Search PubMed.
- J. A. Cuenca, D. R. Slocombe and A. Porch, IEEE Trans. Microwave Theory Tech., 2017, 65, 2153–2161 Search PubMed.
- D. Pozar, Microwave Engineering, John Wiley & Sons, Inc., Hoboken, NJ, 2nd edn, 2005 Search PubMed.
- U. Kaatze, J. Chem. Eng. Data, 1989, 34, 371–374 CrossRef CAS.
- T. Shikata and N. Yoshida, J. Phys. Chem. A, 2012, 116, 4735–4744 CrossRef CAS PubMed.
- M. O'Keeffe, M. A. Peskov, S. J. Ramsden and O. M. Yaghi, Acc. Chem. Res., 2008, 41, 1782–1789 CrossRef PubMed.
- M. Li, D. Li, M. O'Keeffe and O. M. Yaghi, Chem. Rev., 2014, 114, 1343–1370 CrossRef CAS PubMed.
Footnote |
| † Electronic supplementary information (ESI) available. See DOI: 10.1039/d1cp03658k |
| This journal is © the Owner Societies 2021 |