
 Open Access Article
 This Open Access Article is licensed under a Creative Commons Attribution-Non Commercial 3.0 Unported Licence
Study of a phosphorescent cationic iridium(III) complex displaying a blue-shift in crystals†
Emiliano
Martínez-Vollbert
 a,
Christian
Philouze
a,
Isabelle
Gautier-Luneau
b,
Yohann
Moreau
c,
Pierre-Henri
Lanoë
*a and
Frédérique
Loiseau
*a
a,
Christian
Philouze
a,
Isabelle
Gautier-Luneau
b,
Yohann
Moreau
c,
Pierre-Henri
Lanoë
*a and
Frédérique
Loiseau
*a
aUniv. Grenoble Alpes, CNRS, DCM, 38000 Grenoble, France. E-mail: pierre-henri.lanoe@univ-grenoble-alpes.fr; Frederique.loiseau@univ-grenoble-alpes.fr
bUniv. Grenoble Alpes, CNRS, Grenoble INP, Institut Néel, 38000 Grenoble, France
cUniv. Grenoble Alpes, CEA, CNRS, IRIG, CBM, F-38000 Grenoble, France
First published on 13th October 2021
Abstract
We report the synthesis and the characterization of a new cationic iridium(III) complex featuring two 1-(p-methoxyphenyl)-5-methoxybenzimidazole cyclometallating ligands and a dimethylbipyridine ancillary ligand. The complex has been fully characterized by 1D and 2D NMR (1H, 13C, 19F and 31P), elemental analysis and high-resolution mass spectrometry (HRMS). The photoluminescence studies performed in a solution, on amorphous powder and on crystals revealed an unexpected behavior. Indeed, the emission spectra observed in both solution (CH2Cl2) and amorphous powder samples are centered at around 580 nm, whereas in crystals the emission displays a large hypsochromic shift of ∼800 cm−1 (λem = 558 nm). X-ray diffraction experiments, photophysical studies and DFT calculations allow for rationalizing the hypsochromic shift.
Introduction
Phosphorescent iridium(III) complexes have attracted intensive research since the beginning of the 21st century for a large number of applications such as emissive materials in optoelectronics, photosensitizers and dyes for biological imaging to name a few.1–6 Iridium(III) complexes offer numerous advantages such as high quantum efficiency, electrochemical stability and reversibility, accessibility by reliable and robust methods and tuneable colour of emission, which spans from sky blue to near-infrared.7 Owing to the important spin–orbit coupling due to the presence of the heavy metal, all the molecules in the singlet excited state undergo nearly quantitatively an intersystem crossing to the triplet excited state. The emission of iridium(III) complexes emanates often from the radiative deactivation of the metal-to-ligand triplet excited state (3MLCT*) to the ground state. In many cases the luminescence is ascribed to the radiative deactivation of mixed triplet MLCT/LC excited states (LC: ligand centered).7,8 Discrimination of the emission origin is accessible by the steady state and time resolved emission spectroscopy investigation, as well as with the help of calculations.9Many applications need high emission quantum yield in the solid state, such as organic light-emitting devices (OLEDs) and light emitting electrochemical cells (LEECs). Unfortunately, the luminescence of chromophores, and particularly cyclometallated iridium(III) complexes, in neat solid is subject to dramatic quenching and the phenomenon is referred to as “aggregation-caused-quenching”.10 For example, [Ir(ppy)3] displays a photoluminescence quantum efficiency of 0.9711 in dilute solutions, whereas in neat film the value drops below 0.0312 and as an amorphous solid the complex is almost non luminescent.13 The drop of quantum efficiency from solution to solid has been assigned to self-quenching through intermolecular π-stacking interactions and triplet–triplet annihilation.6,14 The introduction of bulky groups, such as dimethylphenyl, mesityl, phenyl or t-butyl, to name a few, on the ligand framework15–18 and “shielding” of the metal center by macrocyclic ligands14,19 allow for inhibiting these interactions. For example, the iridium(III) complex from ref. 20, represented in Fig. 1 featuring the bulky 4,4′-di-tert-butyl-2,2′-bipyridine ligand, has unchanged photoluminescence efficiency from solution to the spin-coated film, with a QY of 68% in deaerated CH3CN and 72% in film. In contrast, some other complexes display low or almost no luminescence in solution and the “turning on” of the luminescence is triggered by aggregation either by the introduction of a non-solvent or in the solid state (powder, neat spin-coated film or drop casted film). This behaviour has been called in different manners “enhanced phosphorescence emission in the solid state” (EPESS) and “aggregation-induced phosphorescence emission” (AIPE),6,21–23 depending on if the complex displays in dilute solution a weak emission or no detectable emission, respectively. In all these cases, the complex skeleton demonstrates flexibility in solution, and thus, the excitation energy is dispersed thermally. In the solid or aggregated state, the stiffening of the structure leads to “turning on” of emission.
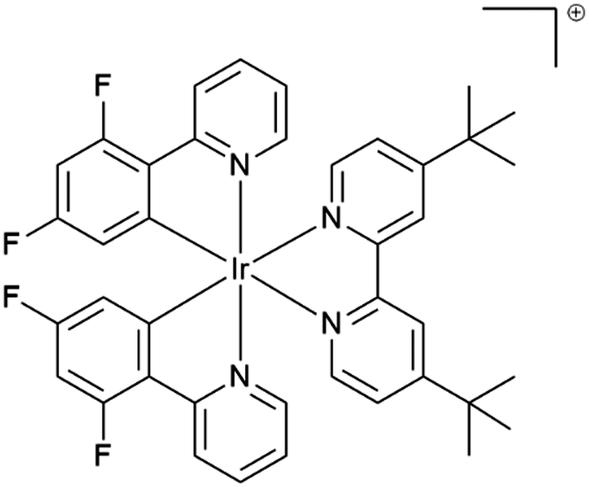 | ||
| Fig. 1 4,4′-Di-tert-butyl-2,2′-dipyridyl-bis[2-(2′,4′-difluorophenyl)pyridine]iridium(III) isolated with hexafluorophosphate anion from ref. 20. | ||
Changes in the emission wavelength in the solid state are quite common particularly looking at the neat solid (powder, neat thin film and crystal). The large majority of the cationic iridium(III) complexes display a bathochromic shift in the solid state,17,23–34 whereas only few contributions report iridium(III) complexes displaying a hypsochromic shift.17,27,32–40 If bathochromic shifts could be easily rationalized by the presence of intermolecular interactions, such as π–π interactions,14 blue shifted emission spectra in the solid state are less straightforward dealing with neat solid. In addition, the understanding of solid-state emission deals mainly with compounds displaying mechanochromism or piezochromism, which is the property of certain materials to change color by the application of pressure, usually through grinding.41 For example, the cationic Ir(III) complex with 2-phenylpyridine as a cyclometallating ligand and the 2-(5-phenyl-2-phenyl-1,2,4-triazol-3-yl)pyridine ancillary ligand (Fig. 2) displays blueshift emission in solid state, as well as mechanochromism.40 The “as synthesized” powder displays an emission centered at 471 nm, whereas the emission in a diluted CH3CN solution is centered at 499 nm. When grinding the “as synthesized” powder the emission displays a bathochromic shift and is similar to the emission observed in solution. Such a behavior was ascribed to phase transition from polycrystalline powder assessed by powder X-ray diffraction (PXRD) to amorphous phase. Nevertheless, the reason for the blue shift in the crystalline state was not stated.
 | ||
| Fig. 2 Ir(III) complex with phenylpyridine as a cyclometallating ligand and the 2-(5-phenyl-2-phenyl-1,2,4-triazol-3-yl)pyridine isolated with PF6 anion, from ref. 40. | ||
Most of the cationic iridium complexes studied for lighting applications are derived from the archetypical 2,2′-dipyridyl-bis[2′,4′-phenylpyridine]iridium(III) complex ([(ppy)2Irbpy]+, with ppy = 2′,4′-phenylpyridine and bpy = 2,2′-dipyridine), where the introduction of electron donating or electron withdrawing groups over the ligand allows for tuning efficiently the emission wavelength of the complex.42–45 For example, the archetypical [(ppy)2Irbpy]+ displays an emission centered at 585 nm (QY = 14% in deaerated CH3CN),46 whereas the above mentioned complex with fluorine atoms (electron withdrawing effect) over the phenyl rings displays an emission centered at 512 nm (QY = 70% in CH3CN).20 On the other hand, cationic complexes featuring 2-phenylbenzimidazole cyclometallating ligands are less common.29,36,47–51 As advantages, this ligand gives several divergence points (i) the benzimidazole ring (phbnz), (ii) phenyl ring and (III) the substitution of the nitrogen atom in position 3 (Fig. 3) and its synthesis does not require the use of palladium-catalyzed cross-coupling reactions.52,53 The three positions could give access to a fine tuning of the emission properties and modification of the bulkiness of the final complex. In this contribution, we present a study of complex A with methoxy groups both in position 4 of the phenyl ring and position 5 of the benzimidazole moiety. The investigation of the photoluminescence properties in solution and solid samples (measured on crystals and on amorphous powder) revealed a hypsochromic shift in the crystal state. This behavior has been correlated with the organization of complex A in the crystals. Furthermore, the crystal structure of complex A has been determined, and PXRD has been performed.
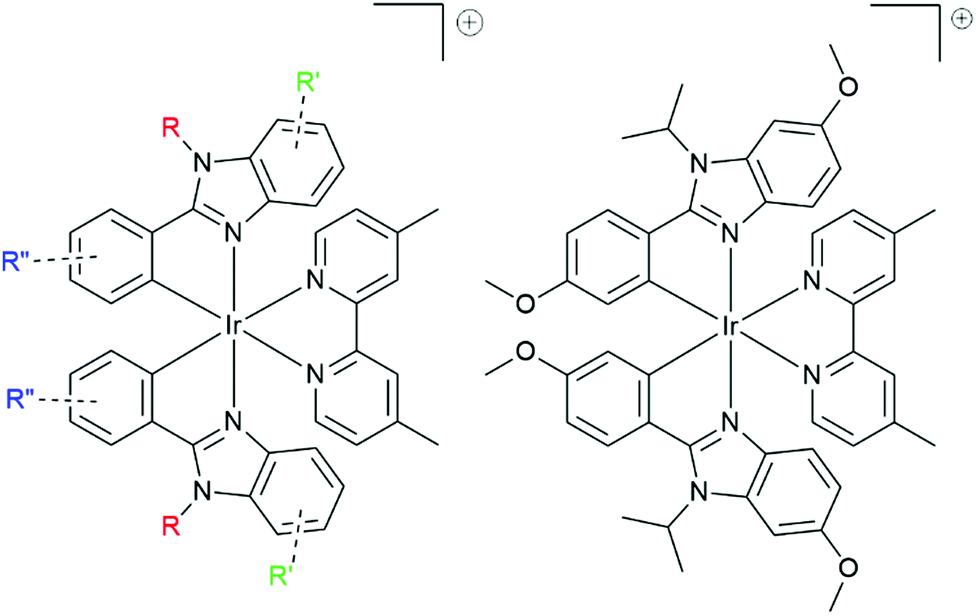 | ||
| Fig. 3 Left: General structure of cationic iridium complexes featuring 2-phenylbenzimidazole cyclometallating ligand. Right: Complex A presented in the contribution. | ||
Methods
Synthesis of complex A
Complex A has been synthesized following a two step procedure (Scheme 1) well described in the literature,17 that involved the formation of a dimer [(C^N)2Ir(μ-Cl)]2 by the methods described by Watts et al.54 and, in the second step, the introduction of the dimethylbipyridine (dmp) ligand. Complex A has been isolated after column chromatography followed by a rapid precipitation of the desired fraction with an overall yield of 67%, and characterized by NMR (1H, 13C, 19F and 31P), HRMS and elemental analysis. More details about the synthesis procedure and characterisation are available in the ESI.† | ||
| Scheme 1 Synthesis of complex A, (i) H2O/EtOEtOH (1/3), refluxed overnight; (ii) MeOH/CH2Cl2 (1/1) refluxed overnight under Ar, then KPF6 (sat.). | ||
Preparation of the solid samples
The amorphous powder (referred to as powder hereafter) was obtained by rapid precipitation of the material obtained after column chromatography by adding pentane in a concentrated solution of the complex in dichloromethane followed by filtration over Millipore® apparatus.The crystals were obtained by slow vapor diffusion of diisopropylether in a concentrated solution in 1,2-dichloroethane. The process was repeatable and gave in each case dark orange crystals displaying green-yellow emission under UV-light. The resulting solids were collected indiscriminately and used for the emission spectroscopy experiments and for the PXRD measurements.
Structural study
| Ir1–C1 (Å) | Ir1–N1 (Å) | Ir–N3 (Å) | NC^N^Ir^NC^N (°) | C^N bite angle (°) | CC^N^Ir^CC^N (°) | dmp bite angle (°) |
|---|---|---|---|---|---|---|
| 2.024(2) | 2.037(2) | 2.126(2) | 171.38(11) | 79.30 (9) | 90.15(13) | 77.47(11) |
Powder X-ray diffraction details
Powder X-ray diffraction (PXRD) was performed under ambient conditions using a Siemens D8 Advance diffractometer (Cu Kα radiation, 40 mA, 40 kV) in the 3–60° 2θ range with a 0.01° step size and an acquisition time of 6 s per step.Photophysical characterisation
The UV-visible spectra have been recorded on a Varian Carry 300 using 1 cm path length quartz cells. Steady state photoluminescence measurements of the liquid sample were carried out on a Horiba Fluoromax 4 using four wall quartz cuvettes with 1 cm path length and samples were degassed using the “freeze–pump–thaw” technique and for solid samples (crystals and powder) the spectra were acquired with a Horiba Fluorolog equipped with a “front face” acquisition set. The photoluminescence quantum yields (PLQY) were determined using Ir(ppy)3 in dichloromethane as the reference for liquid samples and PLQY of solid samples were determined using a GMP G8 integrating sphere fitted in a fluorolog. Time resolved photoluminescence measurements of liquid samples were performed on an Edinburgh Instruments nanosecond transient absorption LP920 equipped with a pump laser Quantel Brilliant emitting at 355 nm.DFT and DFT:MM calculations
All the DFT and DFT:MM calculations were carried out with the Gaussian 16 program,55 using the multilayer ONIOM method56 for the DFT:MM approach. The MN1557 density functional was used with the double-zeta Def2SVP58,59 basis set for all atoms (which includes an effective core potential for Ir(III) for the QM part), while the UFF60 forcefield was used to describe MM atoms, using (and checking) the automatic assignment by the Gaussian program. All ONIOM calculations were performed with the “embed” keyword, in order to include the field of charges during the DFT SCF procedure, thus accounting directly for polarization of the wave function. The model of the crystal was built by creating a 7 × 7 × 7 supercell starting from experimental positions using Mercury61 and Ambertools.62 The central complex molecule was then selected and only molecules and counterions with at least one atom within a distance lower than or equal to 25 Å from the selected molecule were kept. To ensure that the selection was electrically neutral, the same number of complexes and counterions (162 of each) was kept in the structure around the molecule of interest, representing a total of 18![[thin space (1/6-em)]](https://www.rsc.org/images/entities/char_2009.gif) 792 atoms (see Fig. 4).
792 atoms (see Fig. 4).
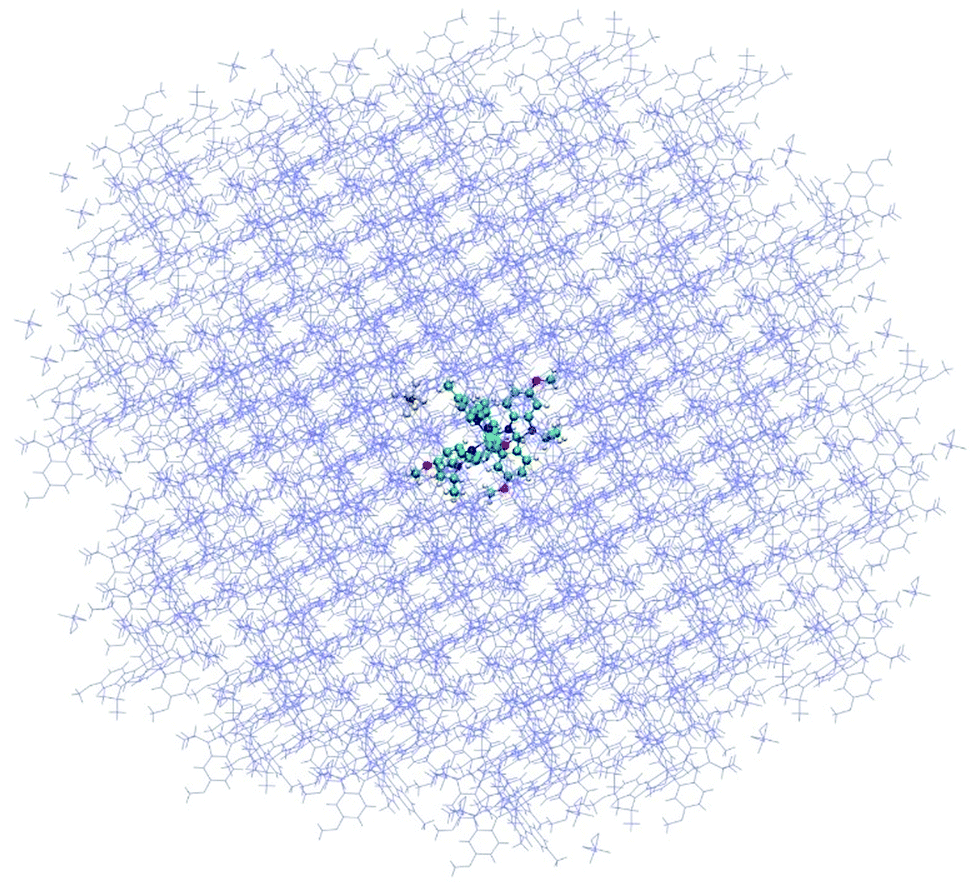 | ||
| Fig. 4 Molecule and counterion embedded in a crystal part including all molecules with a part at a distance lower than or equal to 25 Å from the molecule. | ||
This model has first been used to determine the charges of the surrounding MM layer. For that, we have used an approach similar to the one described by Bjornsson et al.63 In the first step, electrostatic charges were defined for the isolated molecule + PF6− system in its crystal geometry, using DFT. The CHELP64,65 and MK66 ESP fitting methods were used. The charges obtained with these two methods differ notably from each other: for instance, only the CHELP method gave the Ir cation a positive charge. Nevertheless, very similar results were found for both, and only results obtained with the CHELP set of charges are shown in the present work. The set of charges thus determined has been attributed to the corresponding atoms in all molecules of the crystal model. A new set of charges determined on the central QM complex + counterion was determined within the field of charges created by the MM surroundings, and attributed to all the molecules. This procedure has been conducted iteratively for 50 steps. A rapid convergence (ca. 10 steps) to the 3rd digit was found and final atomic charges were taken as the average over the 20 last steps. Once the charges of the surroundings were determined, the model could be used to determine luminescence properties.
In this new step, the PF6− counterion initially in the QM part for the determination of electrostatic charges was put in the MM part (hence keeping its crystallographic position) with the charges computed in the previous step; the charge of the phosphorus atom in this sole counterion (but not the surrounding ones) was adjusted to keep a neutral molecule and a total charge of −1 for the MM part and +1 for the central Ir complex.
The geometry of the central complex was optimized in its triplet state, all the MM atoms being kept frozen, thus accounting for both mechanical and electronic embedding.
We have considered that the emission process could be described as a vertical (adiabatic) transition, i.e. without change of geometry along the de-excitation process. Therefore, the energy of the complex in its singlet state, with the optimized geometry of the triplet state, has also been determined. The transition energy, denoted as ΔET→S, is determined as the energy difference between the two states and also used to compute the wavelength of the emitted photon during the vertical transition.
To compare the properties of the Ir complex in crystal to the ones in solvent or powder, a similar calculation was performed on the isolated complex: geometry optimization in the triplet state and single point calculation on the same geometry in the singlet state followed by the evaluation of the energy difference.
Results and discussions
Crystal structure
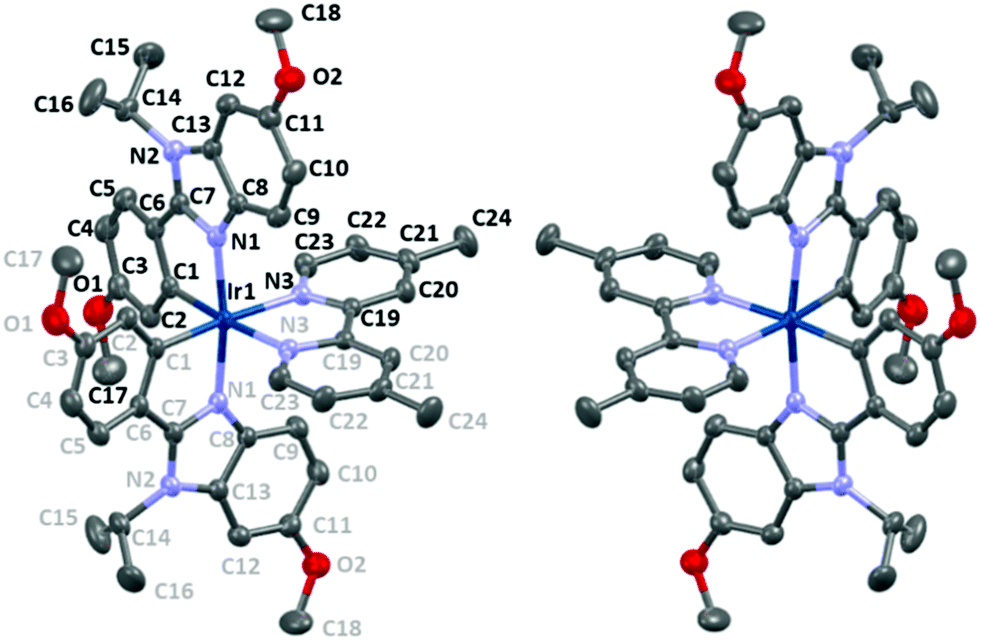
The iridium(III) and the P atom of the ([IrL2(dmp)](PF6)·3C2H4Cl2) compound are lying on a 2 fold axis. The asymmetrical unit is constituted by a half Ir atom, a half dimethylbipyridine (dmp), one L ligand, a half PF6 anion and one and a half solvent molecules. The packing is represented along the three axes in Fig. S1 and S2 (ESI†), in which it can be seen that cation chains (vide infra) are separated by the hexafluorophosphate anions. The complex displays a distorted octahedral geometry (Fig. 5 and Table 1). The angles formed by the nitrogen atoms from the cyclometallating ligands and the nitrogen atoms from the dmp are ∼99.4° and ∼87.4°, respectively. Only the angle between the cyclometallating carbons around the Ir is almost ideal (∼90.2°). A distorted octahedral geometry is commonly observed in cyclometallated cationic iridium complexes,15,31,37,46,67–70 and it is also observed in the commonly called archetype complex [Ir(ppy)2bpy]+.46 The coordinating nitrogen atoms from the benzimidazoles are in the expected trans position46 with each other (∼171.4°). As expected in the centrosymmetric space group, the Δ and Λ isomers in alternance in the lattice and between two chains (Fig. 5 and 7) are observed and are formed during the cyclometallation step.71 The bite angles of the ligands are ∼77.5° (dmp) and ∼79.3° (phbnz), the latter being very similar to the phenylpyridine ligand bite angle (∼80°).46 | ||
| Fig. 5 Representation of the Λ (left) and Δ (right) isomers of complex A with an ellipsoid drawn at 50% probability showing the label scheme (symmetry card for grey labels (1 − x, y, 3/2 − z)); hydrogen atoms have been omitted for clarity. | ||
 | ||
| Fig. 6 Representation of the hydrogen bonds linking the PF6 anion and three cationic complexes A; hydrogen atoms involved are highlighted. | ||
 | ||
| Fig. 7 (left) Crystal structure of complex A represented with an ellipsoid drawn at 50% probability. H5 and H14 have been highlighted. (right) Crystal packing projection in the (a,b) plane; hydrogen atoms have been omitted for clarity, PF6 anions are represented in space-fill, and dichloroethane solvent has been omitted. | ||
The bond lengths (Table 1) of the coordinating atoms with Ir are ∼2.02 Å, ∼2.04 Å, and ∼2.13 Å for the carbon atoms, the nitrogen atoms from the cyclometallating ligand and the nitrogen atoms from the dmp ligand, respectively. The bond lengths are very similar to those encountered in [(ppy)2Irbpy]+ with 2.01 Å, 2.05 Å and 2.13 Å, for Ir–C, Ir–N and Ir–Nbpy respectively.46 In addition, the Ir–Nbpy bonds are longer due to the so called trans effect, in agreement with the strong σ-donating ability of the carbon atoms.46 The dmp ligand is almost planar with a deviation of roughly 3.7° between the two average plans of the pyridine rings, whereas the cyclometallating ligands deviate significantly with an angle of roughly 12° between the average plans of the phenyl and of the benzimidazole moieties. The cyclometallation induced an obvious rigidification of the phenylbenzimidazole ligands that restricts the motion of the iso-propyl groups. Indeed, no disorder is observed for these groups. The H5⋯H14C(CH3)2 distance is 1.973 Å, which is below the sum of the van der Waals radii (2.18 Å). These interactions could be the origin of the important angles between the phenyl and the benzimidazole rings.
The complexes in the lattice are organized in chains and the PF6 anions, as well as solvent molecules (ClCH2CH2Cl), fill the space between them. Along the b axis, one can observe an alternation in the orientation between two adjacent molecules, as well as in the chains (Fig. 7 and Fig. S3, S4, ESI†). The complexes display intermolecular interactions and are organized in a somewhat catenary fashion along the ac direction. Within the chains, weak H⋯π interactions are found between the hydrogen atom H22 from the dpm ligand and the C12–C13 bond from the benzimidazole moiety (Fig. S5, ESI†). Counter ions deck chains through weak hydrogen bonding (Fig. 6 and Table 2). The interactions are displayed between the hydrogen atoms H20 of the dmp and fluorine atoms F1 from the counter ion and between the hydrogen atom H18B of the OMe group on the benzimidazole moiety and the fluorine atoms F2.‡ In addition, intramolecular hydrogen bonding is also observed between the H9 hydrogen atom riding on the C9 carbon atom of the cyclometallating ligand and nitrogen atom N3 of the dmp ligand (Fig. S6, ESI†). The angles formed by the hydrogen atoms, carbon atoms, and acceptor atoms (XHA angles72) are over 135° and the X⋯A distances are in the range 3.6–3.8 Å. The intermolecular interactions could be ascribed to weak hydrogen bonding with an electrostatic nature.72
| Atoms (X, H, A) | X–H (Å) | H⋯A (Å) | X⋯A (Å) | H–X⋯A angles (°) |
|---|---|---|---|---|
| C20, H20, F1 | 0.95 | 2.49 | 3.378(4) | 156.3 |
| C9, H9, N3 | 0.95 | 2.63 | 3.369(4) | 135 |
| C18, H18, F2 | 0.98 | 2.49 | 3.362(15) | 148.6 |
| C22, H22, centroid (C12–C13) | 0.95 | 2.70 | 3.502 | 142.4 |
Powder X-ray diffraction
The complex displays different colours in the powder and crystal forms, which may be related to polymorphism.23,36,38,73–75 The powder XRD pattern displays three undefined humps roughly centered at 10°, 19° and 37° (Fig. 8). The absence of fine peaks demonstrates that the precipitated powder is amorphous. It is worth noting that the presented result differs from previous reports, where crystalline powders (PXRDs displayed sharp and intense diffraction peaks) were obtained with cationic iridium complexes either by evaporation of the solvents after column chromatography or by rapid recrystallization/precipitation.23,36,39,40,74,76 In contrast, the crystals, collected indiscriminately from the same batch of crystallization, display a different pattern from the powder (Fig. S8, ESI†) with sharp peaks, which is similar to the calculated one from the crystal structure (Fig. S8, ESI†).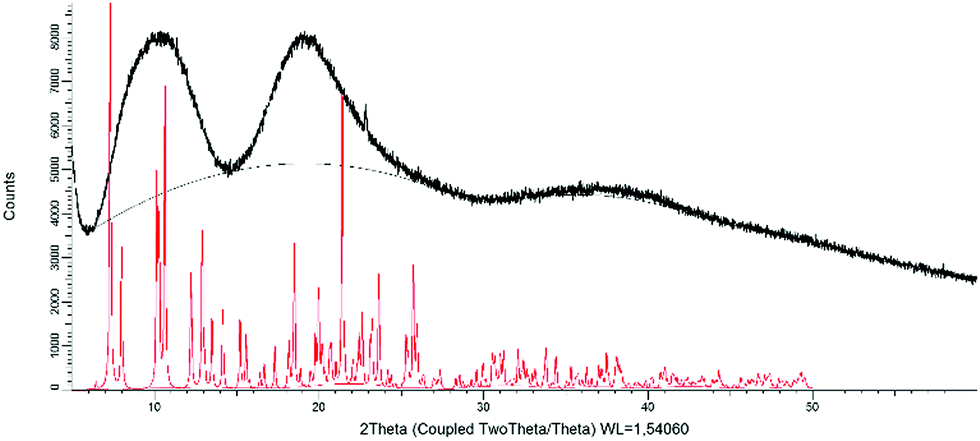 | ||
| Fig. 8 Powder X-ray diffraction diagram obtained from precipitated powder (black) and the calculated pattern from the crystal structure (red). | ||
Absorption and emission spectroscopies
The absorption and emission properties (steady state and time resolved) of the complex have been studied in both dichloromethane and acetonitrile under air equilibrated and deaerated conditions, regarding the emission. The spectra are displayed in Fig. 9 (left) and the quantum yields and lifetimes are gathered in Table 3. | ||
| Fig. 9 Top: Absorption and normalized emission spectra in CH2Cl2 (purple), in CH3CN (green) and at 77 K in butyronitrile (yellow dotted line). Bottom: Normalized emission spectra from the powder (red) and the crystals (blue). | ||
| λ em | Φ (× 10−2) | τ (ns) | Δ em (cm−1) | k r × 105 (s−1) | k nr × 105 (s−1) | k Q[O2] × 109 (M−1 s−1) | |
|---|---|---|---|---|---|---|---|
| a The shift in emission is determined taking the dichloromethane solution as the reference; positive values refer to a bathochromic shift and vice versa. b In butyronitrile. c Most intense emission band. Experimental decay curves are given in Fig. S8 (ESI). | |||||||
| Powder | 585 | 5.4 | 1580 | 0 | — | — | — |
| Crystals | 558 | 7.2 | 1518 | −798 | — | — | — |
| CH2Cl2 | 585 | 13.0 | 570 | — | 3.0 | 20.0 | 3.5 |
| CH3CN | 603 | 4.0 | 260 | +510 | 3.6 | 93.0 | 2.9 |
| 77 Kb | 527,c 557 | n.d. | 18440 |
||||
The absorption spectrum displays in the UV region intense transitions, which can be ascribed to spin-allowed π–π* transition (1IL) from the cyclometallating ligand and the ancillary ligand. Between 330 nm and 425 nm, moderately intense absorption bands are attributed to spin-allowed charge transfer transitions, from the metal to the ligand (1MLCT) and from the cyclometallating ligand to the ancillary ligand (1LLCT).7 The tail observed above 420 nm is due to direct spin-forbidden transitions leading to 3MLCT, permitted by the high spin–orbit coupling constant (ζ = 3909 cm−1) of the iridium core.7 The simulated spectrum, oscillator strength corresponding to the absorption bands and to the orbitals involved can be found in the ESI.†
The complex displays a broad and unstructured orangey emission (Table 3 and Fig. 10) with a PLQY of 13% and 4%, in CH2Cl2 and CH3CN respectively. The emission of the complex is sensitive to the presence of molecular oxygen with a quenching constant (kQ) of the order of 3 × 10⁹ M−1 s−1 in both solvents.§ The time resolved spectroscopies revealed a long lived emission in the range of hundreds of ns, which is typical of phosphorescent cationic iridium(III) complexes emitting in this region of the spectrum.16,45,77 The radiative deactivation constant kr can be extracted from the emission data and it is of the order of 3 × 10⁵ s−1, which corresponds to a radiative process emanating from the deactivation of a triplet metal-to-ligand-charge-transfer excited state (3MLCT*) to the ground state.7,8 The latter is corroborated by the broadness of the emission and the positive solvatochromism (+510 cm−1) of the emission,7,8 when comparing the emission in CH2Cl2 and CH3CN. Finally, complex A displays at 77 K in glassy butyronitrile a structured emission with two peaks at 527 nm and 557 nm with a very long decay (∼18 μs). This rigidochromism is typical of transition metal complexes submitted to a rigidification of the environment by a decrease of the temperature (vide infra) and is mainly observed when the emission arises from the radiative deactivation of the 3MLCT* to the ground state. Thus, the emission properties of complex A, emission shape, kr, positive solvatochromism and rigidochromism, indicate that the phosphorescence has for origin the radiative deactivation from the 3MLCT*; nonetheless, cyclometallated iridium(III) complexes are known to display emission from the radiative deactivation of the mixed excited state being mainly 3MLCT*/3LC*7,8 and the emission might be best described as emanating from the radiative deactivation to the ground state of such a mixed excited state with a predominance of the 3MLCT* as confirmed by the calculations (see ESI†).
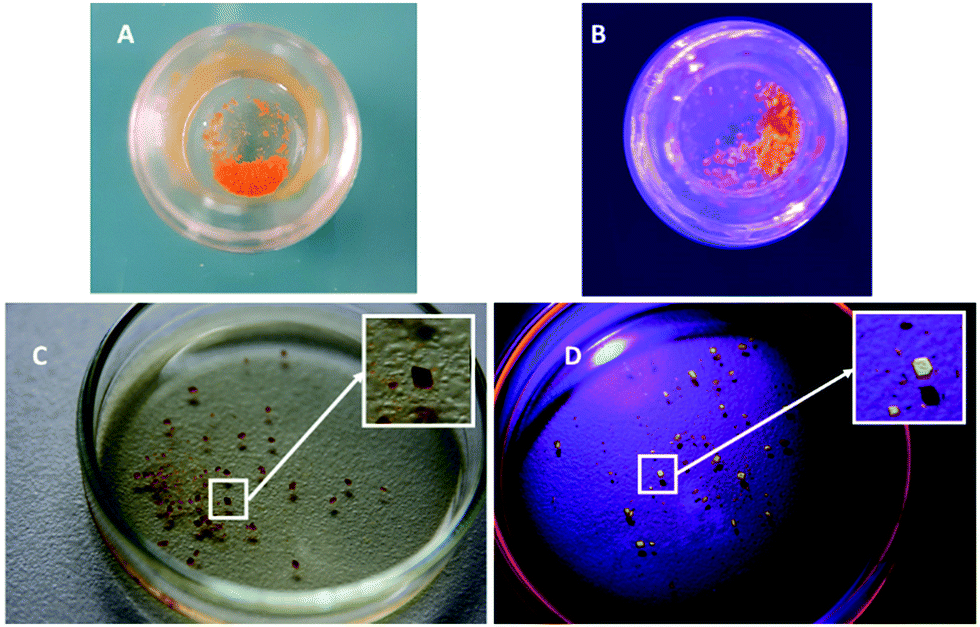 | ||
| Fig. 10 Photography of the complex under daylight (A and C) and UV-light at 265 nm (B and D). (A and B) Show the amorphous phase. (C and D) Show isolated crystals. Dark dots correspond to the shadow of the crystals. | ||
The solid-state emission has been explored in neat solid (i.e. amorphous powder and crystals), in steady state spectroscopy under an air atmosphere. Photos of the crystals and the powder displayed in Fig. 10 allow for visualizing with the naked eye the stark contrast of the emission of the amorphous phase and the crystal. Data are gathered in Table 3 and the spectra are displayed in Fig. 9. The powder was obtained by precipitation of complex A from a dichloromethane solution with pentane. Both solid forms of the complex (i.e. powder and crystals) display a broad and structureless emission in the visible region of the spectrum which is an indication that the emission should emanate from the same radiative process (3MLCT*/3IL*) as in solution, which has been confirmed by the calculation (see ESI†). Nevertheless, the emission spectrum of the powder is centered at 585 nm which is the same as the one observed in deaerated dichloromethane solution and in stark contrast the emission of the crystals displays a somewhat strong hypsochromic shift of 27 nm (798 cm−1).
Such a shift solely in the crystal state is unusual (vide supra). This behaviour could be ascribed to rigidochromism which is a property of the transition metal complexes displaying a blue shifted emission when their solution environment becomes rigid, thus decreasing the stabilization of the emissive excited states, by lowering temperature78 or increasing the pressure.79 It is especially encountered with phosphorescence emanating from the radiative deactivation from the 3MLCT* to the ground state. Nevertheless, rigidochromism has been ascribed to a tetranuclear [Au2Cu2(μ-(PPh2)2py)2(μ-OH)](PF6)3 cluster with a butterfly shaped metal core, that displays a very strong hypsochromic shift (172 nm, 4765 cm−1) from CH2Cl2 solution to powder at room temperature.80 This behaviour was attributed to the Jahn–Teller distortion in the lowest triplet excited state from linear to bent geometry around the gold(I) centers. Such an effect is unlikely to occur in octahedral d6 iridium(III) cyclometallated complexes81 and, in addition, the hypsochromic shift is observed solely in crystal for complex A, thus ruling out rigidochromism. Regarding the supramolecular organisation in the crystal, no evidence of the presence of strong intermolecular interactions is found, and especially no π–π stacking, that could lead to such a hypsochromic shift. In addition, the intrinsic octahedral geometry of complex A prevents the formation of H-aggregates (or J-aggregates) both in solution and in solid state (crystal or powder).82,83 A hypsochromic shift has been reported in a dinuclear rhenium(I) complex84 and was ascribed to the local packing in the crystal and especially to the orientation of the molecular dipoles. In the case of complex A, a close look at the crystal lattice and especially at the projection in the ab plan (Fig. 5b) and the views displayed in Fig. S1–S4 (ESI†) show that the complexes, and thus, the molecular dipoles, are oppositely oriented. Assuming that the excited state of the complex displays a higher molecular dipole moment than the ground state (in absolute value), it follows that the excited state could be destabilized. Consequently, the radiative deactivation of the excited state will be blue shifted in comparison with the solvated complexes. In addition, the crystal structure displays the presence of PF6 anion close to the dmp ligand, highlighted by weak hydrogen bonds (vide supra). One can predict that the negative charge borne by the counter ion may interfere also with the dipole moment and thus it would destabilize the excited state, leading to the observed hypsochromic shift in the crystal. However, in the amorphous powder, the complexes are randomly oriented, as shown by the PXRD and thus neither particular molecular dipole interaction nor interactions with the counter ions are present. To have a deeper understanding of the phenomena and to discriminate if rather the dipole–dipole interaction or the peculiar position of counter ion leads to the hypsochromic shift we have performed DFT and DFT:MM calculations.
DFT and DFT:MM calculations
To understand the hypsochromic effect observed in crystal, a series of DFT and DFT:MM calculations have been made, for the complex in both its singlet (ground state) and triplet (excited state) configurations, in a vacuum and embedded in a model of crystal. The structure was thus optimized at the MN15/Def2SVP level of theory for the isolated complex and MN15/Def2SVP:UFF levels of theory for the complex in crystal (see computational details), both for the singlet ground state (S) and triplet excited state (T). Using these models, we have first computed the λmax of the emission associated with the triplet to singlet vertical luminescence transition. This value, denoted as ΔET→S, is computed as the difference between the energy of the optimized triplet structure (ET(T)) and of the singlet structure (ES(T)), with the triplet geometry (ΔET→S = ET(T) − ES(T)) since the emission is considered to be associated with a vertical transition. Values obtained for the single complex and for the crystal model are reported in Table 4 and compared to the experimental results obtained in powder and in the crystal. The table compares both the ΔET→S(T) and corresponding λmax values.| ΔET→S(T) (eV) | λ max (nm) | |
|---|---|---|
| Single complex model | 2.21 | 561 |
| Crystal model | 2.46 | 504 |
| Amorphous powder (exp) | 2.12 | 585 |
| Crystals (exp) | 2.22 | 558 |
Compared to experimental data from powder, the ΔET→S given by the single complex model is overestimated by 0.09 eV. Comparing the crystal model and experimental results also shows an overestimation of 0.24 eV. However, calculations account for the hypsochromic effect with an overestimated decrease of the λmax of −57 nm (561 nm to 504 nm), to be compared to the 27 nm obtained experimentally. We thus consider that our model is able to reproduce the experimental findings and is therefore suitable to investigate the actual nature of the influence of the crystal. This influence of the surrounding can be split into two main components: a steric effect that can modify the complex structure upon crystallization and a polarization effect, due to the charges of surrounding molecules. Both have been evaluated using the DFT:MM model.
The mechanical influence was first evaluated by comparing the geometries of the triplet structures (excited states giving rise to emission) optimized in a vacuum and in the crystal. A structure alignment shows very similar geometries, with a computed RMSD of only 0.24 Å. This limited influence of the crystal on the structure of the complex is consistent with quite a “rigid” complex structure. One can specifically remark that, when putting the complex out of the crystal, the four Ir–N distances do not vary while the two Ir–C bonds marginally shrink from 2.02 Å to 2.00 Å. Since the crystalline environment keeps the geometry of the complex essentially unchanged compared to the one of the complex alone, one can thus deduce that the hypsochromic effect observed might be rather due to the polarization effects of the crystalline structure.
To evaluate this effect, the ΔET→S for the complex in its crystal geometry, but without the surrounding charges, has been compared to the one obtained in the complete model. A value of 2.19 eV was found, very similar (even smaller) to the value found in a vacuum. This thus confirms that the observed hypsochromism is due to the polarization effects of the crystalline environment.
In order to understand this polarizing effect of the surroundings and especially discriminate between long- and short-range effects, the ΔET→S has been computed for a smaller crystal model in which only the first neighbours of the complex (other complexes and counterions all at the MM level) were kept. The value found, 2.48 eV, is essentially the same as in the “big” model, showing an exclusively short-range effect. Finally, the calculation of ΔET→S(T) was performed for a complex in interaction with either the nearest equivalent complex or the nearest PF6− counterion. The presence of the nearest complex only (at the MM level) yields a ΔET→S of 2.14 eV, very similar to the result in a vacuum, thus discarding a strong complex/complex interaction. On the opposite, the presence of the nearest counterion only yields a ΔET→S(T) of 2.41 eV, almost unchanged compared to the largest crystal model. This result unambiguously proves that the hypsochromic effect is due to the presence of a negatively charged counterion located near each complex in the crystal. Interestingly, even the replacement of PF6− with a negative point charge at the position of the P atom yields a hypsochromic shift of 2.43 eV. This PF6− anion is positioned at a peculiar place and interacts strongly through hydrogen bonding with H20 of the dmp ligand (vide supra) and the negative charge of the anion destabilizes the excited state. Indeed, the dipole moment in this complex is roughly oriented from the electron rich iridium toward the electron poor dmp ligand in the ground state.85,86 In the excited state the electron density is inverted, and so is the dipole moment. Due to its specific position, the PF6 anion will more “perturbate“ the excited state than the ground state, thus leading to an increase of the ΔET→S and a hypsochromic shift of the emission in crystals. To illustrate this hypothesis, we have compared the dipole moments from DFT calculations, for the complex in its singlet and triplet states, in the presence or absence of a negative point charge of −e at the position of the P atom, all using the geometry from the crystal. Because the complex is positively charged, its dipole is gauge-dependent (depends on position and orientation). A special care has thus been taken to carry out calculations on the same structure (same geometry and same orientation) with or without the charge, in the triplet and singlet states.
Fig. 11 represents the dipole as an arrow starting from the origin. The scale is 1 Debye for one Å. The orange arrow is for the complex in its singlet state, without charge, and green when in triplet without charge. In the presence of the charge, the dipole for the singlet state is shown in red and the one for the triplet state is in blue. As stated, the singlet and triplet structures have opposite dipoles when the complex is isolated, both along the C2 rotation axis. In the presence of the charge (blue sphere), both the dipoles (red: singlet and blue: triplet) are modified and now partially point towards the negative charge. As shown in Fig. 11, the triplet dipole is more affected than the singlet one, consistent with a more perturbed electron structure and a ΔET→S value increase in the presence of the negative charge, i.e., in the crystal structure.
 | ||
| Fig. 11 Representation of the dipole of the complex at the origin without counterion (orange: singlet, green: triplet) or in presence of a negative charge at the position of the P atom of the counterion (red: singlet, blue: triplet). | ||
Conclusions
In summary, we have reported the synthesis and the characterization of a new cationic iridium(III) complex featuring two 1-(p-methoxyphenyl)-5-methoxybenzimidazole cyclometallating ligands and a dimethylbipyridine ancillary ligand. The single crystal structure and the powder X-ray diffraction have been presented. The photophysical studies of the complex point out a strong change in the emission wavelength of the complex between CH2Cl2 solution and the amorphous powder in comparison with crystals, with a hypsochromic shift of the order 800 cm−1, whereas (i) the majority of cationic iridium complexes display a bathochromic shift from solution to neat solid, and (ii) the few observed hypsochromic shifts are on average 600 cm−1. The study of the single crystal XRD and in particular the packing of the molecules in the lattice suggest that the observed shift can be explained by the destabilizing effect of the neighbouring counterion in the crystal on the dipole moment of the complexes. This result is supported by the calculation that fits very well the experimental data. These results highlight how packing can perturb the photophysical properties of the molecules, even in the absence of particularly short interactions.Conflicts of interest
There are no conflicts to declare.Acknowledgements
The authors thank the CNRS and Université de Grenoble Alpes for their support. This work benefited from state aid managed by the National Research Agency under the “Investments for the future” and the “Investissements d’avenir” program bearing the reference ANR-15-IDEX-02”. E. Martinez-Vollbert has benefited from a CONACYT program (707986). This work was partially supported by CBH-EUR-GS (ANR-17-EURE-0003). The NanoBio ICMG (UAR 2607) is acknowledged for providing facilities for mass spectrometry (A. Durand, L. Fort and R. Gueret), elemental analyses (M. Fayolle) and single crystal X-ray diffraction (N. Altounian).The solid-state emission measurements have been performed in the “Laboratoire de Chimie” (UMR-5182) at the “Ecole Nationnale Supérieure de Lyon” (ENSL).
References
- W. C. H. Choy, W. K. Chan and Y. Yuan, Adv. Mater., 2014, 26, 5368–5399 CrossRef CAS PubMed.
- K. K.-W. Lo, Acc. Chem. Res., 2015, 48, 2985–2995 CrossRef CAS PubMed.
- Y. J. Yuan, Z. T. Yu, D. Q. Chen and Z. G. Zou, Chem. Soc. Rev., 2017, 46, 603–631 RSC.
- C. K. Prier, D. a Rankic and D. W. C. MacMillan, Chem. Rev., 2013, 113, 5322–5363 CrossRef CAS PubMed.
- J. H. Shon and T. S. Teets, ACS Energy Lett., 2019, 4, 558–566 CrossRef CAS.
- Q. Zhao, L. Li, F. Li, M. Yu, Z. Liu, T. Yi and C. Huang, Chem. Commun., 2008, 685–687 RSC.
- L. Flamigni, A. Barbieri, C. Sabatini, B. Ventura and F. Barigelletti, Photochemistry and Photophysics of Coordination Compounds II, 2007, pp. 143–203 Search PubMed.
- K. P. S. Zanoni, R. L. Coppo, R. C. Amaral and N. Y. Murakami Iha, Dalton Trans., 2015, 44, 14559–14573 RSC.
- P. A. Scattergood, A. M. Ranieri, L. Charalambou, A. Comia, D. A. W. Ross, C. R. Rice, S. J. O. Hardman, J.-L. Heully, I. M. Dixon, M. Massi, F. Alary and P. I. P. Elliott, Inorg. Chem., 2020, 59, 1785–1803 CrossRef CAS PubMed.
- X. Yan, H. Wang, C. E. Hauke, T. R. Cook, M. Wang, M. L. Saha, Z. Zhou, M. Zhang, X. Li, F. Huang and P. J. Stang, J. Am. Chem. Soc., 2015, 137, 15276–15286 CrossRef CAS PubMed.
- T. Sajoto, P. I. Djurovich, A. B. Tamayo, J. Oxgaard, W. A. Goddard and M. E. Thompson, J. Am. Chem. Soc., 2009, 131, 9813–9822 CrossRef CAS PubMed.
- Y. Kawamura, K. Goushi, J. Brooks, J. J. Brown, H. Sasabe and C. Adachi, Appl. Phys. Lett., 2005, 86, 71104 CrossRef.
- Y. Kawamura, H. Sasabe and C. Adachi, Jpn. J. Appl. Phys., 2004, 43, 7729–7730 CrossRef CAS.
- N. Komiya, M. Okada, K. Fukumoto, D. Jomori and T. Naota, J. Am. Chem. Soc., 2011, 133, 6493–6496 CrossRef CAS PubMed.
- X. Wang, S. Wang, F. Pan, L. He and L. Duan, Inorg. Chem., 2019, 58, 12132–12145 CrossRef CAS PubMed.
- E. C. Constable, C. E. Housecroft, G. E. Schneider, J. A. Zampese, H. J. Bolink, A. Pertegás and C. Roldan-Carmona, Dalton Trans., 2014, 43, 4653–4667 RSC.
- A. F. Henwood, A. K. Pal, D. B. Cordes, A. M. Z. Slawin, T. W. Rees, C. Momblona, A. Babaei, A. Pertegás, E. Ortí, H. J. Bolink, E. Baranoff and E. Zysman-Colman, J. Mater. Chem. C, 2017, 5, 9638–9650 RSC.
- G. Rajendra Kumar and P. Thilagar, Inorg. Chem., 2016, 55, 12220–12229 CrossRef CAS PubMed.
- N. Komiya, M. Okada, K. Fukumoto, K. Kaneta, A. Yoshida and T. Naota, Chem. – Eur. J., 2013, 19, 4798–4811 CrossRef CAS PubMed.
- H. J. Bolink, E. Coronado, R. D. Costa, N. Lardiés and E. Ortí, Inorg. Chem., 2008, 47, 9149–9151 CrossRef CAS PubMed.
- V. Sathish, A. Ramdass, P. Thanasekaran, K. L. Lu and S. Rajagopal, J. Photochem. Photobiol., C, 2015, 23, 25–44 CrossRef CAS.
- H. Wu, T. Yang, Q. Zhao, J. Zhou, C. Li and F. Li, Dalton Trans., 2011, 40, 1969–1976 RSC.
- J. Han, K. Tang and S. Cheng, Inorg. Chem. Front., 2020, 7, 786–794 RSC.
- H.-C. Su, H.-F. Chen, F.-C. Fang, C.-C. Liu, C.-C. Wu, K.-T. Wong, Y.-H. Liu and S.-M. Peng, J. Am. Chem. Soc., 2008, 130, 3413–3419 CrossRef CAS PubMed.
- L. He, L. Duan, J. Qiao, G. Dong, L. Wang and Y. Qiu, Chem. Mater., 2010, 22, 3535–3542 CrossRef CAS.
- L. He, D. Ma, L. Duan, Y. Wei, J. Qiao, D. Zhang, G. Dong, L. Wang and Y. Qiu, Inorg. Chem., 2012, 51, 4502–4510 CrossRef CAS PubMed.
- S. Evariste, M. Sandroni, T. W. Rees, C. Roldán-Carmona, L. Gil-Escrig, H. J. Bolink, E. Baranoff and E. Zysman-Colman, J. Mater. Chem. C, 2014, 2, 5793 RSC.
- K. P. S. Zanoni, M. S. Sanematsu and N. Y. Murakami Iha, Inorg. Chem. Commun., 2014, 43, 162–164 CrossRef CAS.
- G. G. Shan, H. Bin Li, Z. C. Mu, D. X. Zhu, Z. M. Su and Y. Liao, J. Organomet. Chem., 2012, 702, 27–35 CrossRef CAS.
- Y. Lan, G. Li, Z. Wang, Y. He, Y. Liu and L. He, Dyes Pigm., 2017, 144, 158–167 CrossRef CAS.
- K. J. Suhr, L. D. Bastatas, Y. Shen, L. A. Mitchell, G. A. Frazier, D. W. Taylor, J. D. Slinker and B. J. Holliday, Dalton Trans., 2016, 45, 17807–17823 RSC.
- E. Matteucci, A. Baschieri, A. Mazzanti, L. Sambri, J. Ávila, A. Pertegás, H. J. Bolink, F. Monti, E. Leoni and N. Armaroli, Inorg. Chem., 2017, 56, 10584–10595 CrossRef CAS PubMed.
- C. Hierlinger, D. B. Cordes, A. M. Z. Slawin, D. Jacquemin, V. Guerchais and E. Zysman-Colman, Dalton Trans., 2018, 47, 10569–10577 RSC.
- L. P. Li, S. Y. Yao, Y. L. Ou, L. Q. Wei and B. H. Ye, Organometallics, 2017, 36, 3257–3265 CrossRef CAS.
- J. D. Slinker, A. A. Gorodetsky, M. S. Lowry, J. Wang, S. Parker, R. Rohl, S. Bernhard and G. G. Malliaras, J. Am. Chem. Soc., 2004, 126, 2763–2767 CrossRef CAS PubMed.
- H. Cao, H. Sun, G. Shan, Y. Wu, Z. Su and Y. Liao, J. Mater. Chem. C, 2015, 2341–2349 Search PubMed.
- K. J. Suhr, L. D. Bastatas, Y. Shen, L. A. Mitchell, B. J. Holliday and J. D. Slinker, ACS Appl. Mater. Interfaces, 2016, 8, 8888–8892 CrossRef CAS PubMed.
- K. Traskovskis, V. Kokars, S. Belyakov, N. Lesina, I. Mihailovs and A. Vembris, Inorg. Chem., 2019, 58, 4214–4222 CrossRef CAS PubMed.
- G. G. Shan, H. Bin Li, H. T. Cao, D. X. Zhu, P. Li, Z. M. Su and Y. Liao, Chem. Commun., 2012, 48, 2000–2002 RSC.
- G. Shan, H.-B. Li, D.-X. Zhu, Z.-M. Su and Y. Liao, J. Mater. Chem., 2012, 22, 12736–12744 RSC.
- Z. Chi, X. Zhang, B. Xu, X. Zhou, C. Ma, Y. Zhang, S. Liu and J. Xu, Chem. Soc. Rev., 2012, 41, 3878–3896 RSC.
- C. E. Housecroft and E. C. Constable, Coord. Chem. Rev., 2017, 350, 155–177 CrossRef CAS.
- L. He, Y. Lan, D. Ma, X. Song and L. Duan, J. Mater. Chem. C, 2018, 6, 1509–1520 RSC.
- C. D. Ertl, C. Momblona, A. Pertegás, J. M. Junquera-Hernández, M. G. La-Placa, A. Prescimone, E. Ortí, C. E. Housecroft, E. C. Constable and H. J. Bolink, J. Am. Chem. Soc., 2017, 139, 3237–3248 CrossRef CAS PubMed.
- A. F. Henwood and E. Zysman-Colman, Top. Curr. Chem., 2016, 374, 36 CrossRef PubMed.
- R. D. Costa, E. Ortí, H. J. Bolink, S. Graber, S. Schaffner, M. Neuburger, C. E. Housecroft and E. C. Constable, Adv. Funct. Mater., 2009, 19, 3456–3463 CrossRef CAS.
- Y. Jiao, M. Li, N. Wang, T. Lu, L. Zhou, Y. Huang, Z. Lu, D. Luo and X. Pu, J. Mater. Chem. C, 2016, 4, 4269–4277 RSC.
- T. Yu, F. Yang, X. Chen, W. Su and Y. Zhao, New J. Chem., 2017, 41, 2046–2054 RSC.
- H.-T. T. Mao, C.-X. X. Zang, G.-G. G. Shan, H.-Z. Z. Sun, W.-F. F. Xie and Z.-M. M. Su, Inorg. Chem., 2017, 56, 9979–9987 CrossRef CAS PubMed.
- J. E. Yarnell, P. De La Torre and F. N. Castellano, Eur. J. Inorg. Chem., 2017, 1–9 Search PubMed.
- J.-H. Zhao, Y.-X. Hu, Y. Dong, X. Xia, H.-J. Chi, G.-Y. Xiao, X. Li and D.-Y. Zhang, New J. Chem., 2017, 41, 1973–1979 RSC.
- J. F. Lemonnier, L. Guénée, C. Beuchat, T. A. Wesolowski, P. Mukherjee, D. H. Waldeck, K. A. Gogick, S. Petoud and C. Piguet, J. Am. Chem. Soc., 2011, 133, 16219–16234 CrossRef CAS PubMed.
- N. M. Shavaleev, S. V. Eliseeva, R. Scopelliti and J. C. G. Bünzli, Chem. – Eur. J., 2009, 15, 10790–10802 CrossRef CAS PubMed.
- S. Sprouse, K. A. King, P. J. Spellane and R. J. Watts, J. Am. Chem. Soc., 1984, 106, 6647–6653 CrossRef CAS.
- D. J. Frisch, M. J. Trucks, G. W. Schlegel, H. B. Scuseria, G. E. Robb, M. A. Cheeseman, J. R. Scalmani, G. Barone, V. Petersson, G. A. Nakatsuji, H. Li, X. Caricato, M. Marenich, A. V. Bloino, J. Janesko, B. G. Gomperts, R. Mennucci and B. Hratch, Gaussian 09, Revision E.01, 2016 Search PubMed.
- S. Dapprich, I. Komáromi, K. S. Byun, K. Morokuma and M. J. Frisch, THEOCHEM, 1999, 461–462, 1–21 CrossRef CAS.
- H. S. Yu, X. He, S. L. Li and D. G. Truhlar, Chem. Sci., 2016, 7, 5032–5051 RSC.
- F. Weigend and R. Ahlrichs, Phys. Chem. Chem. Phys., 2005, 7, 3297–3305 RSC.
- F. Weigend, Phys. Chem. Chem. Phys., 2006, 8, 1057–1065 RSC.
- A. K. Rappe, C. J. Casewit, K. S. Colwell, W. A. Goddard and W. M. Skiff, J. Am. Chem. Soc., 1992, 114, 10024–10035 CrossRef CAS.
- C. F. Macrae, I. Sovago, S. J. Cottrell, P. T. A. Galek, P. Mccabe, E. Pidcock, M. Platings, G. P. Shields, J. S. Stevens, M. Towler and P. A. Wood, J. Appl. Crystallogr., 2020, 53, 226–235 CrossRef CAS PubMed.
- D. A. Case, K. Belfon, I. Y. Ben-Shalom, S. R. Brozell, S. D. Cerutti, T. E. Cheatham, V. W. D. Cruzeiro, A. T. Darden, R. E. Duke, G. Giambasu, M. K. Gilson, H. Gohlke, A. W. Goetz, R. Harris, S. Izadi, S. A. Izmailov, K. Kasavajhala, A. Kovalenko, R. Krasny, T. Kurtzman, T. S. Lee, S. Le Grand, P. Li, C. Lin, J. Liu, T. Luchko, R. Luo, V. Man, K. M. Merz, Y. Miao, O. Mikhailovskii, G. Monard, H. Nguyen, A. Onufriev, F. Pan, S. Pantano, R. Qi, D. R. Roe, A. Roitberg, C. Sagui, S. Schott-Verdugo, J. Shen, C. L. Simmerling, N. R. Skrynnikov, J. Smith, J. Swails, R. C. Walker, J. Wang, L. Wilson, R. M. Wolf, X. Wu, Y. Xiong, Y. Xue, D. M. York and P. A. Kollman, Amber 2021, University of California, San Francisco, 2021 Search PubMed.
- R. Bjornsson and M. Bühl, J. Chem. Theory Comput., 2012, 8, 498–508 CrossRef CAS PubMed.
- L. E. Chirlian and M. M. Francl, J. Comput. Chem., 1987, 8, 894–905 CrossRef CAS.
- C. M. Breneman and K. B. Wiberg, J. Comput. Chem., 1990, 11, 361–373 CrossRef CAS.
- U. C. Singh and P. A. Kollman, J. Comput. Chem., 1984, 5, 129–145 CrossRef CAS.
- S. I. Bezzubov, Y. M. Kiselev, A. V. Churakov, S. A. Kozyukhin, A. A. Sadovnikov, V. A. Grinberg, V. V. Emets and V. D. Doljenko, Eur. J. Inorg. Chem., 2016, 347–354 CrossRef CAS.
- E. Baranoff, H. J. Bolink, E. C. Constable, M. Delgado, D. Häussinger, C. E. Housecroft, M. K. Nazeeruddin, M. Neuburger, E. Ortí, G. E. Schneider, D. Tordera, R. M. Walliser and J. A. Zampese, Dalton Trans., 2013, 42, 1073–1087 RSC.
- M. Martínez-Alonso, J. Cerdá, C. Momblona, A. Pertegás, J. M. Junquera-Hernández, A. Heras, A. M. Rodríguez, G. Espino, H. Bolink and E. Ortí, Inorg. Chem., 2017, 56, 10298–10310 CrossRef PubMed.
- K. A. Phillips, T. M. Stonelake, K. Chen, Y. Hou, J. Zhao, S. J. Coles, P. N. Horton, S. J. Keane, E. C. Stokes, I. A. Fallis, A. J. Hallett, S. P. O’Kell, J. M. Beames and S. J. A. Pope, Chem. – Eur. J., 2018, 24, 8577–8588 CrossRef CAS PubMed.
- D. G. Congrave, Y. Ting Hsu, A. S. Batsanov, A. Beeby and M. R. Bryce, Organometallics, 2017, 36, 981–993 CrossRef CAS.
- T. Steiner, Angew. Chem., Int. Ed., 2002, 41, 48–76 CrossRef CAS.
- D. Avobenzone, G. Zhang, J. Lu, M. Sabat and C. L. Fraser, J. Am. Chem. Soc., 2010, 132, 2160–2162 CrossRef PubMed.
- T. F. Mastropietro, Y. J. Yadav, E. I. Szerb, A. M. Talarico, M. Ghedini and A. Crispini, Dalton Trans., 2012, 41, 8899–8907 RSC.
- B. Xu, J. He, Y. Mu, Q. Zhu, S. Wu, Y. Wang, Y. Zhang, C. Jin, C. Lo, Z. Chi, A. Lien, S. Liua and J. Xu, Chem. Sci., 2015, 3236–3241 RSC.
- Y. You, H. S. Huh, K. S. Kim, S. W. Lee, D. Kim and S. Y. Park, Chem. Commun., 2008, 3998–4000 RSC.
- K. Hasan, A. K. Bansal, I. D. W. Samuel, C. Roldán-Carmona, H. J. Bolink and E. Zysman-Colman, Sci. Rep., 2015, 5, 1–16 Search PubMed.
- A. J. Lees, Comments Inorg. Chem., 1995, 17, 319–346 CrossRef CAS.
- D. Tran, J. L. Bourassa and P. C. Ford, Inorg. Chem., 1997, 36, 439–442 CrossRef CAS.
- S. Nayeri, S. Jamali, A. Jamjah and H. Samouei, Inorg. Chem., 2019, 58, 12122–12131 CrossRef CAS PubMed.
- M. A. Halcrow, Chem. Soc. Rev., 2013, 42, 1784–1795 RSC.
- F. Würthner, T. E. Kaiser and C. R. Saha-Möller, Angew. Chem., Int. Ed., 2011, 50, 3376–3410 CrossRef PubMed.
- A. Mishra, R. K. Behera, P. K. Behera, B. K. Mishra and G. B. Behera, Chem. Rev., 2000, 100, 1973–2011 CrossRef CAS PubMed.
- E. Quartapelle Procopio, M. Mauro, M. Panigati, D. Donghi, P. Mercandelli, A. Sironi, G. D’Alfonso and L. De Cola, J. Am. Chem. Soc., 2010, 132, 14397–14399 CrossRef CAS PubMed.
- J. M. Fernaíndez-Hernaíndez, C. H. Yang, J. I. Beltraín, V. Lemaur, F. Polo, R. Fröhlich, J. Cornil and L. De Cola, J. Am. Chem. Soc., 2011, 133, 10543–10558 CrossRef PubMed.
- A. Valore, E. Cariati, C. Dragonetti, S. Righetto, D. Roberto, R. Ugo, F. De Angelis, S. Fantacci, A. Sgamellotti, A. Macchioni and D. Zuccaccia, Chem. – Eur. J., 2010, 16, 4814–4825 CrossRef CAS PubMed.
Footnotes |
| † Electronic supplementary information (ESI) available. CCDC 1981001. For ESI and crystallographic data in CIF or other electronic format see DOI: 10.1039/d1cp03341g |
| ‡ The F2 atom presents disorder and it is defined with 2 positions F2A and F2B in cif file. |
§ The quenching rate constants are extracted from 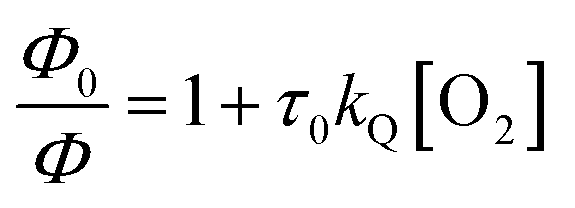 with Φ0 being PLQY deaerated, Φ PLQY under air, τ0 deaerated lifetime and [O2] the concentration of molecular oxygen in the solvent under normal pressure at r.t. with Φ0 being PLQY deaerated, Φ PLQY under air, τ0 deaerated lifetime and [O2] the concentration of molecular oxygen in the solvent under normal pressure at r.t. |
| This journal is © the Owner Societies 2021 |