 Open Access Article
Creative Commons Attribution 3.0 Unported Licence
Photoelectron spectroscopy of the protoporphyrin IX dianion
Jemma A.
Gibbard
 ,
Connor J.
Clarke
 and
Jan R. R.
Verlet
 *
*
Department of Chemistry, Durham University, Durham, DH1 3LE, UK. E-mail: j.r.r.verlet@durham.ac.uk
First published on 16th August 2021
Abstract
Two-dimensional photoelectron spectroscopy using nanosecond and femtosecond lasers has been used to study the protopophyrin IX dianion at photon energies between 1.8–4.1 eV. The photoelectron spectra indicated the presence of two direct detachment channels, tunnelling through the repulsive Coulomb barrier (RCB) and thermionic emission from monoanions. A direct detachment feature suggested a near 0 eV electron affinity, which may be attributable to the repulsive through space interaction of the unshielded carboxylate groups. The minimum height of the repulsive Coulomb barrier (RCB) was found to be between 1.4–1.9 eV. Adiabatic tunnelling through the RCB was seen to occur on a timescale faster than rotational dephasing of the molecule. The observation of thermionic emission below the RCB in the nanosecond spectra originated from monoanions, which were produced via photon-cycling of the dianion.
1 Introduction
Porphyrins are macrocycles with highly conjugated π systems, that are ubiquitous in biology. In nature porphyrins play an important role in photosynthesis, sensing, and oxygen transport.1 Protoporphyrin IX is especially important, as coordination with iron results in heme, which is the O2 binding centre found in haemoglobin and myoglobin. The focus of much recent work has been to utilize the intense visible absorption bands, which are characteristic of porphyrins, as photocatalysts and photosensitisers for technological applications.2,3 In order to optimize the suitability of porphyrins for these applications, it is important to gain a detailed understanding of the electronic structure, which is known to be strongly affected by the presence of a metal, the solvent and substituents on the ring.4 In this manuscript we present a one-colour nanosecond (ns) and femtosecond (fs) photoelectron spectroscopy study of the doubly deprotonated protoporphyrin IX dianion (PP2−), recorded at a range of photon energies between 1.8–4.1 eV.Generally, porphyrins consist of four pyrrole rings connected by methine bridges. Gouterman described the electronic structure of metalloporphyrins (D4h) in terms of a four orbital model, consisting of 18 π electrons on a ring.4 This model results in a weak degenerate pair of transitions known as the Q band and a more intense pair of degenerate transitions known as the B or Soret band. Typically, in low resolution spectroscopy of D4h porphyrins, the Q band is observed as two peaks, due to an extended vibronic progression with a width of approximately 1500 cm−1. If the metal centre is removed, the symmetry of the porphyrin is reduced to D2h, and the degeneracy of the pairs of electronic states which constitute the Q and B bands are lifted. This so called “free-base” signature results in a Qx, Qy, Bx and By band, where the splitting between the Bx and By bands is often too small to be experimentally observed.5 Excitation of the first excited singlet state (S1) results in the Q band in the visible region, whereas excitation of the second excited singlet state (S2) results in the B band near 400 nm. All of the observed spectral bands originate from π → π* transitions.
Porphyrins have been studied in the gas phase using mass6 and ion mobility7,8 spectrometry, as well as infrared,9 photodissociation10 and photoelectron spectroscopy.11–14 Protoporphyrin IX is a D2h porphyrin with two propionic acid groups as substituents on the macrocycle, which can form a carboxylate monoanion or dicarboxylate dianion following the removal of one or two protons. The structure of PP2− is shown in Fig. 1. To date there have been two gas phase measurements of the absorption spectrum of protoporphyrin IX anions.5,15 Wyer et al. recorded the gas phase photodissociation action spectra of deprotonated protoporphyrin IX anion and ZnPP−, by monitoring the formation of neutral fragments in an electrostatic storage ring.15 Following the absorption of a photon, internal conversion back to the electronic ground state produced vibrationally excited anions, which dissociated into anionic and neutral fragments. The dominant dissociation channel was loss of CO2. The higher energy transition of the Qx band, plus the Qy and B bands, were observed in the action spectra, where the spectral features were broadened by hotbands from the room temperature anions. A more recent study by Zagorec-Marks et al. recorded the electronic spectra of deprotonated protoporphyrin IX monoanions and PP2− at cryogenic temperatures using N2 messenger action spectroscopy.5 The lower vibrational temperature reduced spectral congestion and allowed the low energy transitions of the Qx band to be resolved. The action spectra of the monoanion and dianion are very similar, as the structure of the macrocycles are almost identical in both cases. However, slightly smaller spacings between bands were observed in the PP2− spectrum compared to the monoanion, which was ascribed to the increased strength of the local electric field.
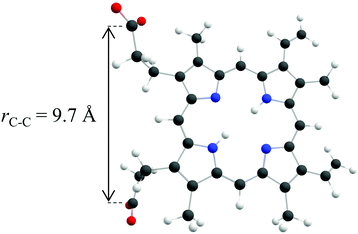 | ||
| Fig. 1 The structure of PP2− as calculated by Zagorec-Marks et al.,5 with C atoms in grey, O atoms in red, H atoms in white and N atoms in blue. The internuclear distance between the carbon atoms located in each of the two carboxylate groups is 9.7 Å. | ||
In addition to photodissociation spectroscopy, there have been studies aimed at probing the electronic structure of porphyrin anions using photoelectron spectroscopy. Wang and coworkers studied phthalocyanine tetrasulfonate trianions and tetraanions with copper and sodium counteranions, which resulted in the first observation of a molecule with negative electron binding energy.11,12 More recently, Kappes and coworkers have used photoelectron spectroscopy to study manganese, copper and palladium meso-tetra (4-sulphonatophenyl) porphyrin (TPPS) polyanions and the corresponding dimers and trimers.13,14 Electron loss was observed to occur via direct detachment, as well as delayed emission via tunnelling from the S1 and T1 states in [PdTPPS]4−.13 To date there have been no photoelectron spectroscopy studies of PP2−.
Multiply charged anions are common in the condensed phase, where solvation stabilizes the excess charges. Over the last couple of decades there have been several gas-phase studies of isolated polyanions using photoelectron spectroscopy.16–19 This work has revealed that polyanions exhibit a distinct electronic structure compared to monoanions, characterized by the presence of a repulsive Coulomb barrier (RCB).17,20–24 In polyanions the interplay between long range Coulomb repulsion and short range attractive forces, result in the RCB to electron detachment, which in turn causes the characteristic low electron kinetic energy (eKE) cut-off observed in the photoelectron spectra of polyanions. PP2− is an interesting case where a balance between the binding energy, RCB heights and the low energy transitions can result in complex electron dynamics. The aim of the present study is to explore the electronic structure of PP2− using photoelectron spectroscopy in an attempt to determine the aforementioned properties and how these lead to electron emission from the system.
2 Experimental methods
The experimental apparatus has been described in detail elsewhere,25,26 and so only a brief description will be included here. PP2− was produced via electrospray ionization of a 0.5 mM solution of protoporphyrin IX disodium salt (Sigma-Aldrich) in methanol. Anions were desolvated in a capillary and stored in a ring electrode ion trap, before ejection into a Wiley-McLaren time-of-flight spectrometer. Photoelectrons were produced via the intersection of the mass-selected anion packet with a laser pulse. Some experiments were undertaken using ns laser pulses (photon energy accuracy of ±0.025 eV) in the visible and UV, produced using a Nd:YAG pumped optical parametric oscillator. Other experiments used femtosecond laser pulses produced using an optical parametric amplifier pumped by a Ti:Sapphire oscillator and amplifier centred at 800 nm. The photoelectrons were imaged on a dual microchannel plate detector, in a velocity map imaging setup.27 The raw data was deconvoluted using the polar onion-peeling algorithm,28 which results in the eKE spectrum and the photoelectron anisotropy distribution. The electron detector was calibrated using the photodetachment of iodide and has a resolution of ≈5%.3 Results
One-colour photoelectron spectroscopy of PP2− was performed using ns or fs lasers at multiple photon energies between 1.8 eV and 4.1 eV. The photoelectron spectra are all normalised to the maximum peak intensity recorded at each photon energy, in order to improve the clarity of the data and aid comparison between different photon energies. Additionally, an electronic action spectrum of PP2− was recorded by collecting the total photoelectron signal as a function of ns laser photon energy between 1.9 eV and 2.75 eV.3.1 ns photoelectron spectroscopy
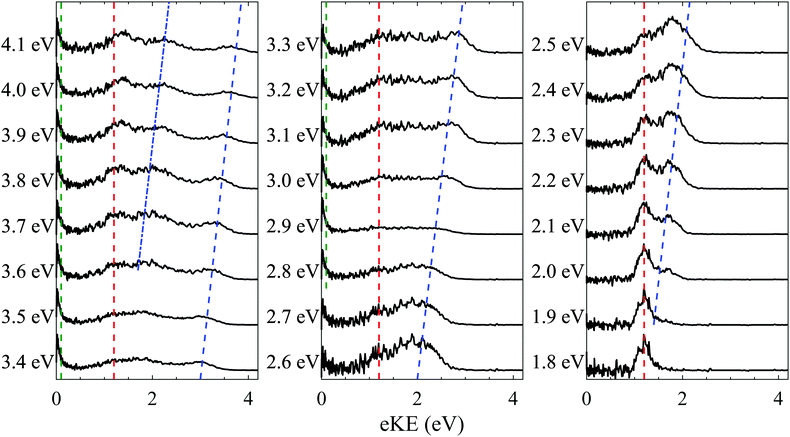
One-colour ns photoelectron spectra were recorded for PP2− at photon energies (hν) between 1.8 eV to 4.1 eV, in 0.1 eV increments, and are shown in Fig. 2. Four distinct features are observed in the spectra; a feature at eKE = 0 eV above hν = 2.6 eV (green dashed line), a relatively sharp feature centred at eKE = 1.2 eV (red dashed line), and a pair of peaks which shift to higher eKE with increasing photon energy (blue dashed and dotted lines). The impact of the RCB is most clearly observed for spectra recorded at lower photon energies (hν < 2.6 eV). The observation of photoelectrons with a fixed eKE is indicative of tunnelling through the RCB from an excited state, as has been observed for other dianions.29–31 The fixed eKE of such electron emission has been attributed to an adiabatic tunnelling process, whereby internal energy in the dianion is conserved in the monoanion formed following electron loss. Similar emission features are also evident in tunnelling through electronic barriers in the autodetachment of anions.32,33 The height of the RCB can be estimated from this tunnelling feature as well as the onset of direct detachment. The latter can be identified as the feature (blue dashed line) increasing in eKE as the photon energy increases. This first becomes apparent in the photoelectron spectra at hν ≈ 1.9 eV. The lower bound is set by the fact that the tunnelling peak must be below the RCB. Hence, we estimate the RCB to lie in the range 1.4 eV < RCB < 1.9 eV.The direct detachment peak also allows us to estimate the vertical and adiabatic detachment energies of PP2− to be VDE = 0.5 eV and ADE ≈ 0 eV, respectively. As mentioned, the onset of the direct detachment peak at hν ≈ 1.9 eV indicates that there is sufficient photon energy to overcome the RCB. With increasing photon energy beyond this, the photoelectrons produced via direct detachment have more kinetic energy and more direct detachment is observed. A second shifting peak (blue dotted line) is observed above hν = 3.4 eV and is attributable to a one-photon direct detachment process resulting in a monoanion in a higher lying excited electronic state.
Finally, a structureless peak (green dashed line) at eKE = 0 eV is observed in the higher photon energy spectra (hν > 2.6 eV) as an isotropic feature. As these photoelectrons occur with eKEs lower than the RCB, they must originate from detachment of monoanions. The shape of the feature indicates a statistical process.34–37 By shifting the collection window for electrons (moving the electronic 200 ns gate on the microchannel plate detector), the process can be attributed to thermionic emission. The maximum yield of thermionic emission occurs at hν = 2.9 eV (see Fig. 2), where intensities of the tunnelling and direct detachment features are lowest relative to the thermionic emission feature. This coincides with resonant excitation of the very bright and narrow B band.
Photoelectron imaging additionally allows us to determine anisotropy parameters for each spectral feature. The low eKE feature is isotopic (β2 ≈ 0), as expected for thermionic emission. Both direct detachment features exhibit a slight negative anisotropy (β2 ≈ −0.4) as a result of the RCB guiding the outgoing electron.30,31,38–45 The tunnelling peak has β2 ≈ −0.3, which is more unexpected. This finding suggests that tunnelling is competitive with the timescale of rotational dephasing of the molecule, which is likely on the order of several picoseconds due to the large size of the molecule. Similar observations have been noted previously where time-resolved photoelectron spectroscopy was used to track rotational dephasing through temporal changes in the photoelectron angular distribution.42
3.2 fs photoelectron spectroscopy
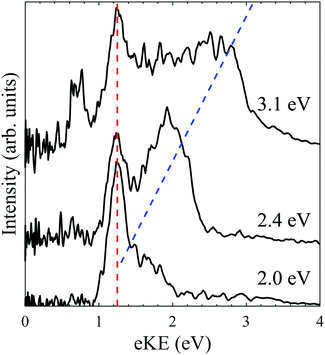
One-colour fs photoelectron spectra of PP2− were recorded at photon energies of 3.1 eV, 2.4 eV and 2.0 eV and are shown in Fig. 3. The shorter laser pulse duration effectively eliminates the likelihood of multiple photon processes occurring.29 The fs spectra are similar to the ns spectra, consisting of a fixed eKE tunnelling feature and a direct detachment feature which shifts with photon energy on an eKE scale, indicated by red and blue dashed lines in Fig. 3. The tunnelling feature peaks at the same eKE and has a similar width in the ns and fs spectra, suggesting that the same tunnelling process occurs regardless of the temporal length of the laser pulse. This indicates that tunnelling is adiabatic, conserves internal energy and occurs following absorption of a single photon. The major difference in the fs spectra, compared to the ns spectra, is that no low eKE feature is observed (green dashed line in Fig. 2), even at hν = 3.1 eV. This evidences that the thermionic emission from monoanions requires a multiple photon process that is enabled by the long pulse duration in the ns spectra. Similar anisotropy is observed for the direct detachment and tunnelling feature in both the ns and fs spectra. Finally, an additional feature is observed at eKE = 0.8 eV in the hν = 3.1 eV spectrum, which is not observed in the ns spectrum recorded at the same wavelength. The origin of this feature is unclear.3.3 Electronic spectroscopy
We have also measured an electronic action spectrum by collecting the total photoelectron signal as a function of photon energy. Based on our photoelectron spectra in Fig. 2, electron loss is always an open channel for PP2−, whether via direct detachment or through tunnelling. The photodetachment action spectrum is shown in Fig. 4. A steep rise in overall electron yield is observed with increasing wavenumber. This is likely due to the opening of the direct detachment channel, which, as shown in Fig. 2, becomes more prominent with increased photon energy. This can be qualitatively explained by a larger available spatial region of the anisotropic RCB, over which the electron can be detached. Hence, the increase in direct detachment yield with increasing photon energy is not correlated with excitation to resonances and we crudely remove this contribution by subtracting an exponentially increasing function from the photodetachment spectrum. The resulting action spectrum has been plotted with the previously reported photodissociation action spectrum of Zagorec-Marks et al., recorded at cryogenic temperatures using a messenger tagging technique.5 Our electronic spectrum shows four distinct features, three of which coincide with features in the previously reported spectrum. It is probable that the feature centred at 17![[thin space (1/6-em)]](https://www.rsc.org/images/entities/char_2009.gif) 500 cm−1 is assignable to the higher energy Qx band, whereas the two features at 18
500 cm−1 is assignable to the higher energy Qx band, whereas the two features at 18![[thin space (1/6-em)]](https://www.rsc.org/images/entities/char_2009.gif) 500 cm−1 and 19
500 cm−1 and 19![[thin space (1/6-em)]](https://www.rsc.org/images/entities/char_2009.gif) 500 cm−1 are attributable to the Qy band. The broader peaks in our spectrum are due to the presence of more internal energy in PP2−. It is likely that the lower energy feature of the Qx band is not observed here as the band is narrow and electron emission might be inhibited by the RCB at lower energies. An additional higher energy peak is observed in our spectrum, which may be attributable to differences in the photodetachment and photodissociation cross-sections of PP2−. The similarity of our electronic spectrum to the one previously reported confirms that we are studying PP2−. Porphyrins are known to aggregate in solution,46 leading to the possibility of dimers and trimers in the gas phase following electrospray ionization. However, no evidence is seen for aggregate polyanions with the same m/z as PP2− in the electronic spectrum.
500 cm−1 are attributable to the Qy band. The broader peaks in our spectrum are due to the presence of more internal energy in PP2−. It is likely that the lower energy feature of the Qx band is not observed here as the band is narrow and electron emission might be inhibited by the RCB at lower energies. An additional higher energy peak is observed in our spectrum, which may be attributable to differences in the photodetachment and photodissociation cross-sections of PP2−. The similarity of our electronic spectrum to the one previously reported confirms that we are studying PP2−. Porphyrins are known to aggregate in solution,46 leading to the possibility of dimers and trimers in the gas phase following electrospray ionization. However, no evidence is seen for aggregate polyanions with the same m/z as PP2− in the electronic spectrum.
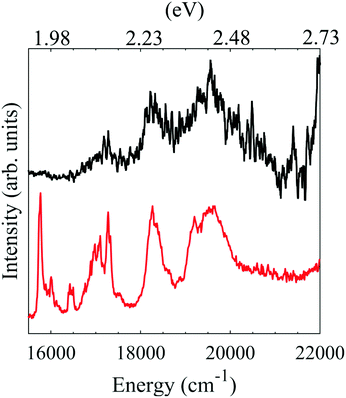 | ||
| Fig. 4 Electronic spectra of PP2−. In black the photodetachment action spectrum recorded here and in red the previously published photodissociation action spectrum recorded by Zagorec-Marks et al.5 | ||
4 Discussion
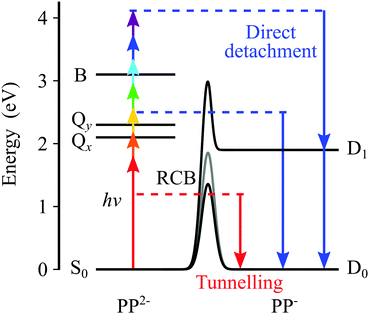
Our findings are summarized in Fig. 5, which shows the electronic states of the dianion, as determined from absorption spectroscopy,5 and the electronic states of the anion, as determined here using photoelectron spectroscopy. The arrows from the S0 state depict the range of photon energies used in the ns laser experiments and the blue downward arrows on the anion side indicate the resulting eKE of the photoelectrons. Direct detachment at hν = 1.8 eV can only result in a monoanion in the electronic ground state, whereas at higher photon energies, for example hν = 4.1 eV, direct detachment can also occur resulting in PP− in the first excited anion state. However, even though the new detachment channel opens up at hν > 1.8 eV, it is not accessible because there is also an RCB associated with the excited state of the anion. The second detachment channel becomes apparent at hν ≈ 3.5 eV, suggesting an RCB similar to that leading to ground state detachment. Fig. 5 also shows the RCBs, and a schematic of tunnelling through the barrier. The photoelectron spectra on the whole are complicated, in part by the complicated nature of the RCB potential and by the many dynamical processes which contribute to the spectra.Following absorption of a photon by PP2− to either the Q or the B bands, there are a number of channels available to yield photoelectrons, some of which may also involve fragmentation. The most likely one-photon channels are,
 | (1) |
 | (2) |
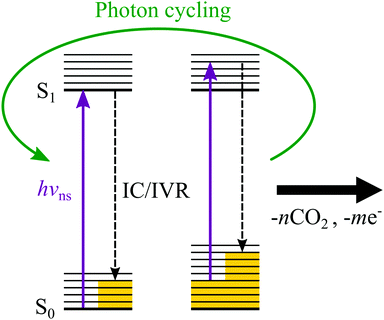
The near eKE = 0 eV feature in the ns spectra shown in Fig. 2 is due to thermionic emission from monoanions (green dashed lines), as evidenced by the appearance of electrons below the RCB. As this feature is only observed when using a ns laser, the formation of the monoanions is a multiple photon process occurring on a slower timescale than the pulse duration of the fs laser. It is likely to originate from photon cycling in the dianion, where following absorption of a photon, internal conversion (IC) and intramolecular vibrational redistribution (IVR) occur to produce dianions with a large amount of internal energy (i.e. heat), which can then absorb an additional photon. This process can repeat a number of times until the dianion undergoes unimolecular decay, either by CO2 loss or electron loss or a combination of both to form monoanions, which then undergo thermionic emission. In the present case, this is facilitated by the strong absorption of the porphyrin macrocycle. A cartoon describing the process of photon cycling is shown in Fig. 6. The relative intensity of the thermionic emission peak was enhanced at hν = 2.9 eV, where the transition to the B band of the dianion is resonant with the photon energy. This resonance enhances the process of photon cycling and results in an increase of the relative intensity of the thermionic emission compared to direct detachment and tunnelling. Such photon-cycling is not possible within a pulse of ≈100 fs duration because there is insufficient time to undergo IC and subsequent IVR.
Returning to the direct photodetachment channels (reaction (1)), we conclude that VDE ≈ 0.5 eV and ADE ≈ 0 eV. Such low (and even negative) ADEs have been observed previously in porphyrin polyanions.11,12 For example, negative binding energies have been reported for porphyrin tetraanions with sulphonate substituents and ADE ≈ 1 eV for trianions.11,12 In these the negative charge is localised on the sulphonates. In general a sulphonate group has a very high binding energy (≈5 eV) and consequently, the highest occupied molecular orbital (HOMO) in these tetra- and tri-anions resides on the porphyrin. In PP2−, the charges are localised on the terminal carboxylate anions and, hence, it is informative to compare PP2− to other carboxylate dianions. For aliphatic dicarboxylate dianions, the binding energy decreases as chain length decreases.50 An aliphatic alkyl dicarboxylate dianion with a similar internuclear distance between the carboxylate groups as PP2−, has an ADE ≈ 1.5 eV.50 This is significantly higher than the ADE observed here, which would require an internuclear separation of ≈5 Å using the dicarboxylate dianion as a model. The discrepancy could be attributed to a lower dielectric screening in PP2−. Typically the carboxylates groups in dianions are shielded from each other by the carbon backbone of the molecule, however in PP2− the two carboxylate groups primarily experience a through space interaction, as shown in Fig. 1. However, it is also likely that a range of isomers are present in the 300 K ion beam, in addition to the one shown in Fig. 1. Zagorec-Marks et al. comment that other low-energy isomers are expected where the CO2 moieties are orientated out of the macrocycle plane.5 Such isomers reduce the separation between the CO2 groups to <6 Å, which is predicted to result in an ADE of <0.4 eV.50 However, an isomer in which the two CO2 groups are adjacent to each other would be unfavoured due to the much stronger Coulomb repulsion. An alternative explanation is that dimers of PP2− are also present in the anion beam, because the dimer PP24− would have the same m/z. However, we feel this is unlikely because the action spectrum (Fig. 4) is very similar to that of the PP2− and because the dimer tetraanion has not been observed in the gas phase before.5 Moreover, dimerization is promoted by hydrogen bonding between the carboxylic acid groups, but these are deprotonated in PP24−.9
The overall picture of the processes occurring in PP2− is complex, not only because both decarboxylation and electron loss are open channels, but also because electrons can be emitted from different sites in the molecule. Direct detachment takes place from the carboxylate groups, while resonant tunnelling occurs on the porphyrin ring, leading to a Zwitterionic anion. How charge then flows in this system to lead to further photoabsorption, decarboxylation, and thermionic emission is an open question. We have attempted time-resolved photoelectron spectroscopy,13 with the aim of probing these channels and the internal conversion dynamics from the Q band, but our experiments did not generate sufficient pump–probe signals.
5 Conclusions
PP2− has been studied using frequency resolved photoelectron spectroscopy with ns and fs lasers over a photon energy range of 1.8 to 4.1 eV. For PP2− direct detachment features indicate an adiabatic detachment energy of ≈0 eV. A sharp tunnelling feature is observed in both the ns and fs spectra showing that tunnelling is adiabatic and occurs on a timescale faster than rotational dephasing of the molecule. In the ns spectra a low eKE feature is present, where photon-cycling results in vibrationally excited PP2− which undergoes unimolecular decay, and the resulting monoanions subsequently undergo thermionic emission.Conflicts of interest
There are no conflicts to declare.Acknowledgements
We would like to thank Prof. J. Mathias Weber and Dr W. Zagorec-Marks for useful discussions about the electronic spectrum of PP2−. Jemma A. Gibbard is grateful for support from a Ramsay Memorial Fellowship. Connor J. Clarke thanks Durham University for a Durham Doctoral Scholarship. This work was supported by the EPSRC (EP/V047787/1).References
- C. U. Carlsen, J. K. Møller and L. H. Skibsted, Coord. Chem. Rev., 2005, 249, 485–498 CrossRef CAS.
- S. H. Kang, M. J. Jeong, Y. K. Eom, I. T. Choi, S. M. Kwon, Y. Yoo, J. Kim, J. Kwon, J. H. Park and H. K. Kim, Adv. Energy Mater., 2017, 7, 1602117 CrossRef.
- A. Yella, H.-W. Lee, H. N. Tsao, C. Yi, A. K. Chandiran, M. Nazeeruddin, E. W.-G. Diau, C.-Y. Yeh, S. M. Zakeeruddin and M. Grätzel, Science, 2011, 334, 629–634 CrossRef CAS PubMed.
- M. Gouterman, J. Mol. Spectrosc., 1961, 6, 138–163 CrossRef CAS.
- W. Zagorec-Marks, J. E. T. Smith, M. M. Foreman, S. Sharma and J. M. Weber, Phys. Chem. Chem. Phys., 2020, 22, 20295–20302 RSC.
- T. Karpuschkin, M. M. Kappes and O. Hampe, Angew. Chem., Int. Ed., 2013, 52, 10374–10377 CrossRef CAS PubMed.
- U. Schwarz, M. Vonderach, M. Kappes, R. Kelting, K. Brendle and P. Weis, Int. J. Mass Spectrom., 2013, 339-340, 24–33 CrossRef CAS.
- K. Brendle, U. Schwarz, P. Jäger, P. Weis and M. Kappes, J. Phys. Chem. A, 2016, 120, 8716–8724 CrossRef CAS PubMed.
- J. Seo, J. Jang, S. Warnke, S. Gewinner, W. Schöllkopf and G. von Helden, J. Am. Chem. Soc., 2016, 138, 16315–16321 CrossRef CAS PubMed.
- P. Jäger, K. Brendle, E. Schneider, S. Kohaut, M. K. Armbruster, K. Fink, P. Weis and M. M. Kappes, J. Phys. Chem. A, 2018, 122, 2974–2982 CrossRef PubMed.
- X.-B. Wang, K. Ferris and L.-S. Wang, J. Phys. Chem. A, 2000, 104, 25–33 CrossRef CAS.
- X.-B. Wang and L.-S. Wang, Nature, 1999, 400, 245–248 CrossRef CAS.
- P. Jäger, K. Brendle, U. Schwarz, M. Himmelsbach, M. K. Armbruster, K. Fink, P. Weis and M. M. Kappes, J. Phys. Chem. Lett., 2016, 7, 1167–1172 CrossRef PubMed.
- U. Schwarz, M. Vonderach, M. K. Armbruster, K. Fink, M. M. Kappes and P. Weis, J. Phys. Chem. A, 2014, 118, 369–379 CrossRef CAS PubMed.
- J. A. Wyer, C. S. Jensen and S. Brøndsted Nielsen, Int. J. Mass Spectrom., 2011, 308, 126–132 CrossRef CAS.
- L.-S. Wang and X.-B. Wang, J. Phys. Chem. A, 2000, 104, 1978–1990 CrossRef CAS.
- X.-B. Wang and L.-S. Wang, Annu. Rev. Phys. Chem., 2009, 60, 105–126 CrossRef CAS PubMed.
- J. R. R. Verlet, D. A. Horke and A. S. Chatterley, Phys. Chem. Chem. Phys., 2014, 16, 15043–15052 RSC.
- F. Martinez, N. Iwe, M. Müller, K. Raspe, L. Schweikhard, J. Tiggesbäumker and K.-H. Meiwes-Broer, Phys. Rev. Lett., 2021, 126, 133001 CrossRef CAS PubMed.
- M. K. Scheller, R. N. Compton and L. S. Cederbaum, Science, 1995, 270, 1160–1166 CrossRef CAS.
- A. I. Boldyrev, M. Gutowski and J. Simons, Acc. Chem. Res., 1996, 29, 497–502 CrossRef CAS.
- C.-F. Ding, X.-B. Wang and L.-S. Wang, J. Phys. Chem. A, 1998, 102, 8633–8636 CrossRef CAS.
- A. Dreuw and L. S. Cederbaum, Chem. Rev., 2002, 102, 181–200 CrossRef CAS PubMed.
- X.-B. Wang, X. Yang and L.-S. Wang, Int. Rev. Phys. Chem., 2002, 21, 473–498 Search PubMed.
- J. Lecointre, G. M. Roberts, D. A. Horke and J. R. R. Verlet, J. Phys. Chem. A, 2010, 114, 11216–11224 CrossRef CAS PubMed.
- L. H. Stanley, C. S. Anstöter and J. R. R. Verlet, Chem. Sci., 2017, 8, 3054–3061 RSC.
- D. A. Horke, G. M. Roberts, J. Lecointre and J. R. R. Verlet, Rev. Sci. Instrum., 2012, 83, 063101 CrossRef PubMed.
- G. M. Roberts, J. L. Nixon, J. Lecointre, E. Wrede and J. R. R. Verlet, Rev. Sci. Instrum., 2009, 80, 053104 CrossRef CAS PubMed.
- D. A. Horke, A. S. Chatterley and J. R. R. Verlet, J. Chem. Phys., 2013, 139, 084302 CrossRef PubMed.
- D. A. Horke, A. S. Chatterley and J. R. R. Verlet, Phys. Rev. Lett., 2012, 108, 083003 CrossRef PubMed.
- P. D. Dau, H.-T. Liu, J.-P. Yang, M.-O. Winghart, T. J. A. Wolf, A.-N. Unterreiner, P. Weis, Y.-R. Miao, C.-G. Ning, M. M. Kappes and L.-S. Wang, Phys. Rev. A: At., Mol., Opt. Phys., 2012, 85, 064503 CrossRef.
- C. S. Anstöter, J. N. Bull and J. R. Verlet, Int. Rev. Phys. Chem., 2016, 35, 509–538 Search PubMed.
- G. Mensa-Bonsu, A. Lietard, D. J. Tozer and J. R. R. Verlet, J. Chem. Phys., 2020, 152, 174303 CrossRef CAS PubMed.
- B. Baguenard, J. C. Pinaré, C. Bordas and M. Broyer, Phys. Rev. A: At., Mol., Opt. Phys., 2001, 63, 023204 CrossRef.
- B. Baguenard, J. Pinaré, F. Lépine, C. Bordas and M. Broyer, Chem. Phys. Lett., 2002, 352, 147–153 CrossRef CAS.
- K. Hansen, K. Hoffmann and E. E. B. Campbell, J. Chem. Phys., 2003, 119, 2513–2522 CrossRef CAS.
- M. Kjellberg, O. Johansson, F. Jonsson, A. V. Bulgakov, C. Bordas, E. E. B. Campbell and K. Hansen, Phys. Rev. A: At., Mol., Opt. Phys., 2010, 81, 023202 CrossRef.
- X.-P. Xing, X.-B. Wang and L.-S. Wang, J. Chem. Phys., 2009, 130, 074301 CrossRef PubMed.
- X.-P. Xing, X.-B. Wang and L.-S. Wang, J. Phys. Chem. A, 2009, 113, 945–948 CrossRef CAS PubMed.
- X.-P. Xing, X.-B. Wang and L.-S. Wang, J. Phys. Chem. A, 2010, 114, 4524–4530 CrossRef CAS PubMed.
- E. Papalazarou, C. Cauchy, T. Barillot, B. Bellina, J. Maurelli, M. Barbaire, C. Clavier, F. Bertorelle, R. Antoine, I. Compagnon, A. R. Allouche, C. Bordas, P. Dugourd and F. Lépine, Analyst, 2012, 137, 3496–3501 RSC.
- D. A. Horke, A. S. Chatterley and J. R. R. Verlet, J. Phys. Chem. Lett., 2012, 3, 834–838 CrossRef CAS PubMed.
- A. S. Chatterley, D. A. Horke and J. R. R. Verlet, Phys. Chem. Chem. Phys., 2012, 14, 16155–16161 RSC.
- C. W. West, J. N. Bull, D. A. Woods and J. R. Verlet, Chem. Phys. Lett., 2016, 645, 138–143 CrossRef CAS.
- M. E. Castellani, D. Avagliano, L. González and J. R. R. Verlet, J. Phys. Chem. Lett., 2020, 11, 8195–8201 CrossRef CAS PubMed.
- L. M. Scolaro, M. Castriciano, A. Romeo, S. Patanè, E. Cefalì and M. Allegrini, J. Phys. Chem. B, 2002, 106, 2453–2459 CrossRef CAS.
- J. A. Gibbard, E. Castracane, A. J. Shin and R. E. Continetti, Phys. Chem. Chem. Phys., 2020, 22, 1427–1436 RSC.
- Z. Lu and R. E. Continetti, J. Phys. Chem. A, 2004, 108, 9962–9969 CrossRef CAS.
- T. G. Clements and R. E. Continetti, J. Chem. Phys., 2001, 115, 5345–5348 CrossRef CAS.
- L.-S. Wang, C.-F. Ding, X.-B. Wang and J. B. Nicholas, Phys. Rev. Lett., 1998, 81, 2667–2670 CrossRef CAS.
| This journal is © the Owner Societies 2021 |

