 Open Access Article
Stationary stripe patterns and chemical waves on the bimetallic Rh(110)/Ni surface during the H2 + O2 reaction
Mathias
Homann
and
Ronald
Imbihl
 *
*
Institut für Physikalische Chemie und Elektrochemie, Leibniz-Universität Hannover; Callinstrasse 3A, 30167 Hannover, Germany. E-mail: Imbihl@pci.uni-hannover.de
First published on 20th August 2021
Abstract
Chemical wave patterns that develop in the O2 + H2 reaction on a bimetallic Rh(110)/Ni surface have been studied with photoelectron emission microscopy (PEEM) in the 10−6 to 10−4 mbar range. The bifurcation diagram for Ni coverages up to 3 monolayers (ML) was mapped out for T = 770 K. Stationary concentration patterns of macroscopic stripes as well as target patterns and irregular chemical waves were observed.
1. Introduction
Chemical wave patterns and rate oscillations in heterogeneously catalyzed reactions have been extensively investigated in the past three decades on the noble metal single crystal surfaces of Pt, Rh and Pd.1,2 Despite the fact that bimetallic catalysts play a prominent role in catalysis, only very few studies focus on pattern formation on alloyed surfaces.3–7 The addition of a second component which is mobile and exhibits a different reactivity may lead to the formation of stationary concentration patterns as demonstrated with in the O2 + H2 reaction on a potassium promoted Rh(110) surface and on a Rh(110) surface with gold.6,7 The concept of reactive phase separation applies to these systems.The combination of two similar metals with only a minor difference in reactivity is another interesting case. Depositing monolayer coverages of Ni onto a Rh(111) surface transforms the system that was originally bistable in the O2 + H2 reaction into an excitable system displaying chemical waves and rate oscillations.8–11 As demonstrated by in situ X-ray photoelectron spectroscopy (XPS), the chemical waves are associated with a periodic formation and reduction of Ni oxide.11 This mechanism, well known under the name “oxide model”, has been used to describe kinetic oscillation that arise in catalytic CO oxidation under ambient pressure conditions on Pt, Pd and Ir.12,13 The oxide model has also been applied to explain the rate oscillations that occur on in the O2 + H2 reaction on polycrystalline Ni surfaces under ambient pressure conditions.14,15
An additional complexity in Rh/Ni is introduced by the possible diffusion of surface Ni into the bulk region of Rh forming subsurface Ni. A reversible formation of subsurface Ni has originally been suspected to be an essential part of the excitation mechanism for chemical waves.8 Recent studies with spectroscopic low energy electron microscopy (SPELEEM), however, demonstrated that at the temperature where chemical waves are observed, i.e. at 750–800 K, surface Ni does not penetrate the Rh bulk but is laterally redistributed.16,17 In the oxidized state Ni is present as 3D NiO particles which upon reduction spread out as a metallic 2D-film of monolayer thickness. Reoxidation causes the film to coalesce via a 2D-NiO intermediate back into 3D-NiO. Accordingly, the oxide mechanism is coupled with a morphological instability.16 The formation of a 2D-NiO phase on Rh(111) at ≈1 ML Ni coverage had before been demonstrated by the Netzer group.18–20
The formation and reduction of Ni oxide on a Rh substrate is a process which should to a large extent be driven by bulk properties, i.e., by the different chemical affinity of oxygen to Ni as compared to a noble metal. Henceforth, in the combination Ni/Rh, the oscillatory properties should exist irrespective of the orientation of the Rh substrate. A second energetic contribution to the growth of an oxide are the interfacial energies and these will vary with the orientation of the metallic substrate. In order to see which contributions are dominant, we studied the O2 + H2 reaction on Rh(110)/Ni. The Rh(110) surface which is thermodynamically less stable than Rh(111) is well known for its structural variability as evidenced by a large number of O- and N-induced reconstructions.21,22
In a first study we investigated oxidation and reduction of monolayer coverages of Ni on Rh(110).23 Surprisingly after exposure to O2 the Ni signal in Auger electron spectroscopy (AES) nearly vanished; titration with H2 restored the Ni signal. Diffusion of Ni into subsurface sites would be a possible explanation but in the light of recent results with Rh(111)/Ni the formation of 3D-NiO particles is clearly a more convincing cause for the strong decrease of the Ni signal upon oxidation.16
Exposing the Rh(110)/Ni sample to an O2 + H2 atmosphere leads to the appearance of chemical waves. Here we report on these chemical wave patterns which were studied at T = 770 K in a Ni coverage range from 0.3 to 3 ML. Although the basic excitation mechanism appears to be similar to Rh(111)/Ni, one observes also novel type of patterns that have not been found on Rh(111)/Ni.
2. Experimental
All experiments were carried out in two standard UHV chambers equipped with a photoelectron emission microscope (PEEM), LEED optics, and an Auger electron spectrometer (AES) with cylindrical mirror analyzer. In PEEM experiments a deuterium discharge lamp (6.5 eV, wavelength ≈ 160–400 nm) is used for the excitation of photoelectrons.24,25 The ejected electrons are imaged via a three-lens optics onto a phosphorous screen. The spatial resolution is around 0.1–1 μm, the time resolution is that of video images (1/25 s).Sample preparation was done by repetitive cycles of Ar+-ion sputtering (5 × 10⁻⁵ mbar) at room temperature followed by oxidation at p(O2) = 1 × 10⁻⁶ mbar, T = 1000 K and a flash heat to 1200–1300 K. After this procedure no impurities were detectable with AES. The temperature is measured with a K type Ni/NiCr thermocouple.
Nickel is deposited via electron beam evaporation (Omicron) from a nickel rod (Goodfellow, 99,99 + %). The amount of deposited Ni is characterized with AES through the ratio Ni848/Rh302 of the Ni peak at 848 eV to the Rh peak at 302 eV. For calibration of the Ni coverage the change in the slope of a plot of the ratio Ni848/Rh302vs. the Ni exposure was taken as evidence for completion of one monolayer.23 The data indicate a similar growth mode of Ni on Rh(110) as on Rh(111) but since an experimental verification of the growth mode is missing, this calibration should be considered as tentative. Ni is always deposited at 300 K. The Ni coverages given in this report are the initial coverages measured immediately after deposition at 300 K.
The gases O2 and H2 (purity 5.6 and 5.0, both from Linde) are introduced via leak valves. Pressures are measured with an ionization gauge (uncorrected).
3. Results
3.1 Overview
In principle, two approaches can be taken to obtain reproducible results with a system where one component can diffuse into subsurface sites. Firstly, start each experiment with a freshly prepared surface obtained after sputtering away remnants of the preceding experiment and after depositing a new layer of Ni. The second approach would be to saturate the near surface region of the Rh crystal with Ni so that over the duration of an experiment the amount of Ni in the topmost layers practically remains constant. Both approaches are taken here.3.2 Freshly deposited Ni
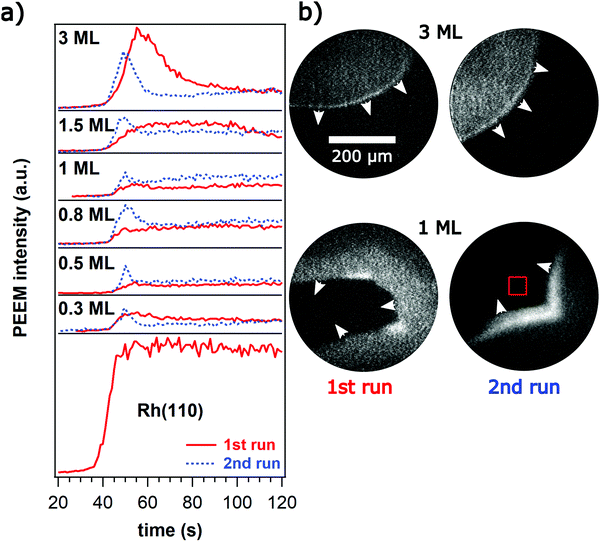
The experiments always start with a freshly deposited Ni layer after cleaning the Rh(110) surface from the Ni deposits of earlier experiments by sputtering. Before introducing H2 the sample was kept in O2 with p(O2) = 1 × 10⁻⁵ mbar at T = 770 K for some minutes. This procedure may lead to oxide formation but in the PEEM experiments we have no experimental technique available to verify this point.Introducing H2 does typically not lead right away to pattern formation. p(H2) is then increased until formation of an “activating” front occurs. These activating fronts are reproduced in Fig. 1 for different Ni coverages.
The activating fronts transform the initial state of an oxygen covered surface appearing dark in PEEM into a reduced state showing up by a brighter grey level in PEEM. Near the front a relative maximum in brightness is seen. Each experiment with a given Ni coverage is at least reproduced once (without depositing a new Ni layer). Turning off the reaction gases and starting a new experiment leads again to an activating front depicted by dotted lines in Fig. 1a. One realizes that the relative maximum in brightness changes significantly between the different runs. The data in Fig. 1 clearly reveal a memory effect as the surface properties are changed after passage of the first front.
PEEM images primarily the local work function (WF) and therefore contains no or only indirect chemical information. Adsorbed oxygen on Rh(110) increases the WF considerably by roughly 1 eV at maximum;26 with some confidence the dark area in PEEM can therefore be assigned to an oxygen covered surface. For bright areas in PEEM the assignment is more difficult since both, an oxygen free surface as well as Ni-oxide appear bright in PEEM due to their lower WF.8
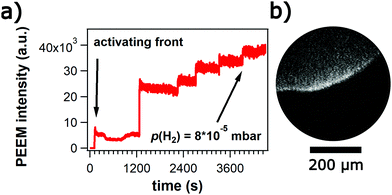
The Rh(110) surface without the addition of Ni displays bistability in the O2 + H2 reaction.27,28 In the unreactive state a high oxygen coverage inhibits H2 adsorption whereas in the reactive state a low oxygen coverage allows both gases to adsorb and react. Transitions between the two states occur via propagating reaction fronts. Deposition of 0.3 ML Ni does not change bistability and even the critical p(H2) at which a front is ignited that removes the O-coverage is not shifted by the Ni component. What is different now, however, is that the brightness of the O-freed part which is constant on the pure Rh(110) surface rises with increasing p(H2) as shown in Fig. 2.
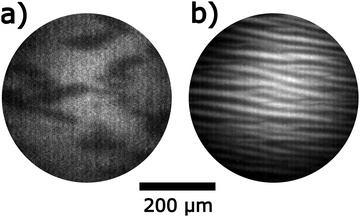
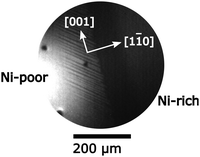
At θNi = 0.5 an activating front is ignited upon increasing p(H2) as the ratio p(H2)/p(O2) reaches 0.8. The activating front is followed by irregular chemical wave patterns as demonstrated in Fig. 3a. One observes pulses but they do not form regular structures such as target patterns or spiral waves. Increasing p(H2)/p(O2) beyond 1.2 terminates the irregular wave pattern and a stationary stripe pattern evolves within minutes as shown in Fig. 3b. The stripes are not oriented along the main crystallographic axes of Rh(110) but exhibit an angle of 35° with respect to the [1![[1 with combining macron]](https://www.rsc.org/images/entities/char_0031_0304.gif) 0]-direction. Within the observation time of roughly 3000 s no changes in the stripes are detectable. Further increase of p(H2) up to 10−4 mbar does not cause any notable change in the wavelength of the pattern. Only the surrounding background brightens with increasing p(H2) similar to the behavior visible in Fig. 2.
0]-direction. Within the observation time of roughly 3000 s no changes in the stripes are detectable. Further increase of p(H2) up to 10−4 mbar does not cause any notable change in the wavelength of the pattern. Only the surrounding background brightens with increasing p(H2) similar to the behavior visible in Fig. 2.
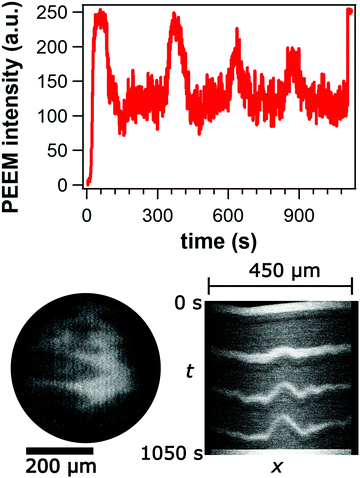
At Ni coverages larger than θNi = 0.5 ML, the qualitative behavior is rather similar to that at θNi = 0.5 except that no stripe pattern is formed. Irregular chemical wave patterns develop after an activating front has been ignited at p(H2)/p(O2) = 0.8. Such an irregular chemical wave pattern recorded from a surface with 1.5 ML Ni is displayed in Fig. 4. When the ratio p(H2)/p(O2) exceeds 1.2, the surface is transformed into a stable low O-coverage state showing up as a uniformly bright area in PEEM.
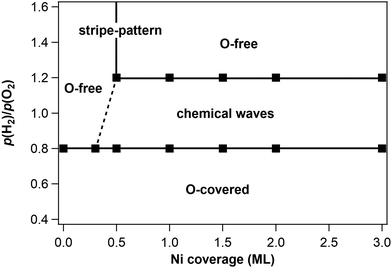
The bifurcation diagram of the H2 + O2 reaction on Rh(110)/Ni has been mapped out for T = 770 K, fixed p(O2) = 1 × 10⁻⁵ mbar and varying Ni coverages up to θNi = 3 ML using p(H2) as control parameter. The starting point for each Ni coverage is a surface with freshly deposited Ni at 300 K. After heating up the sample in O2 from 300 K to 770 K, H2 is introduced. The changes of the surface observed in PEEM during up-ramping p(H2) are summarized in the bifurcation diagram of Fig. 5.
Remarkably, the two boundaries of the excitable range, O-covered/excitable at low p(H2) and excitable/low O-coverage at high p(H2), are both horizontal lines, i.e. they do not depend on the Ni coverage. On Rh(111)/Ni a critical Ni coverage of Ni, θNi,crit = 0.13 was necessary to generate excitability in the O2 + H2 reaction at T = 770 K.9 The diagram in Fig. 5 shows that for Rh(110)/Ni the critical Ni coverage lies between 0.3 and 0.5 ML. According to the bifurcation diagram stationary stripe patterns are only found in the immediate vicinity of θNi = 0.5. On a surface inhomogeneously covered with Ni, stripe patterns can also develop as demonstrated in Fig. 6. An inhomogeneous Ni deposition is achieved by moving the sample a few millimeters away from the centered position with respect to the Ni evaporator.
3.3 Alloyed Rh(110)/Ni surface
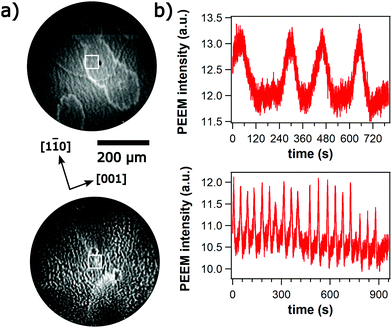
Nickel is deposited onto Rh(110) until the Rh302 signal is no longer visible in AES. After exposure to reaction conditions, sputtering, depositing two more ML of Ni, a stable ratio of Ni848/Rh302 is reached that changes only slightly after an experiment with chemical waves. Neglecting the contribution of deeper layers to the Ni signal and taking the data from the monolayer calibration, this ratio corresponds to a Ni coverage of ≈0.4 ML.23On such a surface chemical waves can be sustained for several hours. Upon adjusting reaction conditions, the waves appear spontaneously without induction period. Fig. 7 illustrates the different types of chemical waves observed in the 10−5 and 10−4 mbar range. The bright bands in the target pattern in Fig. 7a marking propagating pulses exhibit a ragged shape. The target patterns display an elliptical shape with the long axis being oriented along the [1![[1 with combining macron]](https://www.rsc.org/images/entities/char_0031_0304.gif) 0]-direction which is the direction of the (110) troughs.
0]-direction which is the direction of the (110) troughs.
The average period which is around 200 s in the 10−5 mbar range decreases to ≈ 60–70 s as the pressure is raised up into the 10−4 mbar range. Due to the presence of many small bright islands the surface looks very rough. The low WF suggests that these islands are 3D-NiO particles.11 With respect to propagating waves these islands behave more or less as inert obstacles, i.e. the chemical waves move around the islands without visibly modifying the islands.
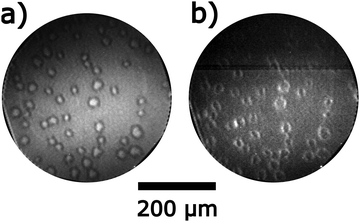
The chemical wave patterns are very stable structures on the alloyed surface but one also encounters some transient structures. Directly, after evaporation of a thick Ni layer causing the disappearance of the Rh302 signal in AES, exposure of the surface at T = 770 K to an O2/H2 atmosphere leads to the growth of circular islands as demonstrated by the PEEM image in Fig. 8a. The islands consist of a bright core surrounded by a dark ring. Turning off H2 causes a reversal of the brightness as shown in Fig. 8b. The dark center is transformed into bright area and the originally bright ring turns dark. Assigning the circular islands to 3D-NiO is consistent with their stability in O2, their low WF in O2 and the isotropic growth of these islands.
In a separate experiment with scanning X-ray photoelectron microscopy (SPEM), large islands had been grown on a 8–9 ML thick Ni layer on Rh(110) followed by an oxidation/reduction cycle at T = 770 K in the 10−6 mbar range. Elemental mapping demonstrated that these very large islands of roughly 100 μm diameter can be assigned to Ni-oxide.23
After a cleaning cycle as described in the Experimental section, a ratio Ni848/Rh302 = 0.016 is obtained that according to the monolayer calibration would correspond to 0.2 ML of Ni.23 Since on the alloyed surface more Ni will be present in deeper layers than on a surface with freshly deposited Ni, due to the additional contribution of subsurface Ni to the Ni signal, the monolayer calibration will no longer be valid. The Ni coverage of 0.2 ML therefore is just a rough estimate.
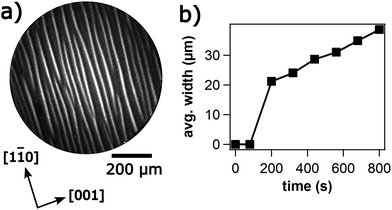
In the 10−5 mbar range attempts to adjust chemical waves are unsuccessful but a stripe pattern evolves depicted in Fig. 9a. Over a period of ≈ 10 min the width of the stripes increases approximately linearly as shown in Fig. 9b. In LEED one observes a (1 × 2) pattern; the high intensity of the half-order beams indicates a surface reconstruction.
A comparison with the stripe pattern obtained after fresh Ni deposition reveals a number of significant differences: (i) the stripes on the alloyed surface are oriented along the [1![[1 with combining macron]](https://www.rsc.org/images/entities/char_0031_0304.gif) 0]-direction whereas the stripes after fresh deposition of 0.5 ML Ni exhibit an angle of 35° with respect to the [1
0]-direction whereas the stripes after fresh deposition of 0.5 ML Ni exhibit an angle of 35° with respect to the [1![[1 with combining macron]](https://www.rsc.org/images/entities/char_0031_0304.gif) 0]-direction. (ii) In contrast to the stripes on a surface with freshly deposited Ni where a region of excitability is crossed before stripes form, no chemical waves develop at low p(H2) on the alloyed surface. (iii) On the surface with freshly deposited Ni, p(H2) can be varied over a large range without the stripe pattern losing its stability. On the alloyed surface, the stripes disappear when the hydrogen pressure is decreased resulting in a uniformly dark surface in PEEM. Increasing p(H2) first causes a growth of the bright stripes and then the pattern is extinguished as a homogenous bright surface is formed.
0]-direction. (ii) In contrast to the stripes on a surface with freshly deposited Ni where a region of excitability is crossed before stripes form, no chemical waves develop at low p(H2) on the alloyed surface. (iii) On the surface with freshly deposited Ni, p(H2) can be varied over a large range without the stripe pattern losing its stability. On the alloyed surface, the stripes disappear when the hydrogen pressure is decreased resulting in a uniformly dark surface in PEEM. Increasing p(H2) first causes a growth of the bright stripes and then the pattern is extinguished as a homogenous bright surface is formed.
4. Discussion
The main finding here is that a modified oxide model verified for the O2 + H2 reaction on Rh(111)/Ni also applies to ultrathin layers of Ni on a Rh(110) surface. The term “modified” refers to the morphological instability of 3D vs. 2D-NiO that plays a decisive role in the excitation mechanism on Rh(111)/Ni.16 Although alloying between Rh and Ni takes undoubtedly place, the alloying apparently plays no major role in the excitation mechanism of the chemical waves. This conclusion is well supported by the bifurcation diagram in Fig. 5. The lower boundary of the excitable range representing the transition from the oxygen covered surface to wave patterns is practically independent of the Ni coverage for θNi > θNi,crit. Mechanistically this behavior can be explained in the following way: If the Ni on the oxygen covered surface is all bound as 3D-NiO, then the small NiO particles will cover only a small fraction of the total surface area. Consequently, the transition of such a surface to a state of low O-coverage will not be different from the transition on a Ni free Rh(110) surface. Here we assume that, the 3D-NiO just acts as an inert site blocking species. This appears to be valid at least for the transition to a state of low O-coverage; subsequently the 3D-NiO of course is chemically transformed in a reduction process but this happens on a time scale much longer than the few seconds during which the transition to a state of low O-coverage takes place.The upper boundary of the excitable range in p(H2) is also independent of the Ni coverage for θNi > 0.5 ML. This result is more difficult to understand. For the O2 + H2 reaction on Rh(111)/Ni, it has been demonstrated that during reduction, part of the 3D-NiO is converted into a metallic 2D-Ni film.16 If such a metallic 2D Ni film is also present as an intermediate in the excitable range on Ni/Rh(110) and if it is this metallic Ni film that determines the boundary excitable/low O-coverage in p(H2) parameter space, then the observed independence of the upper boundary on Ni coverage should be the consequence. Whether the assumptions underlying this explanation actually hold, remains to be shown in future experiments.
A comparison of the bifurcation diagram in Fig. 5 with the bifurcation diagram of the O2 + H2 reaction on Rh(111)/Ni reveals great similarities in the topology of the diagrams as well as in the dependence of the boundaries on the Ni coverage.9 In both systems we have a critical Ni coverage that is required to transform the originally bistable behavior of the system into excitability. On both systems the lower boundary of the excitable range varies little with Ni coverage. The same is true for the upper boundaries for Ni coverages above θNi = 0.3 ML on Rh(111)/Ni. A simple and straight forward explanation for these similarities is that the excitation mechanism is basically identical on both surfaces. It should be added that the experiments on the morphological instability of 3D vs. 2D-NiO that plays a decisive role in the excitation mechanism on Rh(111)/Ni have been conducted at θNi ≈ 1 ML.16 One can expect that the principle mechanism does not change at Ni coverages higher than one monolayer if the excess Ni is bound as 3D-NiO.
For simplicity, the parameter range in which chemical waves are found has been denoted as excitable. In bistable systems that exhibit so-called dynamic bistability, often also called double metastability, one finds basically the same type of patterns such as target patterns or spiral waves as in excitable media. The main observable difference between the two cases is that the patterns in systems with dynamic bistability are typically quite irregular.29 Just from the phenomenology of the patterns found here, one cannot clearly discriminate the two types of behavior against each other; both possibilities should therefore be taken into account.
There is one striking difference in the two bifurcation diagrams which is the appearance of a stripe pattern at θNi = 0.5 ML on Rh(110)/Ni. The fact that the stripe pattern only evolves around θNi = 0.5 ML suggests that at this coverage some ordered overlayer might form on the surface. In fact a (1 × 2) pattern has been observed with LEED on an alloyed surface with a stripe pattern. Judging from the high intensity of the half-order beams a reconstruction phase appears to be very likely. If we assume, for example, that every second of the close-packed [1![[1 with combining macron]](https://www.rsc.org/images/entities/char_0031_0304.gif) 0]-rows consists of Ni, then a (1 × 2) LEED pattern would result and the Ni coverage would be 0.5 ML. However, we have to take into account the possibility that the Ni might not be distributed homogeneously across the surface but might, for example, be concentrated in the stripes. Furthermore, oxygen might be bonded to the Ni atoms so that a kind of ternary Rh–Ni–O phase is formed. All this needs to be clarified in future investigations.
0]-rows consists of Ni, then a (1 × 2) LEED pattern would result and the Ni coverage would be 0.5 ML. However, we have to take into account the possibility that the Ni might not be distributed homogeneously across the surface but might, for example, be concentrated in the stripes. Furthermore, oxygen might be bonded to the Ni atoms so that a kind of ternary Rh–Ni–O phase is formed. All this needs to be clarified in future investigations.
For discussing the driving force for the formation of stationary concentration patterns on Rh(110)/Ni, it is instructive to look at the stripe patterns that develop on a Rh(111) surface with submonolayer coverage of V-oxide during catalytic methanol oxidation.30,31 Since the formation of this stripe pattern occurred under reaction conditions, it was initially assumed that the stripes are a non-equilibrium structure of a Turing-like type. With energetic interactions between the reacting species, this type of pattern formation is described by the concept of reactive phase separation.6 Since the stripes, however, also developed in pure oxygen, it became evident that the stripe formation on Rh(111)/VOx is driven by thermodynamics. For the system here, a corresponding experimental proof is missing. So both possibilities, a thermodynamic driving force and a non-equilibrium structure driven by reactive phase separation should be taken into account.
As pointed out in the Results section, some remarkable differences exist with respect to orientation and stability in H2 between the stripe patterns found on a surface with freshly deposited Ni and the stripe patterns on an alloyed surface. With freshly deposited Ni the stripes exhibited an angle of 35° with respect to the [1![[1 with combining macron]](https://www.rsc.org/images/entities/char_0031_0304.gif) 0]-direction and the stripes did not dissolve at high p(H2). The latter point seems to indicate that the chemical nature of the stripes is different on both surfaces. In any case, the question is what causes the different properties of the stripe patterns? What primarily is different is the amount and the distribution of Ni in the surface and subsurface region on an alloyed surface and on a surface with freshly deposited Ni. It is conceivable that the different amount of Ni on Rh(110) caused the formation of different overlayer structures connected with different catalytic properties. Since in situ LEED was not feasible in our experiments, this point needs to be clarified in future studies.
0]-direction and the stripes did not dissolve at high p(H2). The latter point seems to indicate that the chemical nature of the stripes is different on both surfaces. In any case, the question is what causes the different properties of the stripe patterns? What primarily is different is the amount and the distribution of Ni in the surface and subsurface region on an alloyed surface and on a surface with freshly deposited Ni. It is conceivable that the different amount of Ni on Rh(110) caused the formation of different overlayer structures connected with different catalytic properties. Since in situ LEED was not feasible in our experiments, this point needs to be clarified in future studies.
The main conclusions reached from a comparison of the bifurcation diagrams on Ni/Rh(110) and Rh(111)/Ni were that (i) a modified oxide model describes the excitation mechanism and (ii) that alloying between Rh and Ni plays no major role for the propagating chemical waves.16 Alloying, however, plays a certain role as clearly suggested by the appearance of a stripe pattern and by the sensitive dependence of the stability of the chemical wave patterns on the preparation of the surface. In contrast to wave patterns on a surface with freshly deposited Ni, the chemical waves can be sustained for hours on an alloyed surface. A straight forward explanation would be that in the first case the surface constantly loses Ni as the part of the Ni diffuses into the bulk region whereas in the second case this process is inhibited by a Rh surface already saturated with Ni in the near-surface region.
A tendency of Ni to penetrate the Rh bulk is given already by entropic reasons but since Rh and Ni are completely miscible in the bulk, the mixing process is clearly favored by thermodynamics. Some indication that the surface properties of Rh(110) are modified by Ni is provided by the PEEM experiment with the reaction front in Fig. 1 conducted with θNi = 0.3 ML. The brightness of the oxygen freed part behind the reaction front increases with increasing p(H2) quite in contrast to the clean Rh(110) surface where the brightness remained constant. Apparently in the former case some more tightly oxygen species could be present after removal of the regular chemisorbed oxygen which require a higher p(H2) to be reacted off. Titration experiments with H2 already demonstrated before that the addition of Ni considerably decreases the reactivity of adsorbed oxygen.11 The microscopic picture of whether small 3D-NiO islands are present on such a surface or whether some kind of ternary oxide has been formed is not yet clear.
The activating front modifies the surface properties as the passage of the second front yields a different intensity profile as demonstrated in Fig. 1. An unusual feature of the activating fronts is the appearance of a relative intensity maximum near the front position. Since the relative maximum is absent on the clean Rh(110) surface, it is clear that this feature is Ni-related. An intermediate formation of metallic Ni might be a possible candidate for the enhanced brightness at the front.
5. Conclusions
A Rh(110) surface with an ultrathin layer of Ni exhibits chemical wave patterns in the O2 + H2 reaction similar to Rh(111)/Ni. The similarity of the bifurcation diagrams of the two systems, Rh(110)/Ni and Rh(111)/Ni, suggests that it is basically the same excitation mechanism that is operating in both systems i.e. a modified oxide model in which the Ni layer undergoes a cyclic oxidation and reduction. A striking difference between the two systems is the appearance of a stationary stripe pattern on Rh(110)/Ni. The fact that the existence of this stationary pattern is restricted to a narrow parameter range around θNi = 0.5 ML suggests that an ordered Rh/Ni phase might play an essential role in this type of pattern. A penetration of surface Ni into the Rh bulk undoubtedly takes place under reaction conditions. As clearly demonstrated by comparing a surface with freshly deposited Ni and an alloyed Rh/Ni surface, the stability of the chemical wave patterns is affected by this process. So far there is, however, no indication that the formation of subsurface Ni plays an essential role in the excitation mechanism.Conflicts of interest
There are no conflicts to declare.Acknowledgements
The authors are indebted to the DFG (Deutsche Forschungsgemeinschaft) for financial support.References
- R. Imbihl and G. Ertl, Chem. Rev., 1995, 95, 697 CrossRef CAS.
- R. Imbihl, Nonlinear dynamics on catalytic surfaces, in Handbook of Surface Science, ed. E. Hasselbrink and B. Lundquist, Elsevier, Amsterdam, 2008, vol. 3, ch. 9 Search PubMed.
- J. H. Sinfelt, Bimetallic Catalysts: Discoveries, Concepts, and Applications, John Wiley & Sons, New York, 1983 Search PubMed.
- J. Loboda-Cackovic, A. Hammoudeh, M. S. Mousa and J. H. Block, Vacuum, 1995, 46, 411–415 CrossRef CAS.
- K. Asakura, J. Lauterbach, H. H. Rotemund and G. Ertl, J. Chem. Phys., 1995, 102, 8175–8184 CrossRef CAS.
- Y. De Decker, H. Marbach, M. Hinz, S. Günther, M. Kiskinova, A. S. Mikhailov and R. Imbihl, Phys. Rev. Lett., 2004, 92, 198305 CrossRef CAS PubMed.
- A. Locatelli, T. O. Mentes, L. Aballe, A. Mikhailov and M. Kiskinova, J. Phys. Chem. B, 2006, 110, 19108 CrossRef CAS PubMed.
- F. Lovis, T. Smolinsky, A. Locatelli, M. A. Niño and R. Imbihl, J. Phys. Chem. C, 2012, 116, 4083–4090 CrossRef CAS.
- T. Smolinsky, M. Homann and R. Imbihl, Phys. Chem. Chem. Phys., 2016, 18, 970–973 RSC.
- T. Smolinsky, B. Von Boehn and R. Imbihl, J. Chem. Phys., 2018, 148, 154704 CrossRef.
- T. Smolinsky, M. Homann, B. von Boehn, L. Gregoratti, M. Amati, M. Al Hada, H. Sezen and R. Imbihl, J. Chem. Phys., 2018, 148, 154705 CrossRef PubMed.
- B. C. Sales, J. E. Turner and M. B. Maple, Surf. Sci., 1982, 114, 381 CrossRef CAS.
- A. M. Gänzler, M. Casapu, A. Boubnov, O. Müller, S. Conrad, H. Lichtenberg, R. Frahm and J.-D. Grunwaldt, J. Catal., 2015, 328, 216–224 CrossRef.
- S. L. Lane and D. Luss, Phys. Rev. Lett., 1993, 70, 830 CrossRef CAS PubMed.
- V. V. Kaichev, A. Y. Gladky, I. P. Prosvirin, A. A. Saraev, M. Hävecker, A. Knop-Gericke, R. Schlögl and V. I. Bukhtiyarov, Surf. Sci., 2013, 609, 113–118 CrossRef CAS.
- M. Homann, B. von Boehn, M. Prieto, D. M. Gottlob, L. C. Tănase, T. Schmidt, F. Genuzio, T. O. Menteş, A. Locatelli and R. Imbihl, Phys. Rev. Mater., 2021, 5, 045002 CrossRef CAS.
- M. Homann, Reaction-driven restructuring of ultrathin Ni layers on Rh(111) and Rh(110), Leibniz University of Hannover, 2021 Search PubMed.
- T. Franz, J. Zabloudil, F. Mittendorfer, L. Gragnaniello, G. Parteder, F. Allegretti, S. Surnev and F. P. Netzer, J. Phys. Chem. Lett., 2012, 3, 186–190 CrossRef CAS.
- L. Gragnaniello, F. Allegretti, R. R. Zhan, E. Vesselli, E. Braldi, G. Comelli, S. Surnev and F. P. Netzer, Surf. Sci., 2013, 611, 86–93 CrossRef CAS.
- J. Schoiswohl, F. Mittendorfer, S. Surnev, M. G. Ramsey, J. N. Andersen and F. P. Netzer, Phys. Rev. Lett., 2006, 97, 126102 CrossRef CAS PubMed.
- G. Comelli, V. R. Dhanak, M. Kiskinova, K. C. Prince and R. Rosei, Surf. Sci. Rep., 1998, 32, 165 CrossRef CAS.
- M. Kiskinova, Chem. Rev., 1996, 96, 1431 CrossRef CAS PubMed.
- M. Homann, B. von Boehn, L. Gregoratti, M. Amati, P. Zeller and R. Imbihl, Surf. Sci., 2019, 679, 56–63 CrossRef CAS.
- H. H. Rotermund, Surf. Sci. Rep., 1997, 29, 265 CrossRef CAS.
- W. Engel, M. E. Kordesch, H. H. Rotermund, S. Kubala and A. von Oertzen, Ultramicroscopy, 1991, 36, 148 CrossRef.
- F. Mertens, S. Schwegmann and R. Imbihl, J. Chem. Phys., 1997, 106, 4319 CrossRef CAS.
- F. Mertens and R. Imbihl, Chem. Phys. Lett., 1995, 242, 221 CrossRef CAS.
- A. Makeev and R. Imbihl, J. Chem. Phys., 2000, 113, 3854 CrossRef CAS.
- M. Bär, S. Nettesheim, H. H. Rotermund, M. Eiswirth and G. Ertl, Phys. Rev. Lett., 1995, 74, 1246 CrossRef.
- B. von Boehn, A. Preiss and R. Imbihl, Phys. Chem. Chem. Phys., 2016, 18, 19713–19721 RSC.
- M. Hesse, B. von Boehn, A. Locatelli, A. Sala, T. O. Menteş and R. Imbihl, Phys. Rev. Lett., 2015, 115, 136102 CrossRef PubMed.
| This journal is © the Owner Societies 2021 |

