 Open Access Article
Creative Commons Attribution 3.0 Unported Licence
Observation of microsecond luminescence while studying two DNA-stabilized silver nanoclusters emitting in the 800–900 nm range†
Vanessa
Rück‡
 ,
Cecilia
Cerretani‡
 *,
Vlad A.
Neacşu§
 ,
Mikkel B.
Liisberg
 and
Tom
Vosch
 *
*
Department of Chemistry, University of Copenhagen, Universitetsparken 5, Copenhagen 2100, Denmark. E-mail: cece@chem.ku.dk; tom@chem.ku.dk
First published on 3rd June 2021
Abstract
We investigated two DNA-stabilized silver nanoclusters (DNA-AgNCs) that show multiple absorption features in the visible region, and emit around 811 nm (DNA811-AgNC) and 841 nm (DNA841-AgNC). Both DNA-AgNCs have large Stokes shifts and can be efficiently excited with red light. A comparison with the commercially available Atto740 yielded fluorescence quantum yields in the same order of magnitude, but a higher photon output above 800 nm since both DNA-AgNCs are more red-shifted. The study of both DNA-AgNCs also revealed previously unobserved photophysical behavior for this class of emitters. The fluorescence quantum yield and decay time of DNA841-AgNC can be increased upon consecutive heating/cooling cycles. DNA811-AgNC has an additional absorption band around 470 nm, which is parallel in orientation to the lowest energy transition at 640 nm. Furthermore, we observed for the first time a DNA-AgNC population (as part of the DNA811-AgNC sample) with green and near-infrared emissive states with nanosecond and microsecond decay times, respectively. A similar dual emissive DNA-AgNC stabilized by a different 10-base DNA strand is also reported in the manuscript. These two examples highlight the need to investigate the presence of red-shifted microsecond emission for this class of emitters.
Introduction
In recent years, the understanding of how DNA sequences select for emission color of DNA-stabilized silver nanoclusters (DNA-AgNCs) has advanced.1 Evidence of preferred rod-like AgNCs was inferred by correlating emission color with the number of reduced silver atoms, yielding an increased prevalence of even numbers (e.g. 4Ag0 for green and 6Ag0 for red),2 and by interpreting the shape of the absorption spectrum.3 Purification methods like high-pressure liquid chromatography (HPLC)4,5 and size exclusion chromatography (SEC)6 have allowed to collect pure DNA-AgNCs and characterize their composition4 and photophysical properties.7–12 Recently, it also enabled the crystallization structure determination of several near-infrared (NIR)-emitting DNA-AgNCs by single crystal X-ray diffraction.13–15 NIR emitters are of special interest since these wavelengths have higher tissue penetration depth, reduced light scattering and generate less auto-fluorescence compared to the UV-Vis region.16–18We present here a detailed characterization of two HPLC-purified DNA-AgNCs with large Stokes shifts and emission maxima in the 800 to 900 nm range. These two DNA-AgNCs are stabilized by two different DNA oligomers: 5′-GACACGGACC-3′ (further referred to as DNA841-AgNC) and 5′-AGTCACGACA-3′ (further referred to as DNA811-AgNC). These two sequences were originally reported in a NIR screening library by Swasey et al.19 Analysis of DNA841-AgNC and DNA811-AgNC revealed interesting photophysical behavior that will expand our understanding of the photophysics of DNA-AgNCs. The quantum yield and fluorescence decay time of DNA841-AgNC can be improved upon heating. Based on the available literature data, this is the first time such behavior has been observed for DNA-AgNCs. Moreover, DNA811-AgNC displays a significant secondary transition around 470 nm, which is very atypical for rod-like DNA-AgNCs.1,20 By using steady-state excitation and emission anisotropy measurements, we show that the 470 nm transition is parallel to the main transition at 640 nm for the DNA811-AgNC. This intriguing result could stimulate theoretical investigations and help to uncover the nature of the optical transitions in this class of emitters.1 Furthermore, steady-state excitation anisotropy helped to unravel the presence of an additional dual emitting DNA-AgNC in the DNA811-AgNC sample, displaying nanosecond-lived green and microsecond-lived NIR emission. To the best of our knowledge, it is also the first time that microsecond luminescence has been reported for DNA-AgNCs (without active optical depopulation of long-lived dark states).1,21,22
Results and discussion
Steady-state properties of DNA841-AgNC and DNA811-AgNC
Details on the synthesis and HPLC purification of the DNA841-AgNC and DNA811-AgNC can be found in the ESI† (Fig. S1 and S2). For DNA841-AgNC, the fraction from 8.5–12.5 minutes was collected. Fig. 1A shows the absorption and emission spectra of the HPLC-purified sample. In addition to the absorption peak around 260 nm, which can be attributed to the nucleobases, a major AgNC-related peak around 640 nm is present, together with minor features at 325 nm, 365 nm, 450 nm and 510 nm. Exciting at 365 nm, 445.4 nm, 507.5 nm and 634.8 nm yielded identical normalized emission spectra indicating that the compound is pure and can be considered as a single emissive species (see Fig. S3, ESI†).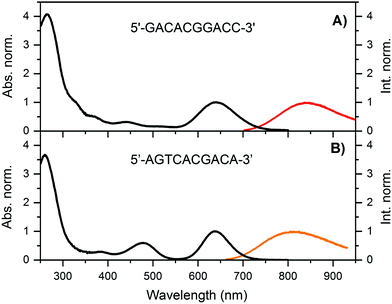 | ||
| Fig. 1 Normalized absorption (at the 640 nm transition, T = 25 °C) and emission spectra (recorded at room temperature on a single molecule sensitive confocal microscope)12 for (A) DNA841-AgNCs and (B) DNA811-AgNCs in a 10 mM ammonium acetate (NH4OAc), exciting at 640 and 645 nm, respectively. | ||
For DNA811-AgNC, the fraction around 13 minutes was collected and Fig. 1B shows the absorption and emission spectra of the HPLC-purified sample. Besides the nucleobase-related absorption peak around 260 nm, the main AgNC-related peak is also centered around 640 nm, together with two additional features around 375 nm and 470 nm. The 470 nm feature is atypically intense.20 Furthermore, exciting in the 470 nm band yields green emission and a blue-shifted NIR emission (see Fig. 3A). More details will be provided below. Even though both DNA-AgNCs have absorption maxima around 640 nm, they have different Stokes shifts of about 3734 cm−1 for DNA841-AgNC and 3344 cm−1 for DNA811-AgNC (at room temperature). Interestingly, the full-width half maximum (FWHM) of the 640 nm transition for DNA811-AgNC is significantly smaller (1443 cm−1) than the FHWM for DNA841-AgNC (2022 cm−1). The fluorescence quantum yield (Q) was estimated to be 0.11 for DNA841-AgNC and 0.07 for DNA811-AgNC by using Atto740 as a reference dye (see ESI† and Fig. S4A for details).24 Above 800 nm, the photon output of both DNA841-AgNC and DNA811-AgNC are higher than Atto740 assuming identical absorption conditions (see Fig. S4B, ESI† where the area of each emission spectrum is normalized to their respective fluorescence quantum yield).
In order to evaluate the orientation of the transition dipole moments of some of the higher energy transitions with respect to the 640 nm transition, we present for the first time both steady-state excitation25 and emission anisotropy experiments for DNA841-AgNC and DNA811-AgNC. Moreover, these measurements turned out to be very useful in uncovering the presence of an additional dual emitting DNA-AgNC in the DNA811-AgNC sample.
Fig. 2 shows that the emission anisotropy upon exciting at 634.8 nm is very close to the theoretical maximum value of 0.4 for both DNA841-AgNC and DNA811-AgNC. To determine the steady-state anisotropy, the DNA-AgNCs were measured in 95% glycerol and 5% 10 mM ammonium acetate (NH4OAc) aqueous solution at 5 °C, in order to avoid depolarization of the fluorescence by rotational diffusion. As can be seen in Table 1 and Fig. 2, the highly viscous medium had no significant effect on the absorption spectra, but blue-shifted the emission maxima. Which parameters affect the magnitude of the Stokes shift is not yet fully understood and a recent article by Copp et al. tried to find systematic correlations in a large dataset, suggesting a link between cluster geometry and Stokes shift.20,26,27
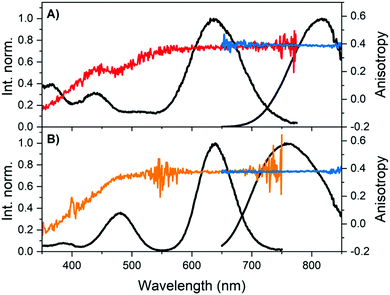 | ||
| Fig. 2 Overlay of steady-state excitation (red and orange) and emission anisotropy (blue) together with the vertical-vertical (VV) excitation (black) and VV emission spectra (black).23 The detector used on the FluoTime300 has a limited sensitivity above 800 nm, and hence the spectral shape becomes increasingly unreliable with increasing wavelength. However, anisotropy is a ratiometric quantity and thus not affected by this. (A) DNA841-AgNCs and (B) DNA811-AgNCs in 95% glycerol and 5% 10 mM NH4OAc aqueous solution at 5 °C. See Fig. S5 (ESI†) for additional measurement details. | ||
| Temp. (°C) | Solvent | Abs. λmax (nm) | Em. λmax (nm) | Q | Decay timec (ns (nm)) |
|---|---|---|---|---|---|
| RT: room temperature. W: 10 mM NH4OAc aqueous solution. G: 95% glycerol and 5% 10 mM NH4OAc solution.a Emission maximum determined with the FluoTime300 (λexc = 634.8 nm). Note that due to reduced sensitivity above 800 nm, the emission maxima can become inaccurate and blue-shifted with respect to the true maxima.b Emission maximum determined with a single molecule sensitive microscope.12c Intensity averaged decay times 〈τ〉, obtained from single decay curves recorded at the indicated emission wavelength.d Note 〈τ〉 changes upon thermal treatment as indicated in Fig. 5 and Fig. S8 (ESI). | |||||
| DNA841-AgNC (5′-GACACGGACC-3′) | |||||
| −196 | W | 796a | 3.40 (800) | ||
| 5 | W | 639 | 826a | 1.96 (835) | |
| RT | W | 841b | 0.11 | ||
| 25 | W | 640 | 828a | 1.56 (835) | |
| 40 | W | 641 | 830a | 1.26 (835) | |
| 60 | W | 642 | 834a | 1.02d (835) | |
| 80 | W | 643 | 837a | 0.74d (835) | |
| 5 | G | 636 | 817a | 2.75 (820) | |
| 25 | G | 637 | 821a | 2.21 (820) | |
| 40 | G | 636 | 823a | 1.81 (820) | |
| DNA811-AgNC (5′-AGTCACGACA-3′) | |||||
| −196 | W | 792a | 8.60 (800) | ||
| 5 | W | 638 | 811a | 2.52 (800) | |
| RT | W | 811b | 0.07 | ||
| 25 | W | 638 | 808a | 1.86 (800) | |
| 40 | W | 638 | 806a | 1.43 (800) | |
| 5 | G | 636 | 760a | 5.14 (800) | |
| 25 | G | 636 | 765a | 4.36 (800) | |
| 40 | G | 635 | 768a | 3.61 (800) | |
Monitoring the emission at 800 nm for DNA811-AgNC and 835 nm for DNA841-AgNC, the excitation anisotropy of the 640 nm transition is equally close to the maximum value of 0.4, indicating that the absorption and emission transition dipole moments are aligned.28 The high steady-state anisotropy values are in line with previously reported time-resolved anisotropy values that are close to 0.4 at time zero.10,11,29 Except for the 470 nm transition of the DNA811-AgNC, the other higher energy transitions in DNA841-AgNC and DNA811-AgNC are not aligned with the orientation of the 640 nm transition. Interestingly, for the 470 nm transition of the DNA811-AgNC, a similar excitation anisotropy close to 0.4 is found on the red-edge of the transition, while the blue edge has an anisotropy value that drops gradually. This indicates that the 470 nm absorption feature consists of two separate transitions, yielding differently polarized emission. As mentioned previously, excitation in the 470 nm absorption band also yields green emission around 540 nm, and blue-shifted NIR emission with a maximum around 790 nm (see Fig. 3A). When recording an excitation spectrum at 550 nm, an excitation peak centered around 450 nm can be observed, clearly blue-shifted with respect to the original 470 nm excitation peak when monitoring emission at 800 nm (see Fig. 3B). Recording the excitation anisotropy of the green emission reveals a value close to 0.4 over the whole 450 nm excitation band (see Fig. 3B). All these observations indicate that an additional dual emissive DNA-AgNC is present in the collected HPLC-fraction, which causes some of the collected NIR emission to be depolarized, upon excitation around 450 nm. The loss of polarization is most likely due to the microsecond-lived nature of the blue-shifted NIR emission, as we will discuss below.
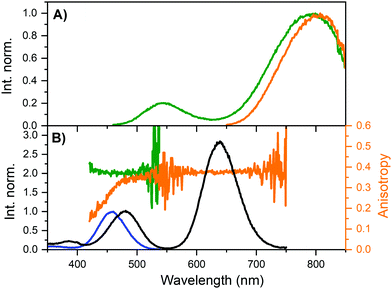 | ||
| Fig. 3 (A) Steady-state emission spectra of DNA811-AgNCs in 10 mM NH4OAc at 25 °C, exciting at 445.4 nm (green) and 634.8 nm (orange). (B) Overlay of steady-state excitation anisotropy traces with VV excitation spectra of DNA811-AgNCs in 95% glycerol and 5% 10 mM NH4OAc at 5 °C, monitoring the emission at 550 nm (green) and 800 nm (orange). The blue excitation spectrum was recorded monitoring the emission at 550 nm, while the black spectrum was monitored at 800 nm. Both spectra were normalized using the peaks around 450–470 nm in order to highlight the shift. See Fig. S5 (ESI†) for further details on the use of long-pass filters in the excitation anisotropy. | ||
Time-resolved properties of DNA841-AgNC and DNA811-AgNC
The intensity averaged fluorescence decay times 〈τ〉 are 1.56 ns for DNA841-AgNC and 1.86 ns for DNA811-AgNC in 10 mM NH4OAc at 25 °C. We have previously shown that the multi-exponential nature of DNA-AgNCs can be explained by slow spectral relaxation (relaxation on the time scale of the excited state decay time).8–10 Given the limited sensitivity of the Fluotime300 detector above 800 nm, we opted to measure time-resolved emission spectra (TRES) only at −196 °C. The results can be found in Fig. 4 and Table 1. For both DNA841-AgNC and DNA811-AgNC, 〈τ〉 got longer and the emission spectra blue-shifted.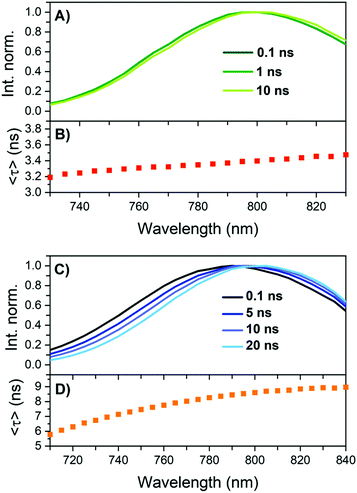 | ||
| Fig. 4 TRES and Intensity averaged decay times 〈τ〉 of a 10 mM NH4OAc solution frozen in liquid nitrogen (−196 °C). (A) and (B) DNA841-AgNC. (C) and (D) DNA811-AgNC. | ||
While DNA841-AgNC showed very limited slow spectral relaxation at −196 °C (see Fig. 4A), significant slow spectral relaxation was observed for DNA811-AgNC (see Fig. 4B). Time-resolved anisotropy measurements allowed to determine the hydrodynamic volume of DNA841-AgNC and DNA811-AgNC, yielding 11.07 nm3 and 10.31 nm3, respectively (Fig. S9, ESI†). While the exact composition of DNA841-AgNC and DNA811-AgNC is not known, it is reasonable to assume that more than one DNA strand stabilizes the AgNCs. More information on structure/spectroscopic property relationship of DNA-AgNCs can be found in a recent review by Gonzàlez-Rosell et al.1
For DNA841-AgNC an interesting observation was made as shown in Fig. 5. By exposing the sample to heating/cooling cycles, the overall non-radiative rate constant (knr) lowered, while the radiative rate constant (kf) remained almost unaltered. The experiment was conducted by cycling the temperature between 25 and 60 °C, waiting 30 minutes for each step. Fig. 5A shows absorption and emission spectra at 25 °C for the first three cycles. While there was a minor drop in the absorption maximum at 640 nm, the fluorescence actually increased. We define here a parameter called the apparent quantum yield change, which is the fluorescence intensity divided by the absorbance (F/Abs), normalized to the starting value (F0/Abs0).
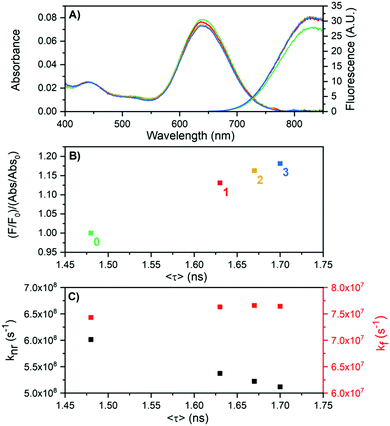 | ||
| Fig. 5 Effect of heat treatment (cycling between 25 and 60 °C for periods of 30 minutes each) of DNA841-AgNCs in 10 mM NH4OAc on the fluorescence properties. (A) Absorption and emission spectra at 25 °C at the beginning of the cycles (t = 0, green), after 1 hour (red), after 2 hours (yellow) and 3 hours (blue). (B) Apparent quantum yield change as a function of 〈τ〉 for the four points where the temperature was 25 °C (0, 1, 2 and 3 hours). (C) Calculated values of kf and knr as a function of 〈τ〉, using the measured quantum yield of 0.11 (Table 1) as the apparent quantum yield change at t = 0. | ||
Fig. 5B shows that the apparent quantum yield change and consequently 〈τ〉 increase with increasing number of heating cycles. A cursory inspection indicates a linear relationship as would be expected for a classic two-level emission system with only kf and knr as the rates for the excited state decay.23 Using 0.11 (see Table 1) as the quantum yield at the starting point (F0/Abs0), knr and kf can be estimated and are shown in Fig. 5C. The heat treatment of the sample causes an increase of 〈τ〉 that can be mainly attributed to a reduction of knr. However, the mechanistic reason of this is not clear yet. We speculate that variations in the hydration shell (structurally bound water) around the silver core or minor non-reversible conformational changes (at least not on the time scale of the experiments) in the DNA structure could be the cause of the reduced knr. Similar improvements in the apparent quantum yield change and an increased 〈τ〉 were also found when performing the heating/cooling cycles between 25–80 °C (Fig. S8, ESI†). However, the higher temperature additionally degraded the DNA841-AgNC sample.
As mentioned previously, the DNA811-AgNC also revealed some unusual time-resolved emission behavior. Excitation at 445.4 nm yielded both green and blue-shifted NIR emission (see Fig. 3A). The green emission was on the nanosecond time scale (see Fig. S9, ESI†), while the NIR contained a significant microsecond-lived NIR emission (Fig. 6A). Microsecond-lived emission will show up as an increased baseline, since it is significantly longer than the time window used in time-correlated single photon counting experiments geared towards the nanosecond range that use high repetition rate lasers. Analyzing the decay components upon excitation at 445.4 nm at different emission wavelengths allowed us to create a 〈τ〉 plot that can be seen in Fig. S10 (ESI†). It also enabled us to construct a plot of the baseline amplitude (background level in the globally linked tri-exponential decay fit), which is a proxy for the microsecond-lived emission. The profile can be seen in Fig. 6B and, as expected, it shows a blue-shifted emission maximum around 770 nm. This explains the overall blue-shift of the NIR steady-state emission observed in Fig. 3A (green spectrum) and also why some of the NIR emission is depolarized. Indeed, performing emission anisotropy experiments upon excitation at 445.4 nm and then splitting the collected photons in two parts, the nanosecond decay curve and the microsecond baseline, yielded anisotropy values of 0.36 and 0.012, respectively (see Fig. S11, ESI†). The microsecond anisotropy value of 0.012 is very close to the theoretical value of zero that would be expected for complete depolarization. We assume this is reasonable since one can no longer consider the DNA811-AgNCs to be immobile in 95% glycerol on these significantly long time scales. The nanosecond (〈τ〉) NIR component (Fig. S10B, ESI†) has a maximum that is similar to the maximum observed upon direct excitation in the 640 nm band (Fig. 3A). Additionally, exciting at 634.8 nm yielded only ns-lived NIR emission (Fig. 6A) as can be seen by the absence of the baseline in the decay curve (see also Fig. S13 for the lack of any significant microsecond-lived emission, ESI†). All these observations point to a most likely scenario of two independent emitters, the DNA811-AgNC with nanosecond-lived NIR emission (811 nm), with excitation maxima at 470 and 640 nm and an additional dual emissive DNA-AgNC with nanosecond-lived green (540 nm) and microsecond-lived NIR emission (770 nm) with an excitation maximum centered at 450 nm.
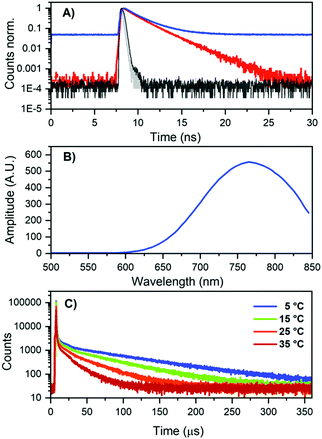 | ||
| Fig. 6 (A) Decay curves of DNA811-AgNCs in 10 mM NH4OAc, excited at 445.4 nm (blue curve) and 634.8 nm (red curve), both monitored at 800 nm. The grey and black curves represent the IRF of the 445.4 nm and 634.8 nm laser, respectively. (B) Background amplitude as a function of emission wavelength for DNA811-AgNCs in 10 mM NH4OAc, exciting at 445.4 nm, in the global tri-exponential fit (see Fig. S10, ESI† for the 〈τ〉 spectrum). The background amplitude is a proxy for the microsecond-lived NIR emission. (C) Decay curves (λem = 800 nm) at different temperatures for DNA811-AgNCs in 10 mM NH4OAc, exciting at 450 nm with a Xe flash lamp (repetition rate = 300 Hz). The IRF is shown in Fig. S12 (ESI†). | ||
Using a flash Xenon lamp (repetition rate = 300 Hz), we acquired decay curves at different temperatures (Fig. 6C) and thus we were able to determine the microsecond decay time upon 450 nm excitation. Values of 90, 60, 37 and 22 μs were determined from tail-fitting at 5, 15, 25, and 35 °C, respectively (Fig. 6C and Fig. S12 for the IRFs, ESI†). To the best of our knowledge, this is the first time that microsecond-lived luminescence has been observed for DNA-AgNCs.1 It is well established that DNA-AgNCs have long-lived dark states with decay times in the microsecond range, but no significant emission has been associated with them.30–32 In recent years, optical excitation of these dark states has been used in new imaging modalities such as optically activated delayed fluorescence (OADF) and upconversion fluorescence (UCF).10,21,33 Long-lived emission has been reported before for other AgNCs and Ag(I)NCs.34–37 For AgNCs stabilized in zeolites, a range of different emitters have been stabilized, with emission decay times ranging from the nanosecond to hundreds of microsecond range.38,39
Given the narrow HPLC peak in Fig. S2 (ESI†), it will be interesting to investigate in the future whether this dual emissive species is structurally and compositionally alike to the DNA811-AgNC and if so, what causes the spectroscopic changes. Recently, we also found similar dual emission in a HPLC-fraction of DNA-AgNCs stabilized by 5′-CCACCTTTTC-3′ (Fig. S14, S15 and S16, ESI†). This DNA-AgNC, previously reported by Copp et al.,40,41 turned out to display also green nanosecond-lived fluorescence combined with microsecond-lived NIR luminescence (see Table S1, Fig. S17 and S18, ESI†).
These two examples of dual emissive DNA-AgNCs illustrate that it is beneficial not to limit time-resolved experiments to the nanosecond time scale, but also evaluate the potential presence of red-shifted, longer lived emission in the microsecond range.
Conclusions
The reported DNA811-AgNC and DNA841-AgNC have multiple absorption peaks in the UV-visible region, all producing the same emission in the 800–900 nm range. Due to a large Stokes shift, the photon output above 800 nm of both DNA-AgNCs is higher than that of the Atto740 reference dye.Besides the above-mentioned features, new interesting photophysical properties were observed for these NIR-emitting DNA-AgNCs. The fluorescence quantum yield and fluorescence decay time of DNA841-AgNC can be increased by a heating induced suppression of knr. The mechanistic origin of this phenomenon is so far not known and can therefore inspire future experimental and theoretical studies to determine the role of the hydration shell and DNA conformation on the emission properties of DNA-AgNCs. We also presented for the first time steady-state excitation anisotropy traces that helped to establish that the 470 nm transition in DNA811-AgNC is parallel to the 640 nm transition. Moreover, steady-state excitation anisotropy and microsecond decay time measurements were crucial in unraveling the presence of a new class of DNA-AgNCs that exhibit dual emission in the green (nanosecond) and NIR region (microsecond). It is unknown at this point whether this emitter is structurally similar to DNA811-AgNC. Nevertheless, it would be especially interesting to find out how it relates to the currently well-tested relationship of color and even number of reduced silver atoms.1,2 Together with a similar dual emissive species discovered using 5′-CCACCTTTTC-3′, the microsecond emission is a new intriguing feature of DNA-AgNCs, which is consistent with the photophysical behavior previously reported for other classes of AgNCs (e.g. zeolite- or thiol-stabilized AgNCs).
In conclusion, the presented results expand the understanding of DNA-AgNCs and will hopefully inspire theoretical calculations that can provide answers to the origin of our findings.
Conflicts of interest
There are no conflicts to declare.Acknowledgements
M. B. L., C. C., and T. V. acknowledge funding from the Villum Foundation (VKR023115) and the Independent Research Fund Denmark (0136-00024B). V. R. acknowledges financial support from the Erasmus + Program.Notes and references
- A. Gonzàlez-Rosell, C. Cerretani, P. Mastracco, T. Vosch and S. M. Copp, Nanoscale Adv., 2021, 3, 1230–1260 RSC.
- S. M. Copp, D. Schultz, S. Swasey, J. Pavlovich, M. Debord, A. Chiu, K. Olsson and E. Gwinn, J. Phys. Chem. Lett., 2014, 5, 959–963 CrossRef CAS PubMed.
- D. Schultz, K. Gardner, S. S. R. Oemrawsingh, N. Markešević, K. Olsson, M. Debord, D. Bouwmeester and E. Gwinn, Adv. Mater., 2013, 25, 2797–2803 CrossRef CAS PubMed.
- D. Schultz and E. G. Gwinn, Chem. Commun., 2012, 48, 5748–5750 RSC.
- J. T. Petty, C. Fan, S. P. Story, B. Sengupta, A. S. John Iyer, Z. Prudowsky and R. M. Dickson, J. Phys. Chem. Lett., 2010, 1, 2524–2529 CrossRef CAS PubMed.
- J. T. Petty, O. O. Sergev, D. A. Nicholson, P. M. Goodwin, B. Giri and D. R. McMullan, Anal. Chem., 2013, 85, 9868–9876 CrossRef CAS PubMed.
- C. Cerretani and T. Vosch, ACS Omega, 2019, 4, 7895–7902 CrossRef CAS PubMed.
- S. A. Bogh, C. Cerretani, L. Kacenauskaite, M. R. Carro-Temboury and T. Vosch, ACS Omega, 2017, 2, 4657–4664 CrossRef CAS PubMed.
- C. Cerretani, M. R. Carro-Temboury, S. Krause, S. A. Bogh and T. Vosch, Chem. Commun., 2017, 53, 12556–12559 RSC.
- V. A. Neacşu, C. Cerretani, M. B. Liisberg, S. M. Swasey, E. G. Gwinn, S. M. Copp and T. Vosch, Chem. Commun., 2020, 56, 6384–6387 RSC.
- S. A. Bogh, M. R. Carro-Temboury, C. Cerretani, S. M. Swasey, S. M. Copp, E. G. Gwinn and T. Vosch, Methods Appl. Fluoresc., 2018, 6, 024004 CrossRef PubMed.
- M. B. Liisberg, Z. Shakeri Kardar, S. M. Copp, C. Cerretani and T. Vosch, J. Phys. Chem. Lett., 2021, 12, 1150–1154 CrossRef CAS PubMed.
- C. Cerretani, H. Kanazawa, T. Vosch and J. Kondo, Angew. Chem., Int. Ed., 2019, 58, 17153–17157 CrossRef CAS PubMed.
- C. Cerretani, J. Kondo and T. Vosch, RSC Adv., 2020, 10, 23854–23860 RSC.
- C. Cerretani, J. Kondo and T. Vosch, CrystEngComm, 2020, 22, 8136–8141 RSC.
- E. D. Cosco, A. L. Spearman, S. Ramakrishnan, J. G. P. Lingg, M. Saccomano, M. Pengshung, B. A. Arús, K. C. Y. Wong, S. Glasl, V. Ntziachristos, M. Warmer, R. R. McLaughlin, O. T. Bruns and E. M. Sletten, Nat. Chem., 2020, 12, 1123–1130 CrossRef PubMed.
- J. Cao, B. Zhu, K. Zheng, S. He, L. Meng, J. Song and H. Yang, Front. Bioeng. Biotechnol., 2020, 7, 487 CrossRef PubMed.
- V. J. Pansare, S. Hejazi, W. J. Faenza and R. K. Prud’homme, Chem. Mater., 2012, 24, 812–827 CrossRef CAS PubMed.
- S. M. Swasey, S. M. Copp, H. C. Nicholson, A. Gorovits, P. Bogdanov and E. G. Gwinn, Nanoscale, 2018, 10, 19701–19705 RSC.
- S. M. Copp and A. Gonzàlez-Rosell, Nanoscale, 2021, 13, 4602–4613 RSC.
- B. C. Fleischer, J. T. Petty, J. C. Hsiang and R. M. Dickson, J. Phys. Chem. Lett., 2017, 8, 3536–3543 CrossRef CAS PubMed.
- S. Krause, C. Cerretani and T. Vosch, Chem. Sci., 2019, 10, 5326–5331 RSC.
- J. R. Lakowicz, Principles of Fluorescence Spectroscopy, 2006 Search PubMed.
- A. M. Brouwer, Pure Appl. Chem., 2011, 83, 2213 CAS.
- I. Díez, R. H. A. Ras, M. I. Kanyuk and A. P. Demchenko, Phys. Chem. Chem. Phys., 2013, 15, 979–985 RSC.
- S. M. Copp, A. Faris, S. M. Swasey and E. G. Gwinn, J. Phys. Chem. Lett., 2016, 7, 698–703 CrossRef CAS PubMed.
- S. M. Copp, D. Schultz, S. M. Swasey, A. Faris and E. G. Gwinn, Nano Lett., 2016, 16, 3594–3599 CrossRef CAS PubMed.
- E. N. Hooley, M. R. Carro-Temboury and T. Vosch, J. Phys. Chem. A, 2017, 121, 963–968 CrossRef CAS PubMed.
- M. Gambucci, C. Cerretani, L. Latterini and T. Vosch, Methods Appl. Fluoresc., 2019, 8, 014005 CrossRef PubMed.
- T. Vosch, Y. Antoku, J. C. Hsiang, C. I. Richards, J. I. Gonzalez and R. M. Dickson, Proc. Natl. Acad. Sci. U. S. A., 2007, 104, 12616–12621 CrossRef CAS PubMed.
- J. T. Petty, C. Fan, S. P. Story, B. Sengupta, M. Sartin, J.-C. Hsiang, J. W. Perry and R. M. Dickson, J. Phys. Chem. B, 2011, 115, 7996–8003 CrossRef CAS PubMed.
- I. L. Volkov, P. Y. Serdobintsev and A. I. Kononov, J. Phys. Chem. C, 2013, 117, 24079–24083 CrossRef CAS.
- S. Krause, M. R. Carro-Temboury, C. Cerretani and T. Vosch, Chem. Commun., 2018, 54, 4569–4572 RSC.
- Z. Han, X. Y. Dong, P. Luo, S. Li, Z. Y. Wang, S. Q. Zang and T. C. W. Mak, Sci. Adv., 2020, 6, eaay0107 CrossRef CAS PubMed.
- J. S. Yang, M. M. Zhang, Z. Han, H. Y. Li, L. K. Li, X. Y. Dong, S. Q. Zang and T. C. W. Mak, Chem. Commun., 2020, 56, 2451–2454 RSC.
- M. Hailmann, N. Wolf, R. Renner, B. Hupp, A. Steffen and M. Finze, Chem. – Eur. J., 2017, 23, 11684–11693 CrossRef CAS PubMed.
- D. Grandjean, E. Coutiño-Gonzalez, N. T. Cuong, E. Fron, W. Baekelant, S. Aghakhani, P. Schlexer, F. D'Acapito, D. Banerjee, M. B. J. Roeffaers, M. T. Nguyen, J. Hofkens and P. Lievens, Science, 2018, 361, 686–690 CrossRef CAS PubMed.
- G. De Cremer, Y. Antoku, M. B. J. Roeffaers, M. Sliwa, J. Van Noyen, S. Smout, J. Hofkens, D. E. De Vos, B. F. Sels and T. Vosch, Angew. Chem., Int. Ed., 2008, 47, 2813–2816 CrossRef CAS PubMed.
- G. De Cremer, E. Coutiño-Gonzalez, M. B. J. Roeffaers, B. Moens, J. Ollevier, M. Van Der Auweraer, R. Schoonheydt, P. A. Jacobs, F. C. De Schryver, J. Hofkens, D. E. De Vos, B. F. Sels and T. Vosch, J. Am. Chem. Soc., 2009, 131, 3049–3056 CrossRef CAS PubMed.
- S. M. Copp, P. Bogdanov, M. Debord, A. Singh and E. Gwinn, Adv. Mater., 2014, 26, 5839–5845 CrossRef CAS PubMed.
- S. M. Copp, A. Gorovits, S. M. Swasey, S. Gudibandi, P. Bogdanov and E. G. Gwinn, ACS Nano, 2018, 12, 8240–8247 CrossRef CAS PubMed.
Footnotes |
| † Electronic supplementary information (ESI) available: Materials and methods section, HPLC purification information. See DOI: 10.1039/d1cp01731d |
| ‡ These authors contributed equally. |
| § Present address: Department of Chemistry, City University of Hong Kong, 83 Tat Chee Ave, Kowloon Tong, Hong Kong, China. |
| This journal is © the Owner Societies 2021 |
