
 Open Access Article
 This Open Access Article is licensed under a
 Creative Commons Attribution 3.0 Unported Licence
Striking solvent dependence of total emission and circularly polarised luminescence in coordinatively saturated chiral europium complexes: solvation significantly perturbs the ligand field†
Jack D.
Fradgley
,
Andrew T.
Frawley
 ,
Robert
Pal
and
David
Parker
*
,
Robert
Pal
and
David
Parker
*
Department of Chemistry, Durham University, South Road, Durham, DH1 3LE, UK. E-mail: david.parker@durham.ac.uk
First published on 28th April 2021
Abstract
Examination of total emission and circularly polarised luminescence (CPL) spectra of three 9-coordinate Eu(III) complexes with well-defined speciation shows that the ligand fields of these C3 symmetric complexes are extremely sensitive to solvent polarity, even when solvent is not present in the first coordination sphere. The energies, intensities, and (for CPL) the sign of some transitions vary with solvent polarity. These observations are rationalised by analysis of the factors that control total and circularly polarised emission, and have important implications for design of responsive luminescent Ln(III) probes.
Introduction
A careful recent analysis has concluded that the ligand field splitting of lanthanide complexes is a sensitive function of several factors.1 The primary determinants of the ligand field at a lanthanide ion are the symmetry, constitution, configuration and dynamic speciation of the coordination complex. Additional factors may be very important and include: the degree and type of any polyhedral geometric distortion that changes local symmetry; the polarisability of the ligand as a whole and its donor atoms;2 the presence and extent of metal and ligand solvent dipolar interactions; the occurrence of directed hydrogen bonding effects and the nature and degree of supramolecular order in the system, for example the degree of aggregation3 or non-covalent association. Each of these factors may be particularly significant in defining the ligand field at the metal ion and their relative importance varies for a given lanthanide/ligand combination.Ligand fields in complexes that lie close to trigonal symmetry are often very small, so they are among the most susceptible to variation in the size and sign of the ligand field splitting. This is the case with 9-coordinate systems based on 1,4,7-triazacyclononane, where an exquisite sensitivity of the ligand field to solvation of the ligand aromatic chromophores has been described using combined paramagnetic NMR studies, magneto-structural correlations and CASSCF theoretical calculations.4 The sensitivity of the orientation and tilt of the major component of the magnetic susceptibility tensor to small structural or environmental change, including some pronounced solvent effects, has been demonstrated.4–6 A similar sensitivity may be expected for the orthogonal electric susceptibility tensor, and is expressed in the optical behaviour of the lanthanide complexes. This issue is exemplified here for the total and CPL emission of europium(III) complexes.
The term solvatochromism is used broadly when referring to the reversible change in spectral characteristics induced by variation of the energy difference between the ground and first excited states, as a result of the local solvent. Typically, these changes in lanthanide coordination complexes have been observed using absorption,7 circular dichroism8 or emission spectroscopy9 and relate to variations in the λmax value, the intensity of salient transitions, and/or changes to spectral form. Relatively few examples exist of solvent effects in emission for lanthanide coordination complexes of proven speciation, in which the solvent is not coordinated to the metal ion. Even fewer are known with chiral lanthanide complexes, where the circularly polarised luminescence (CPL) signal is used to monitor the change.10
Here, we report the behaviour of three well defined Eu(III) complexes, [EuL1–3],11–13 in which solvatochromism is exhibited in absorption by two systems, and in emission by all three. The most lipophilic complex, [EuL2], and the structurally simpler complex, [EuL3], lacking the extended sensitising chromophore, were available as the pure enantiomers. These chiral HPLC analyses have been reported in the earlier publications first introducing these complexes (ref. 12 for [EuL2] and ref. 13 for [EuL3]). They were chosen for more detailed analysis using circularly polarised luminescence, and have led to an empirical rationalisation of the sensitivity of CPL to solvent variation in systems where the achiral solvent is not bound to the metal ion.
Results and discussion
Absorption spectral comparative analysis
The absorption spectrum of [EuL1] in the absence of acid was found to be highly solvent dependent, with increasing solvent polarity resulting in a hypsochromic shift in λmax of 30 nm, from 350 nm in chloroform (28![[thin space (1/6-em)]](https://www.rsc.org/images/entities/char_2009.gif) 570 cm−1) to 320 nm (31250 cm−1) in water. A positive linear correlation was obtained by plotting the inverse of λmax (i.e., its frequency) against the normalised Reichardt solvent polarity parameter ENT, R2 = 0.98, (Fig. 1 and Table S1, ESI†).14 This behaviour is termed negative solvatochromism, with the more polar solvents stabilising the ground state more than the excited state. On addition of trifluoroacetic acid, the absorption spectrum was very similar in form in every solvent examined. The band intensity increased relative to the unprotonated series, with a hypsochromic shift of λmax to 320–324 nm. Taken together, this behaviour is consistent with the assignment of the more intense long wavelength absorption band in the conjugate base to an internal charge transfer (ICT) transition. On protonation, this band diminishes in intensity and shifts to higher energy, and the longest wavelength band is assigned to a ligand π–π* transition.11
570 cm−1) to 320 nm (31250 cm−1) in water. A positive linear correlation was obtained by plotting the inverse of λmax (i.e., its frequency) against the normalised Reichardt solvent polarity parameter ENT, R2 = 0.98, (Fig. 1 and Table S1, ESI†).14 This behaviour is termed negative solvatochromism, with the more polar solvents stabilising the ground state more than the excited state. On addition of trifluoroacetic acid, the absorption spectrum was very similar in form in every solvent examined. The band intensity increased relative to the unprotonated series, with a hypsochromic shift of λmax to 320–324 nm. Taken together, this behaviour is consistent with the assignment of the more intense long wavelength absorption band in the conjugate base to an internal charge transfer (ICT) transition. On protonation, this band diminishes in intensity and shifts to higher energy, and the longest wavelength band is assigned to a ligand π–π* transition.11
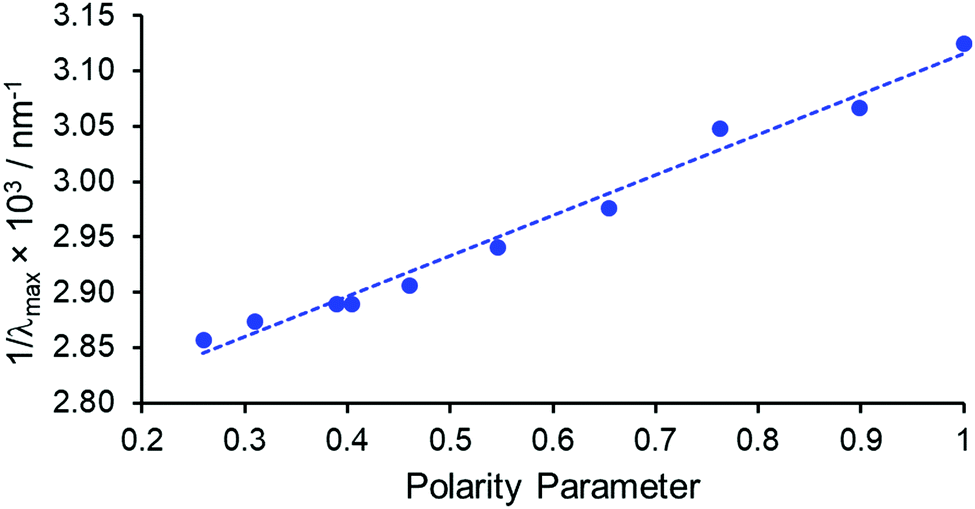 | ||
| Fig. 1 Negative solvatochromism exhibited by [EuL1] for 10 different solvents, comparing the absorption band frequency to the Reichardt polarity parameter, ENT, (R2 = 0.98).14 | ||
With the complex [EuL2], the presence of the three phenyl P-substituents promotes sufficient solubility to allow an examination of behaviour in a wide range of solvents of differing polarity. Marked positive solvatochromism was found in absorption, with the absorption band maximum wavelength varying from 322 nm in acetone (31055 cm−1) to 343 nm (29155 cm−1) in 2,2,2-trifluoroethanol (TFE), consistent with preferential stabilisation of the ICT excited state relative to the ground state in more polar media. Such behaviour is in line with earlier observations on absorption solvatochromism with related Eu(III) p-substituted arylalkynylpyridine chromophores.9
The complex [EuL3] lacks an extended chromophore and did not display any significant variation in the position and intensity of the absorption maximum upon changing solvent polarity, consistent with the absence of the internal charge transfer transition. For [EuL2] and [EuL3], no trend was apparent in the small variations of the europium emission lifetime with changing solvent polarity or viscosity. Lifetime values for [EuL2], for example, were 1.22 ms (±0.08) over the range of solvents examined here. The Eu emission lifetime (±5%) was also independent of the degree of aeration of the sample in methanol and acetonitrile.
Emission spectral behaviour of [EuL1] and [EuL2]
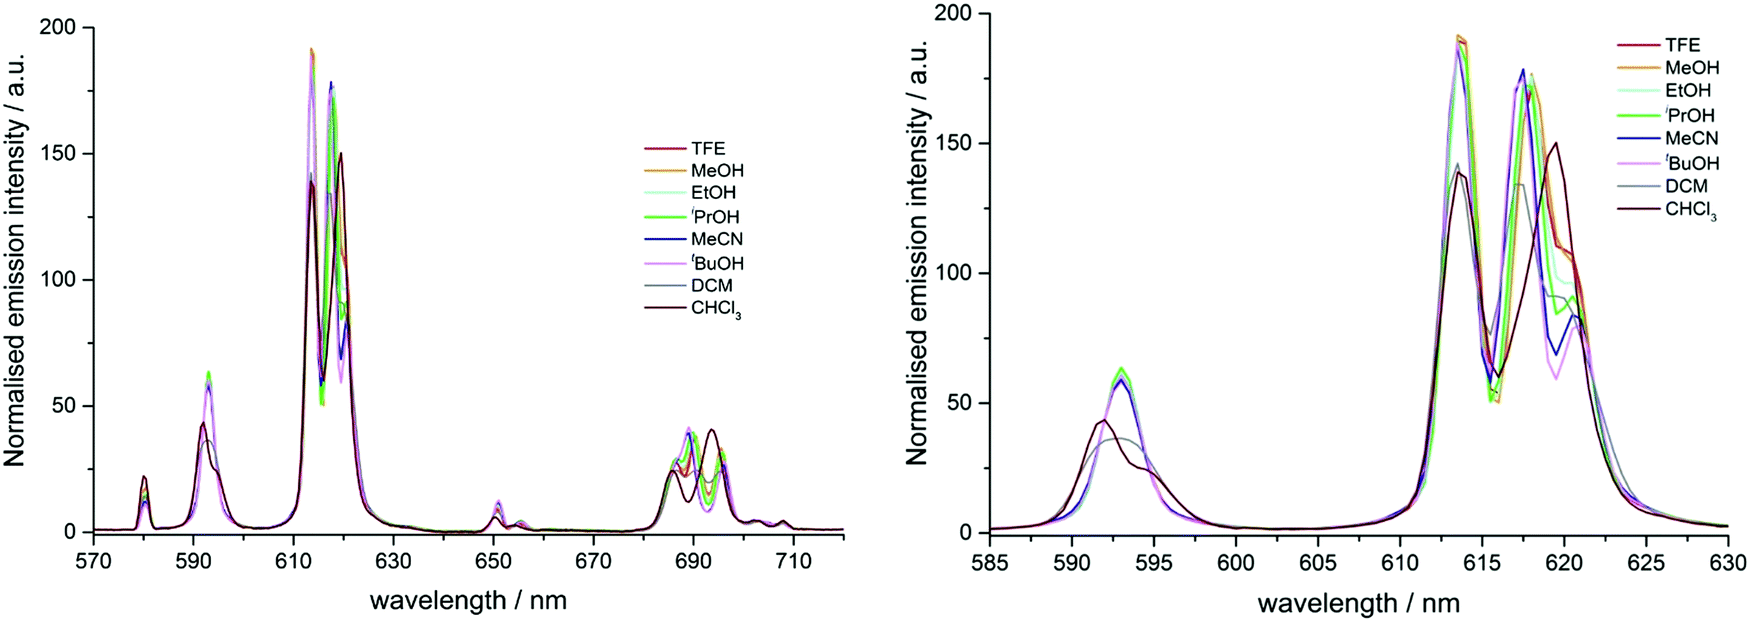
On inspection of the normalised total emission spectrum, variation in the spectral form of [EuL1] with solvent polarity was observed both prior to and following addition of trifluoroacetic acid (TFA), particularly in the energy splitting and relative intensity ratios of the transitions within the hypersensitive ΔJ = 2 and ΔJ = 4 manifolds (Fig. 2 and Fig. S1, ESI†).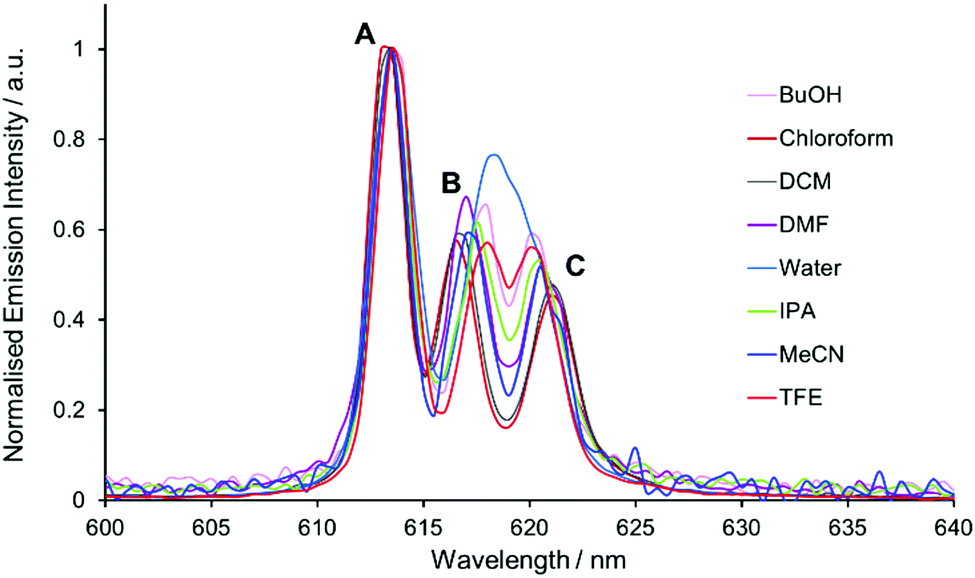 | ||
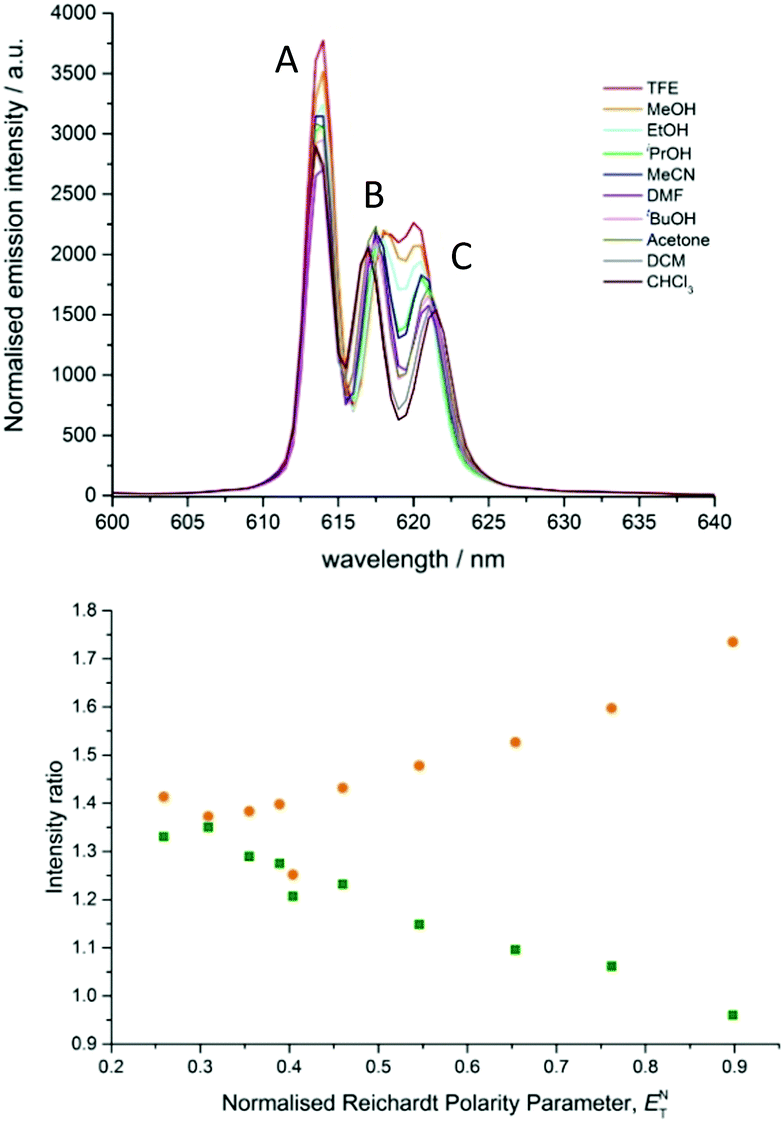
| Fig. 2 Expanded emission spectra of [EuL1] in various solvents, showing the ΔJ = 2 manifold. Transitions A–C are labelled as described in the text. | ||
A solvatochromic effect was most prominent in the ΔJ = 2 manifold prior to the addition of TFA. In the absence of acid, dynamic quenching of Eu emission by photoinduced electron transfer occurs, reducing the excited state lifetime by a factor of 4.11 The strongest transition in the ΔJ = 2 manifold (component A, Fig. 2) showed minimal variation in the energy of the transition, whilst the two longer wavelength transitions (components B and C) varied in both their intensity and energy as a function of solvent polarity. On inspection of the relative intensity of the transitions, a clear trend relating to solvent polarity was not apparent, confirmed by considering the different intensity ratios between the three components (A vs. B, A vs. C, and B vs. C) as a function of solvent polarity.
On considering the difference in energies of these transition components with solvent polarity, however, a strong negative correlation was obtained, (R2 = 0.95, Fig. 3). With increasing solvent polarity from chloroform to water (Table S1, ESI†), the energy difference between the B and C components decreased. In other words, the degree of splitting, i.e., the relative energies of the mJ sub-levels in the 7F2 manifold, increased as the solvent polarity decreased. This variation in spectral form can be illustrated by considering the Stark splittings of the 7F2 manifold in water and chloroform (Fig. 4). Whilst theoretically five Stark sub-levels exist in the 5D0 → 7F2 transition, only three are observed here, as two are forbidden in systems with C3 symmetry.15
 | ||
| Fig. 3 Plot of the difference in frequency of the B and C ΔJ = 2 transitions as a function of the normalised Reichardt polarity parameter, in [EuL1] (R2 = 0.95). | ||
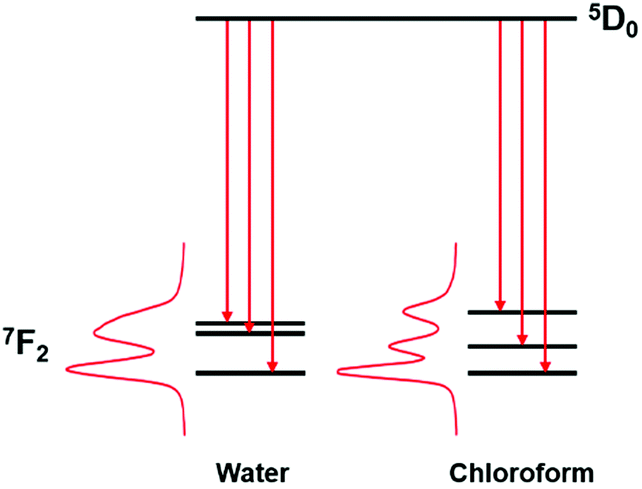 | ||
| Fig. 4 Representation of the change in the Stark splittings of the 7F2 manifold in water and chloroform for [EuL1] ENT (1.00 and 0.26, respectively).14 | ||
Analysis of the ΔJ = 4 manifold in the absence of acid proved more problematic: some variation in the relative intensity and energy of the major three components (D, E, and F) was evident following the addition of acid, but no significant correlation could be found (Fig. S2, ESI†).
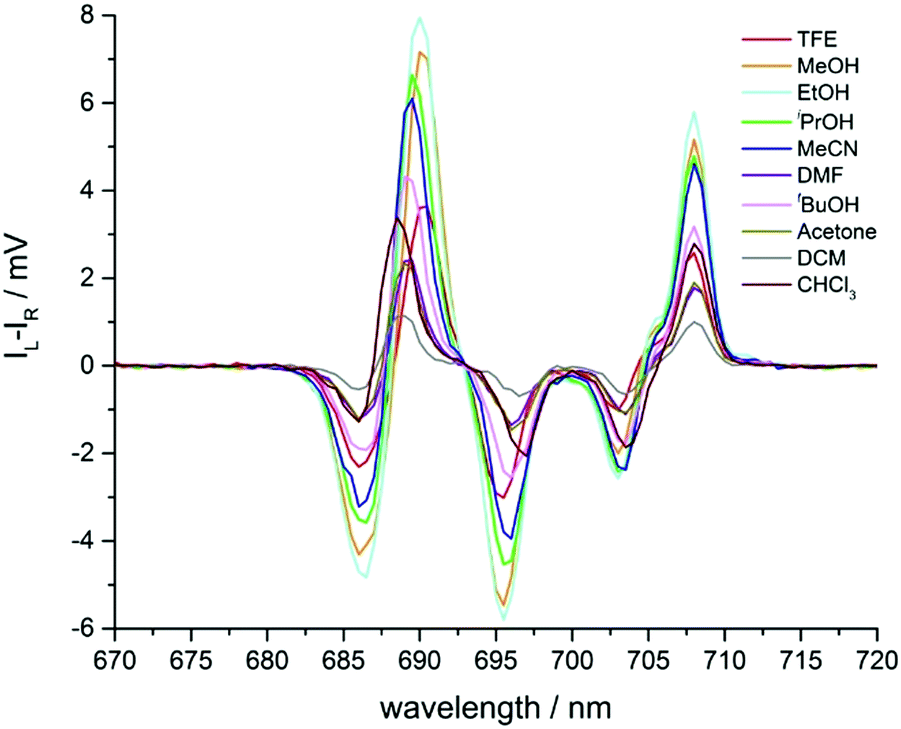
In the total emission spectrum of [EuL2], changes in spectral form were also observed as the solvent was varied (Fig. S3, ESI†). The strongest transition around 614 nm (transition A, Fig. 5) showed little variation, but the two longer wavelength bands (B and C) changed both position and relative intensity ratio. On moving from polar protic solvents (e.g. MeOH) to non-polar solvents (e.g. CHCl3), the two components separated with transition B moving to shorter wavelength and transition C moving in the opposite sense (Fig. S3b, ESI†). Additionally, the relative intensities of these two transitions varied considerably; as solvent polarity decreased, transition C became less intense compared to B.
 | ||
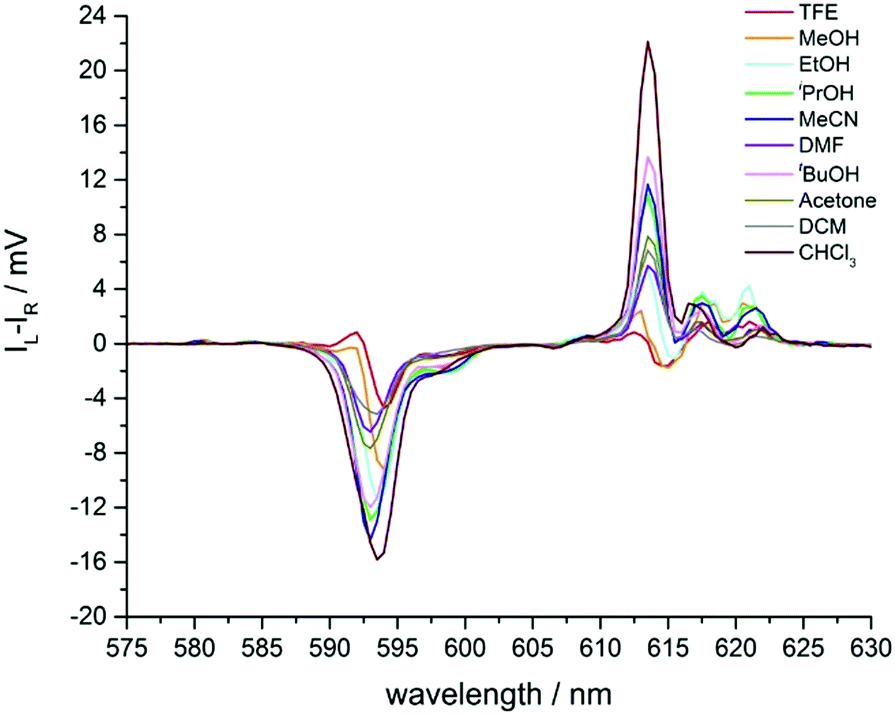
| Fig. 5 (top) Expanded emission spectra of [EuL2] in various solvents showing the ΔJ = 2 manifold. Transitions are labelled as described in the text. (bottom) Ratios of the intensity of emissive transitions A vs. B (orange) and B vs. C (green) as a function of polarity. | ||
The variation of the intensity ratios between the major transition (A, 614 nm) and transition B (approx. 617 nm), and between transitions B and C (approx. 621 nm), with Reichardt's normalised solvent polarity parameter, showed a strong correlation in each case (Fig. 5). The ratios for DMF ENT (0.404, Table S1) appeared to be anomalous, and the ratios in chloroform ENT (0.259) did not ‘fit’ well to the trend. In the latter case this could be caused by aggregation in non-polar media, as observed in related systems.3 However, the overall trends suggest that the energies of transitions B and C are primarily determined by solvent polarity, and the intensities of transitions A and C are more susceptible to variation in solvent polarity than transition B. The overall integrated emission intensity ratio for the ΔJ = 2 vs. ΔJ = 1 manifolds exhibits a modest increase with increasing solvent polarity, consistent with enhanced ligand polarisability in more polar media.
Similar behaviour was observed in the behaviour of the ΔJ = 4 manifold (Fig. S4, ESI†). In this case, the longest wavelength transition, F, exhibited a bathochromic shift as solvent polarity decreased, while transitions D and E appeared to coalesce, and increase in intensity. The weaker transitions between 702 and 715 nm were not investigated in detail. The significant modulation in spectral form of the ΔJ = 4 manifold is consistent with the energies of various ligand field states of the 7F4 level changing as solvent polarity changes.
The ratio of the intensity of the major transition, E, against the lower energy transition F showed a non-linear decrease as solvent polarity was increased (Fig. S5, ESI†). Similarly, the intensity of the major transition, E, relative to the intensity of the magnetic dipole allowed transition ΔJ = 1, which is commonly assumed to be independent of the environment, exhibited the same decrease. Both relationships appear to level off as solvent polarity increases beyond ENT = 6, suggesting that a limit is reached where increasing solvent polarity does not induce further spectral change.
Judd–Ofelt theory is commonly invoked to rationalise the intensity of various transitions in Eu(III) emission spectra.16,17 However, these early mathematical models of dipole strength failed to account for the hypersensitive nature of certain Ln(III) transitions.15 Whilst the observed hypersensitive transitions obey the selection rules for electric quadrupole transitions, the magnitudes of the hypersensitive transitions far exceed those predicted for quadrupole transitions.18
An alternative explanation was proposed, where electric quadrupole allowed transitions (e.g., 5D0 → 7F2) gain electric dipole strength via a coupling mechanism, involving the quadrupole on the Eu3+ ion with induced dipoles on the ligand.19 In systems which are not cylindrically symmetric, it is necessary to include the anisotropy of the ligand polarisabilities to calculate oscillator strengths for hypersensitive transitions.20 Therefore, the intensity of these hypersensitive transitions is related not only to the polarisability of the ligand dipole, but also to the directional dependence of its polarisability. Thus, small variations in local solvation and the coupling of solvent dipoles with ligand dipoles may account, at least in part, for the changes in intensity observed with these ‘hypersensitive’ transitions.
Solvent effects in the CPL of [EuL2]
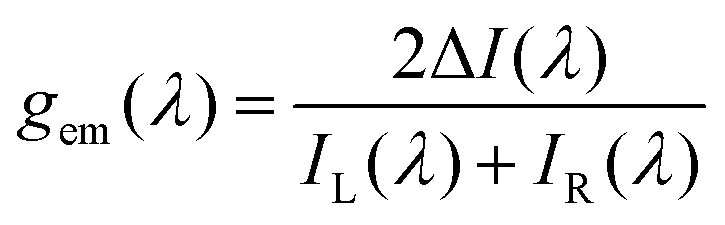
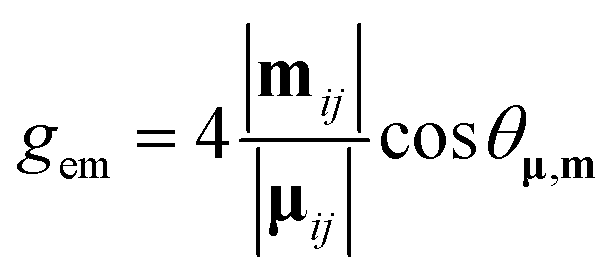
In addition to solvent modulation of the total emission spectral profile for [EuL2], changes in the spectral form of CPL emission were also observed. CPL often provides increased resolution of transitions close in energy, as they may have opposite sign. However, it must be noted that the factors controlling CPL signal intensity are not the same as those regulating the oscillator strength of total emission transitions in lanthanide complexes.20,21The CPL spectrum of Λ-[EuL2] was recorded in ten different solvents (Fig. 6 and Fig. S7, ESI,†Table 1), and significant effects were observed. In particular, the somewhat broad ΔJ = 1 manifold resolved into two transitions of opposite sign in methanol and trifluoroethanol. It had been noted earlier, with the P-methyl phosphinate analogues of [EuL2], that CPL transitions of opposite sign were observed within the ΔJ = 1 manifold in methanol.12
 | ||
| Fig. 6 Expansion of the circularly polarised emission spectra of Λ-[EuL2] in various solvents showing the ΔJ = 1 and 2 manifolds (Fig. S7, ESI† for full spectra). | ||
| Wavelength/nm | TFE | MeOH | EtOH | i PrOH | MeCN | DMF | t BuOH | Acetone | CH2Cl2 | CHCl3 |
|---|---|---|---|---|---|---|---|---|---|---|
| 594 | −0.051 | −0.047 | −0.039 | −0.053 | −0.065 | −0.068 | −0.081 | −0.089 | −0.103 | −0.118 |
| 614 | −0.002 | −0.002 | +0.002 | +0.009 | +0.010 | +0.014 | +0.019 | +0.017 | +0.025 | +0.029 |
| 686 | −0.028 | −0.027 | −0.025 | −0.023 | −0.025 | −0.022 | −0.020 | −0.024 | −0.018 | −0.015 |
| 691 | +0.034 | +0.032 | +0.030 | +0.031 | +0.031 | +0.028 | +0.029 | +0.027 | +0.024 | +0.026 |
| 695.5 | −0.035 | −0.031 | −0.030 | −0.032 | −0.031 | −0.025 | −0.030 | −0.030 | −0.025 | −0.029 |
| 703 | −0.135 | −0.125 | −0.141 | −0.163 | −0.164 | −0.109 | −0.186 | −0.176 | −0.141 | −0.152 |
| 708 | +0.332 | +0.290 | +0.298 | +0.325 | +0.336 | +0.191 | +0.379 | +0.377 | +0.275 | +0.322 |
A similar effect can be seen in the ΔJ = 2 manifold (Fig. 6 and Table 1). As solvent polarity increases, the intensity of the major transition at 613 nm decreased, accompanied by the appearance of a negative CPL transition, visible for ethanol, methanol and trifluoroethanol. Such behaviour contrasts with the changes seen in the total emission spectrum, where the total intensity simply appeared to increase slightly as solvent polarity increased (Fig. 5).
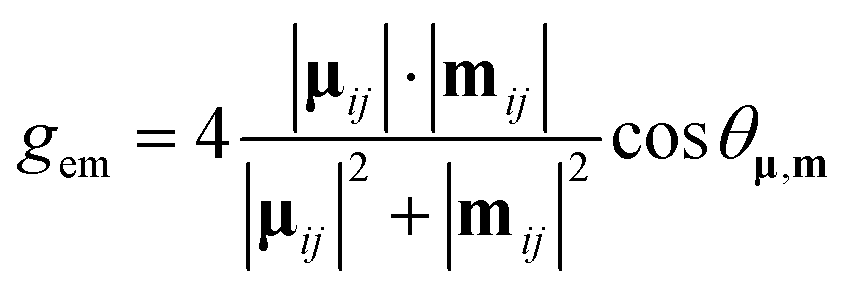
The magnitude of the emission dissymmetry factor, gem, of the 614 nm ΔJ = 2 transition decreased by more than a factor of 10 on changing from chloroform to ethanol and inverted sign for trifluoroethanol (TFE) and methanol (Table 1). Such a change can be rationalised by considering the factors controlling the magnitude of gem, eqn (1) and (2), where assuming that the magnetic transition dipole moment, |mij|, is much smaller than the electric dipole transition moment, |μij|, eqn (3) results.
 | (1) |
 | (2) |
 | (3) |
Changes were also observed in the circularly polarised emission profile of the ΔJ = 4 manifold (Fig. 7). However, in this case, the behaviour in response to changing solvent polarity differed from that found in the ΔJ = 1 and ΔJ = 2 manifolds. Here, the CPL intensity decreased as solvent polarity increased, in line with changes in total emission intensity. Examination of the gem values (Table 1), revealed no strong correlation with solvent polarity.
 | ||
| Fig. 7 Expanded circularly polarised emission spectra of Λ-[EuL2] in various solvents, observing the ΔJ = 4 manifold. | ||
A plot of the intensity ratio of the CPL at 593 nm (ΔJ = 1) to the CPL at 613 nm (ΔJ = 2) versus solvent polarity showed a positive correlation which became steeper at higher solvent polarity. It is possible that the series of alcohols (isopropanol, ethanol, methanol and trifluoroethanol) which correspond to the solvents with polarities above ENT 0.50, act as hydrogen bond donors in specific hydrogen bonding interactions with the P–O bond of each complex, in contrast to less polar and aprotic solvents. In this set, TFE is the best H-bond donor. Such a difference may account for the change in the gradient of the plot. When comparing the relative intensities of the major transitions of ΔJ = 1 or 2 against the ΔJ = 4, it was clear that the ratios both decreased as solvent polarity increases (Fig. S6, ESI†). The biggest change was observed when comparing ΔJ = 2 and ΔJ = 4, where in chloroform the ΔJ = 2 CPL was more than 6 times more intense than that of the ΔJ = 4. In trifluoroethanol, this ratio is almost reversed, with the ΔJ = 4 manifold approximately 5 times more intense than ΔJ = 2.
Solvent effects in the total emission and CPL behavior of [EuL3]
Since the work on [EuL2] had provided clear evidence of solvent dependent emission, it was decided to investigate whether the same behaviour was observed with [EuL3], which lacks a strong ICT transition. Excitation of the complex occurs via a traditional ligand triplet mediated pathway. If similar solvatochromic behaviour were observed with a system without an extended chromophore, it would confirm that the effect of solvent polarity could be attributed to perturbations in the donor ability and/or polarisability of the pyridyl and phosphinate groups, and not simply to effects associated with dipolar coupling involving the extended chromophore dipole.The p-Br pyridyl substituted complex, [EuL3], displayed solvent dependent emission behaviour (Fig. 8). In total emission spectra, variation was observed not only in the electric dipole allowed manifolds, ΔJ = 2 and 4 but also in the magnetic dipole allowed ΔJ = 1 manifold. Inspection of the ΔJ = 1 manifold (585–600 nm) revealed a consistent profile for the series of alcohols and acetonitrile. A broadening was evident in dichloromethane, separating into a major and minor peak in chloroform (Fig. 8). The fine structure of the ΔJ = 1 manifold is determined by the crystal field splitting of the 7F1 level, associated with the nature and polarisability of the donor atoms in the ligand.5,6,15 In C3 symmetric systems, the ΔJ = 1 manifold exists as a non-degenerate singlet and a twofold degenerate pair of crystal field states. The order and separation of these levels is primarily dependent on the size of the crystal field parameter, B02. Thus, the spectrum exhibits two bands corresponding to the degenerate mJ = ±1 pair and the mJ = 0 singlet, whose separation is B02 ∝ n lower symmetry, the degeneracy of the mJ = ±1 states is lifted and B22s non-zero. Often the crystal field splitting is sufficiently small in this complex that the different transitions are not resolved. However, the appearance of the shoulder in the ΔJ = 1 manifold of [EuL3] in chloroform suggested that there is a specific interaction present that increases the magnitude of the crystal field splitting. Independent analysis with the diamagnetic Y complexes of structural analogues of [EuL3] (where the Br is replaced by an iPr group, and the methylphosphinate by a carboxylate) has shown that aggregation of the complex occurs in CHCl3 and CH2Cl2, as revealed by NMR DOSY experiments.3
 | ||
| Fig. 8 (left) The emission spectra of [EuL3] in various solvents (295 K, λexc 268 nm). Spectra are normalised to the integrated emission intensity of the ΔJ = 1 manifold. (right) Expansion showing the ΔJ = 1 and 2 manifolds. | ||
In the ΔJ = 2 manifold, dichloromethane and chloroform also exhibit behaviour that cannot be correlated to the solvent polarity parameter. In the alcohol series, as polarity decreases, the longest wavelength transition reduced in intensity and became a more pronounced shoulder on the neighbouring transition. Meanwhile, the intensity of the shortest wavelength transition (at 613 nm) showed very little variation. In contrast, for dichloromethane and chloroform, the transition at 613 nm was significantly weaker and the two transitions at longer wavelength were not resolved, as would be expected if the spectra followed a simple solvent polarity trend (i.e. the spectra for chloroform and dichloromethane might be expected to resemble that of tBuOH). In fact, in chloroform, the manifold appeared simply as two broad bands of approximately equal intensity.
The ΔJ = 4 manifold also displays specific solvent effects for dichloromethane and chloroform (Fig. S8, ESI†). Ignoring these two solvents, the general behaviour was similar to that displayed by [EuL2], with the longest wavelength transition moving to lower energy with decreasing solvent polarity and the lower wavelength and central transitions coalescing. The anomalous behaviour evident in chloroform and dichloromethane is again consistent with the hypothesis of complex aggregation, discussed above.3
In the CPL spectra of [EuL3], the sign and size of transitions in the ΔJ = 1 and 2 manifolds showed a striking variation with solvent (Table 2 and Fig. 9). In the ΔJ = 1 manifold of Λ-[EuL3] for more polar solvents, the CPL spectrum showed a transition of positive sign at 592 nm, followed by a negative transition at 594 nm (Fig. 9, Table 2 and Fig. S9, ESI†). Such a sign sequence is the same as in CPL spectra of several P-methyl phosphinate complexes, recorded in polar solvents such as water and methanol.13,21
| Wavelength/nm | TFE | MeOH | EtOH | iPrOH | MeCN | t BuOH | CH2Cl2 | CHCl3 |
|---|---|---|---|---|---|---|---|---|
| 592 | +0.017 | +0.024 | +0.007 | −0.006 | +0.021 | +0.079 | ||
| 593 | −0.036 | −0.047 | ||||||
| 594.5 | −0.031 | −0.039 | −0.028 | −0.028 | −0.038 | −0.052 | ||
| 613 | +0.002 | +0.004 | +0.007 | +0.007 | +0.013 | +0.016 | +0.014 | −0.015 |
| 615.5 | −0.006 | −0.007 | −0.008 | −0.008 | +0.001 | +0.003 | −0.011 | −0.022 |
| 686 | −0.024 | −0.024 | −0.024 | −0.024 | −0.019 | −0.017 | −0.025 | −0.018 |
| 690 | +0.024 | +0.027 | +0.026 | +0.026 | +0.022 | +0.018 | +0.020 | +0.016 |
| 695.5 | −0.028 | −0.032 | −0.029 | −0.029 | −0.025 | −0.024 | −0.027 | −0.022 |
| 703 | −0.025 | −0.032 | −0.042 | −0.042 | −0.042 | −0.040 | −0.025 | −0.009 |
| 708 | +0.049 | +0.066 | +0.080 | +0.080 | +0.059 | +0.068 | +0.052 | +0.036 |
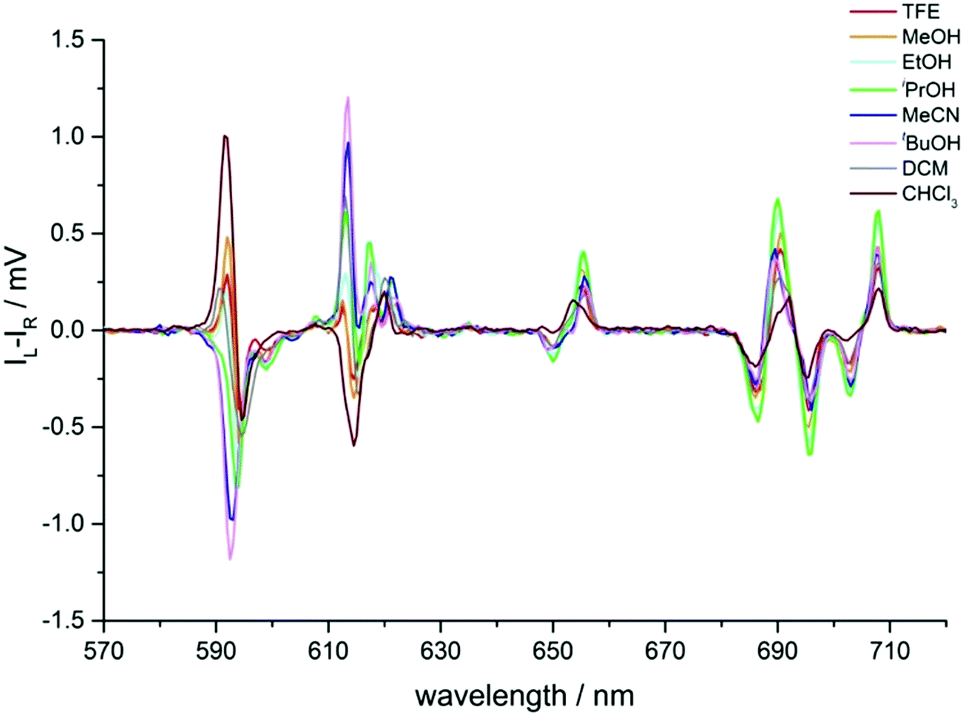 | ||
| Fig. 9 Circularly polarised emission spectra of Λ-[EuL3] in various solvents showing the sign inversion of certain transitions (295 K, λexc 268 nm). Spectra are not normalised (see Table 2). | ||
As solvent polarity decreased, the transition at 592 nm inverted sign and coalesced with the 594 nm transition, resulting in a single negative transition centred at 593 nm for MeCN and tBuOH. In tBuOH, the pattern in the ΔJ = 1 manifold more closely resembled the profile of the same transition in [EuL2]. However, in dichloromethane and chloroform, positive and negative transitions were observed. Additionally, the transitions shifted in energy and moved slightly further apart, which may explain the appearance of the shoulder in the same manifold in the total emission spectrum, i.e. the transitions are sufficiently different in energy to be observed in total emission.
In contrast to the behaviour of [EuL2], the changes of the ΔJ = 4 manifold for [EuL3] were much less clear (Fig. S10, ESI†). No coalescence of emission bands in the CPL spectra was observed, although in chloroform the transition around 690 nm shifted slightly to longer wavelength.
Conclusions and summary
The vast majority of published examples of solvent effects in lanthanide absorption, emission and CPL spectroscopy can normally be rationalised in terms of two different effects. Firstly, and notably for cases with an ICT state, the energy of the ground and the excited state of the sensitising chromophore is dependent on solvent polarity. Often this leads to observation of a ‘switching on’ of lanthanide emission, as the energy of the ICT excited state has often been found to increase in less polar media, permitting efficient downhill energy transfer to the lanthanide accepting state.7,9Secondly, the constitution of the complexes under study may change when the solvent is varied, notably in solvents which are good donors for a lanthanide ion, such as water, DMF or DMSO, leading to dissociative exchange of a weakly bound ligand. This process may be irreversible, or it may be reversible but fast with respect to the emission timescale, causing spectral change or broadening often indicated by poorly resolved spectral fingerprints in solution.10b–d
In two cases examined here with ICT transitions, very different solvent effects with complexes of similar structure were observed by absorbance spectroscopy. With [EuL1], negative solvatochromism was exhibited, i.e. the separation of the ground and excited states increased as solvent polarity increased, consistent with a larger dipole moment in the ICT ground state electronic structure. An intuitive rationale for the unusual negative solvatochromism is that N/O lone pair repulsion in the aryl ring destabilises the ground state structure in non-polar media, and this unfavourable interaction is significantly reduced in polar media, especially polar protic media, where favourable NH⋯O hydrogen bonding can occur. With [EuL2] in contrast, positive solvatochromism was found, with a bathochromic shift in more polar media. The energy of the ICT excited state is of much importance in finding the best solvent conditions for optimising the sensitisation efficiency of lanthanide luminescence, as the process needs to be energetically downhill, with an energy gap of >10kT to obviate back energy transfer from the lanthanide excited state to a ligand based state.
The cases examined discussed here relate to nine-coordinate complexes of defined constitution and configuration (i.e. one major emissive species in solution) with no metal bound solvent. Evidence is collated to suggest that solvatochromism may occur in both the emission and CPL profiles of all chiral lanthanide complexes, because the nature of the solvent perturbs the ligand field experienced by the metal ion. Systems with small ligand field splittings, such as those lying close to trigonal symmetry, are particularly sensitive to such a perturbation. Thus, both the magnitude and sign of the crystal field parameter, B02 determining the form of the ΔJ = 1 transition in Eu(III) complexes, can change when the solvent is varied, even when the solvent is not in the first coordination sphere.5,10e These effects are demonstrated here in the behaviour of the hypersensitive ΔJ = 2 transition, where CPL sign inversion has been observed (Fig. 6, 7 and 9). Such an interpretation is of relevance to other examples reported recently, where CPL changes accompany a variation in the constitution (speciation) of the lanthanide complex.10b–d
In the examples presented and related examples of structural analogues,11–13 the |gem| values and the sign sequence of the main 5 transitions of the ΔJ = 4 manifold was independent of solvent, strongly suggesting that the absolute configuration of the complex, can be assessed more confidently by examining the CPL sign sequence, in this manifold. For this family of C3 symmetric complexes, this sequence is −/+/−/−/+ for the Λ enantiomer, for example.
Why then is the ligand field changing with solvent, and why are certain CPL gem values (Tables 1 and 2) so sensitive to variation, as the solvent is permuted? In polar protic media, evidence for specific solvent interactions has been reported with similar systems,4–6 and was ascribed to hydrogen bonding to the ligand carboxylate or phosphinate oxygen atoms.5 It was shown that changes in the magnitude and sign of the axiality (the principal component of the magnetic susceptibility tensor) could explain the solvent dependence of the NMR paramagnetic shift. The solvent directly influenced the average polar angle of the three anionic oxygen donor atoms that became slightly more ‘axial’ in water, for example, where a short H bond was observed in an X-ray study involving the metal-coordinated carboxylate oxygen atom and a water molecule.5
In addition, the orientation of solvent dipoles perturbs the Ln–O and Ln–Npy dipolar and quadrupolar interactions with the lanthanide ion, in a manner that has been anticipated in early theoretical work.16–22 Indeed, the sensitivity of the emission profiles of these complexes reflects the importance of overall dipolar molecular polarisability in determining the ligand field, notably in the systems under study here with the polarisable pyridyl moiety.
An additional factor needs to be considered to rationalise the CPL behaviour. The gem values are dependent not only on the electric and magnetic dipole strength of a given transition, eqn (1), but also on the angle θ between the electric and magnetic dipole transition moments, reaching a maximum when the angle approaches 0 or 180°, and being zero when orthogonal. Given the directional dependence of the main component of the magnetic susceptibility tensor and the anisotropy of electric dipolar polarisability, it is perhaps not surprising that the angular dependence of solvent dipolar coupling to ligand dipoles can have a large impact, and probably plays a key role in determining the sensitivity of the CPL and of gem to solvent variation (Fig. 6, 7 and 9; Tables 1 and 2).
Experimental details
Details of the synthesis, chiral HPLC analysis and resolution of the Δ and Λ enantiomers of the Eu(III) complexes have been reported earlier.11–13Optical measurements
All solution state optical analyses were carried out in quartz cuvettes with a path length of 1 cm. UV/vis absorbance spectra were measured on an ATI Unicam UV/vis spectrometer (Model UV2) using Vision software (version 3.33). Emission spectra were recorded using either an ISA Jobin-Yvon Spex Fluorolog-3 luminescence spectrometer using DataMax software (version 2.2.10) or a HORIBA Jobin-Yvon Fluorolog-3 luminescence spectrometer equipped with an iHR320 module, which selects either a HORIBA FL-1073 (Hammatsu R928P) photomultiplier tube or a HORIBA Synapse BIDD CCD for detection of emitted light, using FluorEssence software (based on Origin® software). Lifetime measurements were carried out using a PerkinElmer LS55 spectrometer using FL Winlab software.CPL spectra were recorded on a custom-built spectrometer consisting of a laser driven light source (Energetiq EQ-99 LDLS, spectral range 170–2100 nm) coupled to an Acton SP2150 monochromator (600 g nm−1, 300 nm, Blaze) that allows excitation wavelengths to be selected with a 6 nm FWHM band-pass. The collection of the emitted light was facilitated (90° set-up) by a lock-in amplifier (Hinds Instruments Signaloc 2100) and photo-elastic modulator (Hinds Instruments Series II/FS2AA). The differentiated light was focused onto an Acton SP2150 monochromator (1200 g nm−1, 500 nm Blaze) equipped with a high sensitivity cooled Photo Multiplier Tube (Hamamatsu H10723-20 PhotoSensor). Red correction was embedded in the detection algorithm and was enabled using a calibrated Ocean Optics lamp. Spectra were recorded with 0.5 nm spectral intervals and 500 μs integration time, using a 5 spectral average sequence for europium(III) complexes. The monochromators, PEM control unit and lock-in amplifier were interfaced with a desktop PC and controlled by LabView code.
Author contributions
JDF and ATF synthesised all compounds and recorded and analysed spectroscopic data. DP managed the project. All authors discussed the experimental results, wrote and edited the manuscript.Conflicts of interest
There are no conflicts to declare.Acknowledgements
We thank EPSRC and Cisbio Bioassays for studentship support (ATF and JDF).References
- D. Parker, E. A. Suturina, I. Kuprov and N. F. Chilton, Acc. Chem. Res., 2020, 53, 1520–1534 CrossRef CAS PubMed.
- R. S. Dickins, D. Parker, J. I. Bruce and D. J. Tozer, Dalton Trans., 2003, 1264–1271 RSC.
- A. W. Poh, J. A. Aguilar, A. M. Kenwright, K. Mason and D. Parker, Chem. – Eur. J., 2018, 24, 16170–16175 CrossRef CAS PubMed.
- M. Vonci, K. Mason, E. A. Suturina, A. T. Frawley, I. Kuprov, E. J. L. McInnes, D. Parker and N. F. Chilton, J. Am. Chem. Soc., 2017, 139, 14166–14172 CrossRef CAS PubMed.
- K. Mason, A. C. Harnden, C. W. Patrick, A. W. Poh, A. S. Batsanov, E. A. Suturina, M. Vonci, E. J. McInnes, N. F. Chilton and D. Parker, Chem. Commun., 2018, 54, 8486–8489 RSC.
- E. A. Suturina, K. Mason, C. F. G. C. Geraldes, I. Kuprov and D. Parker, Angew. Chem., Int. Ed., 2017, 56, 12215–12218 CrossRef CAS PubMed; M. Vonci, K. Mason, E. R. Neil, D. S. Yufit, E. J. McInnes, D. Parker and N. F. Chilton, Inorg. Chem., 2019, 58, 5733–5745 CrossRef PubMed.
- A. D’Aleo, A. Picot, A. Beeby, J. A. G. Williams, B. Le Guennic, C. Andraud and O. Maury, Inorg. Chem., 2008, 47, 10258–10268 CrossRef PubMed.
- T. N. Parac-Vogt, K. Binnemans and C. Görller-Walrand, J. Chem. Soc., Dalton Trans., 2002, 1602–1606 RSC; L. Di Bari and P. Salvadori, Coord. Chem. Rev., 2005, 249, 2854–2878 CrossRef CAS; O. Kotova, S. Blasco, B. Twamley, J. O’Brien, R. D. Peacock, J. A. Kitchen, M. Martinez-Calvo and T. Gunnlaugsson, Chem. Sci., 2015, 6, 457–471 RSC; H. Tsukube and S. Shinoda, Chem. Rev., 2002, 102, 2389–2404 CrossRef PubMed; Y. Kitagawa, R. Ohno, T. Nakanishi, K. Fushimi and Y. Hasegawa, Photochem. Photobiol. Sci., 2017, 16, 683–689 CrossRef PubMed.
- Y. Bretonniere, M. J. Cann, D. Parker and R. Slater, Org. Biomol. Chem., 2004, 2, 1624–1632 RSC; M. Soulie, F. Latzko, E. Bourrier, F. Placide, S. J. Butler, R. Pal, J. W. Walton, P. L. Baldeck, B. Le Guennic, C. Andraud, J. M. Zwier, L. Lamarque, D. Parker and O. Maury, Chem. – Eur. J., 2014, 20, 8636–8646 CrossRef CAS PubMed; E. R. Neil, A. M. Funk, D. S. Yufit and D. Parker, Dalton Trans., 2014, 43, 5490–5504 RSC; W.-S. Lo, J. Zhang, W.-T. Wong and G.-L. Law, Inorg. Chem., 2015, 54, 3725–3727 CrossRef PubMed; M. Tropiano, O. A. Blackburn, J. A. Tilney, L. R. Hill, T. J. Sørensen and S. Faulkner, J. Lumin., 2015, 167, 296–304 CrossRef; K. Singh, R. Boddula and S. Vaidyanathan, Inorg. Chem., 2017, 56, 9376–9379 CrossRef PubMed; S. Shuvaev, R. Pal and D. Parker, Chem. Commun., 2017, 53, 6724–6727 RSC; W.-S. Lo, W.-T. Wong and G.-L. Law, RSC Adv., 2018, 6, 74100–74109 RSC.
- For recent reviews and extended discussion: see (a) J. L. Lunkley, N. M. Nguyen, K. M. Tuminaro, D. Margittai and G. Muller, Inorganics, 2018, 6, 87–113 CrossRef PubMed; (b) Y. Kitagawa, M. Tsurui and Y. Hasegawa, ACS Omega, 2020, 5, 3786–3791 CrossRef CAS PubMed ; for recent examples of CPL solvent sensitivity: ; (c) S. Wada, Y. Kitagawa, T. Nakanishi, M. Gon, K. Tanaka, K. Fushimi, Y. Chujo and Y. Hasegawa, Sci. Rep., 2018, 8, 16395 CrossRef PubMed; (d) Y. Kono, N. Hara, M. Shizuma, M. Fujiki and Y. Imai, Dalton Trans., 2017, 46, 5170–5174 RSC; (e) L. Dai, W.-S. Lo, I. D. Coates, R. Pal and G.-L. Law, Inorg. Chem., 2016, 55, 9065–9075 CrossRef CAS PubMed.
- M. Starck, J. D. Fradgley, R. Pal, L. Lamarque, R. Pal and D. Parker, Chem. – Eur. J., 2021, 27, 766–777 CrossRef CAS PubMed.
- A. T. Frawley, R. Pal and D. Parker, Chem. Commun., 2016, 52, 13349–13352 RSC; A. T. Frawley, H. V. Linford, M. Starck, R. Pal and D. Parker, Chem. Sci., 2018, 9, 1042–1049 RSC.
- N. H. Evans, R. Carr, M. Delbianco, R. Pal, D. S. Yufit and D. Parker, Dalton Trans., 2013, 42, 15610–15616 RSC; S. J. Butler, M. Delbianco, N. H. Evans, A. T. Frawley, R. Pal, D. Parker, R. S. Puckrin and D. S. Yufit, Dalton Trans., 2014, 43, 5720–5730 RSC.
- C. Reichardt, Chem. Rev., 1994, 94, 2319–2358 CrossRef CAS; C. Reichardt, Green Chem., 2005, 7, 339–351 RSC.
- K. Binnemans, Coord. Chem. Rev., 2015, 295, 1–45 Search PubMed.
- B. R. Judd, Phys. Rev., 1962, 127, 750–761 CrossRef CAS.
- G. S. Ofelt, J. Chem. Phys., 1962, 37, 511–520 CrossRef CAS.
- C. K. Jorgensen and B. R. Judd, Mol. Phys., 1964, 8, 281–290 CrossRef.
- S. F. Mason, R. D. Peacock and B. Stewart, Mol. Phys., 1975, 30, 1829–1841 CrossRef CAS.
- M. F. Reid and F. S. Richardson, Chem. Phys. Lett., 1983, 95, 501–506 CrossRef CAS; F. S. Richardson, M. T. Berry and M. F. Reid, Mol. Phys., 1986, 58, 929–945 CrossRef.
- F. S. Richardson, Inorg. Chem., 1980, 19, 2806–2812 CrossRef CAS; F. Gendron, B. Moore, O. Cador, F. Pointillart, J. Autschbach and B. Le Guennic, J. Chem. Theory Comput., 2019, 15, 4140–4155 CrossRef PubMed.
- R. Kuroda, S. F. Mason and C. Rosini, J. Chem. Soc., Faraday Trans. 2, 1981, 77, 2125–2140 RSC; F. S. Richardson, Chem. Phys. Lett., 1982, 86, 47–50 CrossRef CAS.
Footnote |
| † Electronic supplementary information (ESI) available: Addition total emission and CPL spectra, tables of solvent polarity values. See DOI: 10.1039/d1cp01686e |
| This journal is © the Owner Societies 2021 |