
 Open Access Article
 This Open Access Article is licensed under a
 Creative Commons Attribution 3.0 Unported Licence
Contrasting the EXAFS obtained under air and H2 environments to reveal details of the surface structure of Pt–Sn nanoparticles†
Haoliang
Huang
a,
Abu Bakr Ahmed Amine
Nassr
ab,
Verónica
Celorrio
 c,
Diego
Gianolio
c,
Christopher
Hardacre
d,
Dan J. L.
Brett
e and
Andrea E.
Russell
*a
c,
Diego
Gianolio
c,
Christopher
Hardacre
d,
Dan J. L.
Brett
e and
Andrea E.
Russell
*a
aSchool of Chemistry, University of Southampton, Highfield, Southampton, SO17 1BJ, UK. E-mail: a.e.russell@soton.ac.uk
bFraunhofer Institute for Microstructure of Materials and System, Walter-Hülse-Straße 1, 06120 Halle (Saale), Germany
cDiamond Light Source Ltd. Diamond House, Harwell Campus, Didcot, OX11 0DE, UK
dSchool of Natural Sciences, The University of Manchester, The Mill, Manchester, M13 9PL, UK
eDepartment of Chemical Engineering, University College London (UCL), London, WC1E 7JE, UK
First published on 11th May 2021
Abstract
Understanding the surface structure of bimetallic nanoparticles is crucial for heterogeneous catalysis. Although surface contraction has been established in monometallic systems, less is known for bimetallic systems, especially of nanoparticles. In this work, the bond length contraction on the surface of bimetallic nanoparticles is revealed by XAS in H2 at room temperature on dealloyed Pt–Sn nanoparticles, where most Sn atoms were oxidized and segregated to the surface when measured in air. The average Sn–Pt bond length is found to be ∼0.09 Å shorter than observed in the bulk. To ascertain the effect of the Sn location on the decrease of the average bond length, Pt–Sn samples with lower surface-to-bulk Sn ratios than the dealloyed Pt–Sn were studied. The structural information specifically from the surface was extracted from the averaged XAS results using an improved fitting model combining the data measured in H2 and in air. Two samples prepared so as to ensure the absence of Sn in the bulk were also studied in the same fashion. The bond length of surface Sn–Pt and the corresponding coordination number obtained in this study show a nearly linear correlation, the origin of which is discussed and attributed to the poor overlap between the Sn 5p orbitals and the available orbitals of the Pt surface atoms.
Introduction
Bimetallic nanoparticle catalysts are of research interest as they offer routes to obtain catalysts with improved activity, stability and selectivity, as compared to their monometallic counterparts.1–3 Studies of bimetallic nanoparticles mainly focus on the ratio4,5 and the mixing patterns (alloy, core-/multi-shell or aggregate mixtures)6–8 of the two constituent metals, and on the lattice strain of the de-alloyed shell in core–shell structures.9–11 Less attention has been paid to the structure of bimetallic surfaces, which is crucial in assessing the role of the second metal in catalysis. In particular, questions remain regarding the validity of assuming that the atomic arrangement on the surface is the same as that measured for the bulk. For example, it is established that clean solid surfaces usually contract due to unsaturated surface bonding,12,13 and on monometallic single crystals the extent of contraction has been found to increase when the atomic packing and density of the surface decreases.13,14 Surface contractions have also been found on monometallic nanoparticles and assessed using several approaches. The size-dependent lattice contraction of clean nanoparticles has been ascertained by bulk analytic techniques, such as X-ray absorption spectroscopy (XAS),15,16 X-ray diffraction17 and electron diffraction.18,19 Coherent electron diffraction accompanied by modelling studies was used to further ascertain that the lattice contraction originates from the outermost layers and can be correlated to the coordination number.20 The recent development of atomic resolution electronic tomography has enabled visualization of the surface displacement of each atom.21,22Ascertaining the details of the surface structure of bimetallic nanoparticles remains a challenge, especially the extent of surface contraction. Some understanding can be obtained using XAS, as it not only provides structural information regarding coordination environments, but also can extract the information of the guest metal independently from that of the host metal. However, the results must be interpreted with caution as the environment in which the XAS data were acquired can have a significant effect. The well-studied Pt–Sn nanoparticles (Pt as the host metal and Sn as the guest), catalysts for alkane dehydrogenation23–28 and electrocatalysts for CO and alcohol oxidation,4,8,29–31 may be used as an example. Decreases in the Sn–Pt bond length of 0.03 to 0.15 Å have been reported compared to that of the Pt3Sn structure.4,25,26,30,32–34 In some cases, the surface was oxidized, which changes the surface structure;4,25,26,30 whilst in other cases, harsh reduction conditions were used, which induces diffusion of Sn atoms into the interior of the nanoparticles.32–34 Although the varying results from such XAS results seem discouraging, we will show in the study described herein that XAS remains as a means of revealing the surface contraction for such bimetallic nanoparticles if the experiment is better designed to let XAS ‘see’ a clean, bimetallic surface without interference or with separable interference from the bulk.
In this study, H2 at room temperature was selected as an appropriate environment during XAS measurements to produce such clean bimetallic surfaces on dealloyed Pt–Sn nanoparticles, as this condition is capable of reducing the Pt surface oxides and, as will be demonstrated below, the oxidised surface Sn atoms of the Pt–Sn nanoparticles, whilst not resulting in diffusion of Sn. XAS data were first collected in air at room temperature to understand the Sn speciation and the surface-to-bulk Sn ratio, and the subsequent measurements in H2 at room temperature allowed assessment of the effect of the freshly formed Pt–Sn surface on the average Pt–Sn bond length. Pt–Sn nanoparticle samples with different surface-to-bulk Sn ratios were analysed using the same approach. The Pt–Sn bond length and the corresponding coordination number (CN), related specifically to the surface, were extracted using an improved fitting model combining the data measured in air and in H2. These two parameters were also obtained from two control samples, prepared such that the Sn was only present on the surface, and a correlation between bond length and coordination number is summarised and discussed.
Experimental
Preparation of dealloyed Pt–Sn
Three Pt–Sn samples, all with the same Pt:Sn ratio and total metal loading, were prepared as described previously29 by annealing a common parent Pt–Sn/C catalyst in different atmospheres. The parent Pt–Sn/C with a metal loading of 20 wt% was synthesized by a conventional polyol method. Briefly, 200 mg of the Vulcan XC-72R carbon black and 200 mg of NaOH were dispersed into 50 ml of ethylene glycol/H2O (3![[thin space (1/6-em)]](https://www.rsc.org/images/entities/char_2009.gif) :1 v/v) solution. Into this suspension, 100 mg of H2PtCl6·6H2O and 16 mg of SnCl2·2H2O were dissolved. After being stirred for 1 hour and then sonicated for 15 min, the suspension was heated to 160 °C and maintained at this temperature for 2 hours. The product was collected using a centrifuge, washed with a 50% ethanol aqueous solution and dried under vacuum at 80 °C. The parent Pt–Sn/C was annealed at 250 °C in air, in Ar and in H2 (5%, balanced by N2), yielding dealloyed Pt–Sn, partly alloyed Pt–Sn, and alloyed Pt–Sn, respectively.
:1 v/v) solution. Into this suspension, 100 mg of H2PtCl6·6H2O and 16 mg of SnCl2·2H2O were dissolved. After being stirred for 1 hour and then sonicated for 15 min, the suspension was heated to 160 °C and maintained at this temperature for 2 hours. The product was collected using a centrifuge, washed with a 50% ethanol aqueous solution and dried under vacuum at 80 °C. The parent Pt–Sn/C was annealed at 250 °C in air, in Ar and in H2 (5%, balanced by N2), yielding dealloyed Pt–Sn, partly alloyed Pt–Sn, and alloyed Pt–Sn, respectively.
Preparation of SnO2–Pt/C
SnO2–Pt/C was synthesized by hydrolysing SnO32− in a suspension of a commercial (Johnson Matthey) Pt/C (60 wt%, ∼3 nm diameter Pt particles determined via TEM). 150 mg of the Pt/C was dispersed in 75 ml of H2O by sonication. To the suspension, 412 μl of 100 mg ml−1 Na2SnO3·3H2O aqueous solution was added, followed by 30 min stirring and 5 min sonication. The suspension was then heated to 90 °C and maintained at this temperature for 1 hour. The sample was collected by centrifugation, washed with water for at least 3 times and dried under vacuum.Preparation of Snad–Pt/C
Snad–Pt/C was prepared by depositing Sn ad-atoms on the commercial Pt/C using the surface organometallic chemistry (SOMC) approach. 120 mg of the Pt/C was loaded in a gas-tight Schlenk tube. After the air inside the tube was replaced by flowing N2 for 20 min, the gas was switched to H2 (FIRE RISK, never let Pt nanoparticles meet H2 and air at the same time) and maintained in constant H2 flow for 20 min to reduce surface oxides of the Pt nanoparticles. The resulting water vapour was removed by heat treatment at ∼100 °C for 30 min under N2 flow. After the reduced and dried Pt/C was cooled down under N2 flow, 2 ml anhydrous heptane solution containing the calculated amount of tetrabutyltin (SnBu4, 96%, ACROS Organics) was added into the reaction tube using a syringe. The suspension was stirred for 10 min in N2. Then, the atmosphere was switched to H2, followed by 30 min stirring at room temperature, 30 min at 50 °C and 2 hours at 90 °C. The solid product was allowed to cool down to room temperature. The residual H2 inside the reaction tube was replaced by N2, and the gas out-let of the reaction tube was open to ambient atmosphere overnight, to passivate the synthesized catalyst by a small amount of air leaking into the reaction vessel (FIRE RISK, never expose the freshly reduced sample to air directly). The sample was stored in a gas-tight vial.Characterisation
X-Ray absorption (XAS) measurements were carried out at the Pt L3 and Sn K edges on the B18 beamline at Diamond Light Source (UK) using Quick EXAFS mode with a ring energy of 3.0 GeV and a ring current of 299–302 mA. Each sample was prepared by grinding and mixing with boron nitride (BN) to form a homogeneous mixture, and then pressed into a pellet. The pellets were loaded into a gas-tight cell with Kapton windows, in which the atmosphere was either air or H2. The XAS spectra were measured in transmission using ion chambers, with the exception of those for the SnO2–Pt/C sample measured in fluorescence using a 36-element Ge detector. In all cases, a Pt or Sn foil was measured in the reference channel along with the sample to provide energy calibration.The data reduction and curve fitting of the measured XAS spectra were carried out using the Demeter software package (ATHENA and ARTEMIS).35 The edge step of each spectrum was normalized by subtracting the linear pre-edge and quadratic post-edge function, and the energy shift was calibrated by choosing the zero crossing in the second derivative of all spectra to be E0 and then assigning the E0 of reference spectra to the corresponding tabulated value provided by ATHENA. The background of extended X-ray fine structure (EXAFS) was subtracted using the AUTOBKG algorithm present in ATHENA. EXAFS fitting was carried out in ARTEMIS. Values for the amplitude reduction factor, extracted from fitting of the Pt foil and a SnO2 standard, were determined to be 0.84 for Pt and 1.03 for Sn.
Results and discussion
As reported in our previous work regarding carbon-supported Pt–Sn electrocatalysts,29 the surface-to-bulk Sn ratio (or the extent of alloying) of the Pt–Sn bimetallic particles can be varied by the atmosphere in which the parent Pt–Sn sample is annealed, whilst keeping the Pt-to-Sn ratio constant. Annealing in H2 results in well-alloyed nanoparticles, partially alloyed nanoparticles result from annealing in Ar, and dealloyed nanoparticles, in which most of Sn is segregated to the surface, by annealing in air. Basic structural characterisations of the Pt–Sn samples, such as TEM, XRD and XPS, as well as CO stripping voltammograms can be found in Fig. S1–S4 and Table S1 (ESI†). In the study reported, herein, the detailed structure and the configuration of Sn species of the dealloyed Pt–Sn sample were further analysed using XANES and EXAFS.After being dealloyed by heat treatment in air at 250 °C for 2 h, both the Sn and Pt are oxidized, as indicated by the similarity of the Sn K-edge XANES to that for a SnO2 reference (Fig. 1) and by the increased whiteline intensity compared to a Pt foil at Pt L3-edge (Fig. S5, ESI†). Further inspection of the Sn K-edge XANES spectra reveals a small yet discernible decrease of the whiteline intensity compared to that of the reference, suggesting not all Sn atoms were fully oxidized into SnIV, as in SnO2.
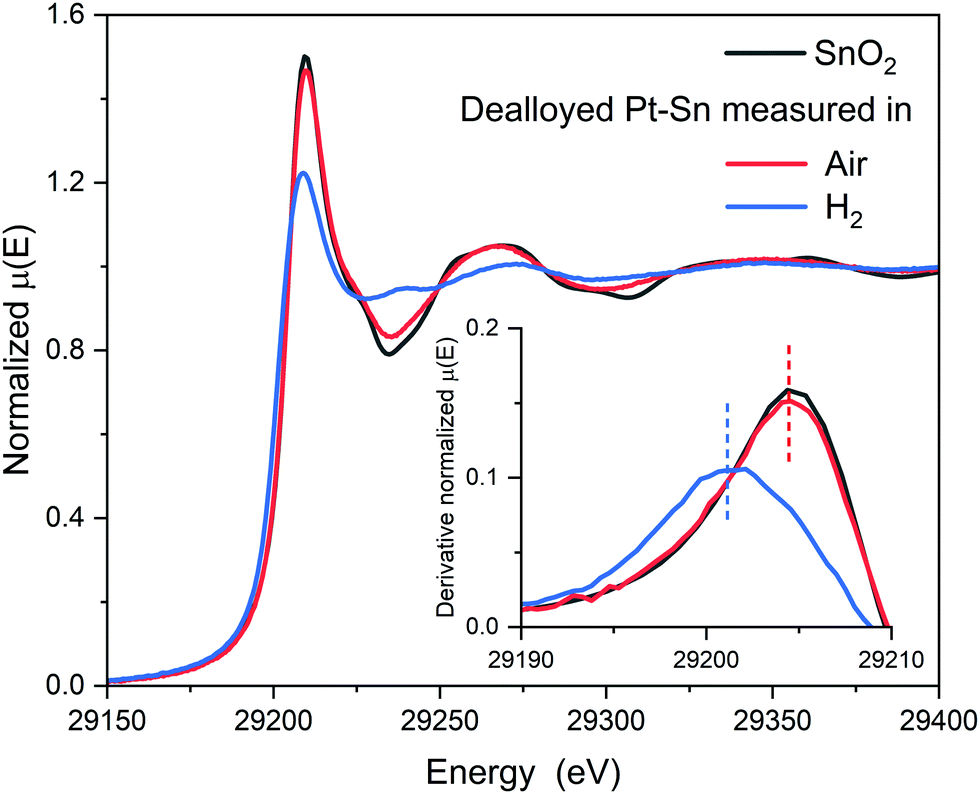 | ||
| Fig. 1 Sn K-edge XANES spectra of the dealloyed Pt–Sn samples measured in air and in H2, along with their 1st derivative at the rising edge. The comparison shows a decreased whiteline intensity and a shift of edge position (vertical dash lines) towards low energy when the dealloyed sample was exposed to H2, indicating the reduction of SnIV. | ||
The local coordination of the oxidized Sn species was then studied by Sn K-edge EXAFS in k-space and R-space (Fig. 2). Compared to a SnO2 reference, the dealloyed Pt–Sn shows similar oscillations in the low k (3–9 Å−1) and low R regions (1–2 Å) with lower intensity, but loses fine structures in the high k (>9 Å−1) and high R regions (3–4 Å). Since the features at high k and high R mainly correspond to two Sn–Sn scattering paths in the SnO2 rutile structure (Fig. S6, ESI†), the Sn species of the dealloyed Pt–Sn sample, although coordinated to oxygen atoms, lack long-range order.
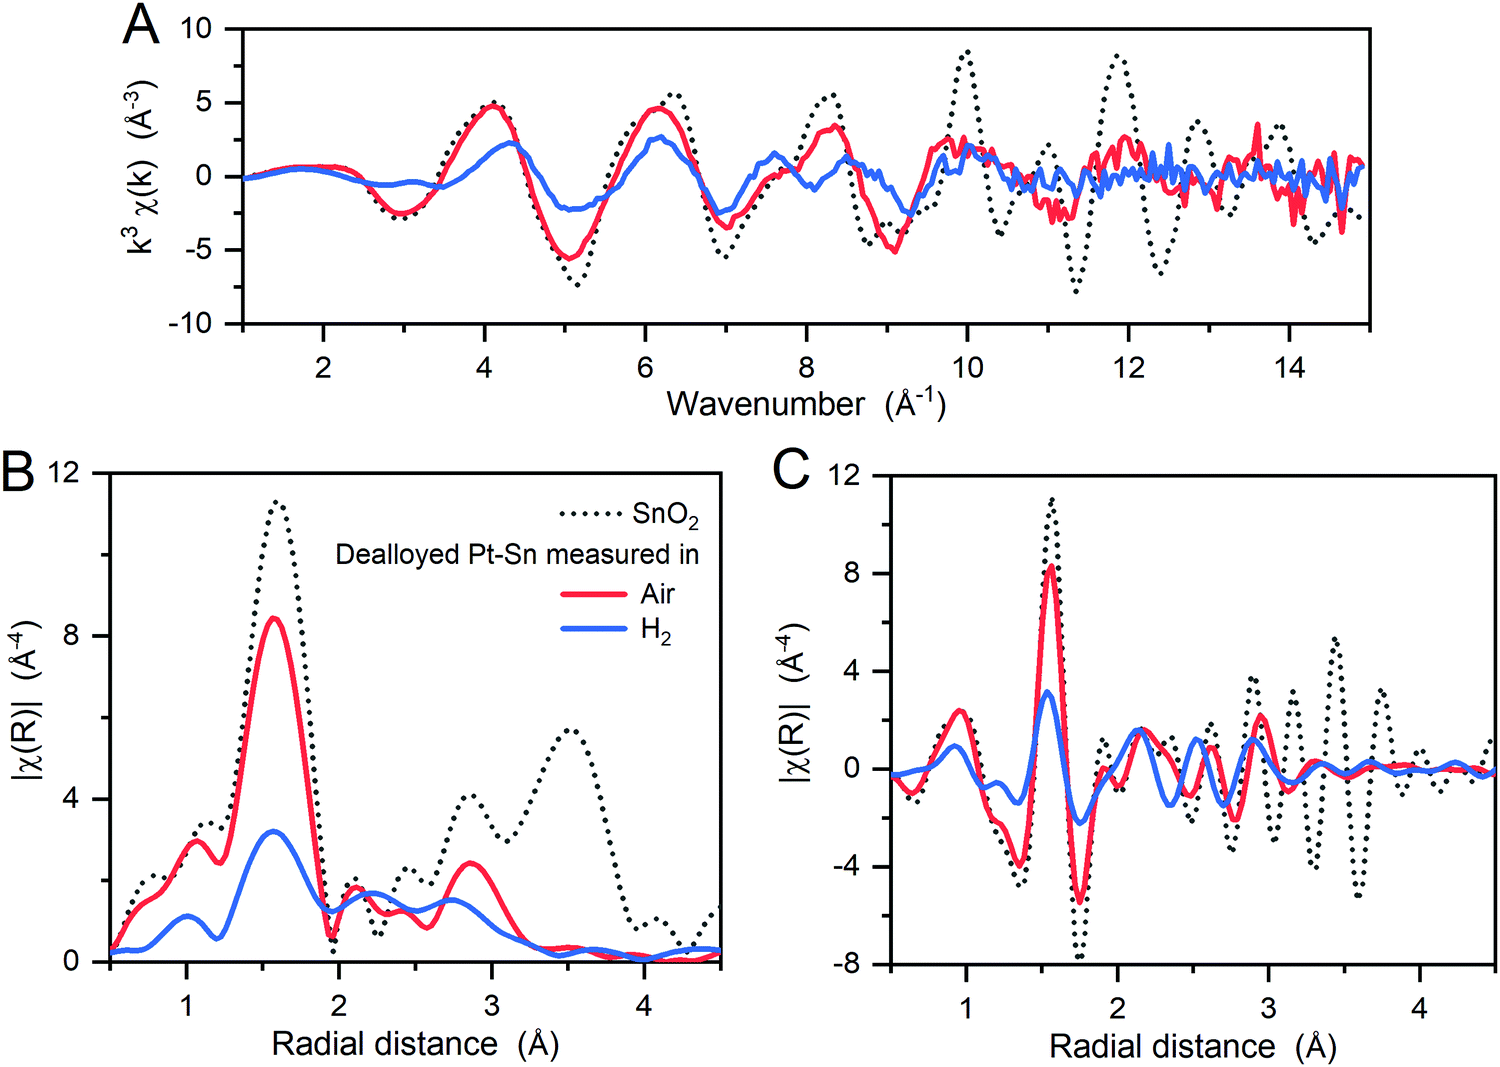 | ||
| Fig. 2 (A) k3-weighted EXAFS spectra of the dealloyed Pt–Sn samples at Sn K-edge, along with a SnO2 reference sample, and (B) the amplitude and (C) the real part of the corresponding Fourier transforms. The Fourier transformation was carried out in a k-range of 3.6–12.4 Å−1. This figure shows the effects of the atmosphere (in which the XAS measurement was conducted) on the coordination of Sn, with a decrease intensity in an R-range of 1–2 Å and a shift in an R-range of 2–3 Å towards shorter radial distance when the samples are measured in H2. | ||
To further identify the coordination environment of the Sn atoms in the dealloyed Pt–Sn sample, a double-dataset EXAFS fit was carried out; combining the data of the Sn K-edge and the Pt L3-edge by setting the R and σ2 of interatomic scattering paths as equal, that is, R(Sn–Pt) = R(Pt–Sn) and σ2(Sn–Pt) = σ2(Pt–Sn). The fitting results are shown in Fig. S7 and S8 (ESI†) and the obtained structural parameters listed in Table 1. At both edges, oxygen neighbours are found in the first shell, consistent with the oxidized surface of the dealloyed Pt–Sn. At the Sn edge, 5.0 ± 0.7 oxygen neighbours are found with R = 2.04 ± 0.01 Å, and 2 ± 1 Pt neighbours are with R = 2.82 ± 0.02 Å, which are similar to that of the SnO2 reference(2.056 ± 0.004 Å, Table 1) and that of the bulk Pt3Sn (2.829 Å, ICSD 105796), respectively. Given the similarity with the corresponding standards and because intermediate Sn species coordinating with both Pt and O are unlikely to exist on Pt–Sn samples annealed in air, it is suggested that the Sn species are a mixture of alloyed Sn0 inside Pt lattice and fully oxidized Sn (denoted as [SnIVO6] due to lack of long-range order), which also reconciles the decreased whiteline intensity and the unsaturated oxygen shell of Sn (6 oxygen neighbours for SnIV in SnO2). The phase segregation of the Sn species is attributed to the dealloying process of heat treatment, in which most of the oxophilic Sn atoms migrate to the surface of Pt–Sn nanoparticles and get oxidized by O2, forming [SnIVO6] species. The similar model for phase segregation and Sn oxidation of supported Pt3Sn nanoparticles was also suggested by in situ time-resolved XAFS.32,36 The presence of alloyed Sn in the current study is probably due to the relatively low temperature (250 °C) used in heat treatment, which limits the extent of phase segregation. Therefore, the Sn species of the dealloyed Pt–Sn can be considered as spatially separated, with [SnIVO6] on the surface layer (with Pt oxide) and a small amount of alloyed Sn in the metallic Pt core (Fig. 3).
| Samples | Scattering path | N | R (Å)b | σ 2 (×103 Å2) | ΔE0d (eV) | R -Factor (%) |
|---|---|---|---|---|---|---|
| a N, the degeneracy of the absorber – backscatterer scattering pair. b R, the average distance of the pair. c σ 2 , the mean square relative replacement of the R. d ΔE0, the difference with the assigned E0. e R factor, a measure of the goodness of fit. f Pt–Sn and Sn–Pt scattering paths are set to have the same value in R and σ2. g N(Sn–Pt) was fit as 12 × [1 − N(Sn–O)/6], assuming the CN of Sn–O is 6, and the CN of Sn–Pt is 12. The fit without such a constraint is plotted in Fig. S8 listed in Table S2 (ESI), producing approximate structural values but with large uncertainty in the N(Sn–Pt) value, 4(5). h not allowed to vary. i Obtained from Feff calculation of the crystal structure of Pt3Sn (ICSD 105796). | ||||||
| Dealloyed Pt–Sn (air) | Pt–O | 0.8(1) | 1.997(6) | 5(1) | 7.3(4) | 0.27 |
| Pt–Pt | 7.5(2) | 2.757(2) | 7.6(2) | |||
| Pt–Sn | 0.6(3) | 2.82(2)f | 14(6)f | |||
| Sn–O | 5.0(6)g | 2.04(1) | 5(1) | 3(2) | ||
| Sn–Pt | 2(1)g | 2.82(2)f | 14(6)f | |||
| Sn–Sn | 2(2) | 3.25(3) | 8(6) | |||
| Dealloyed Pt–Sn (H2) | Pt–Pt | 8.2(2) | 2.760(1) | 6.0(1) | 5.2(3) | 0.22 |
| Pt–Sn | 0.9(2) | 2.743(8)f | 13(2)f | |||
| Sn–O | 1.8(2) | 2.035(8) | 5(1) | 4(1) | ||
| Sn–Pt | 5(1) | 2.743(8)f | 13(2)f | |||
| Sn–Sn | 0.6(5) | 3.27(3) | 10(6) | |||
| SnO2 | Sn–O | 6h | 2.056(4) | 3.9(5) | 4.7(7) | 0.39 |
| Pt3Sni | Sn–Pt | 12 | 2.829 | N.A. | N.A. | N.A. |
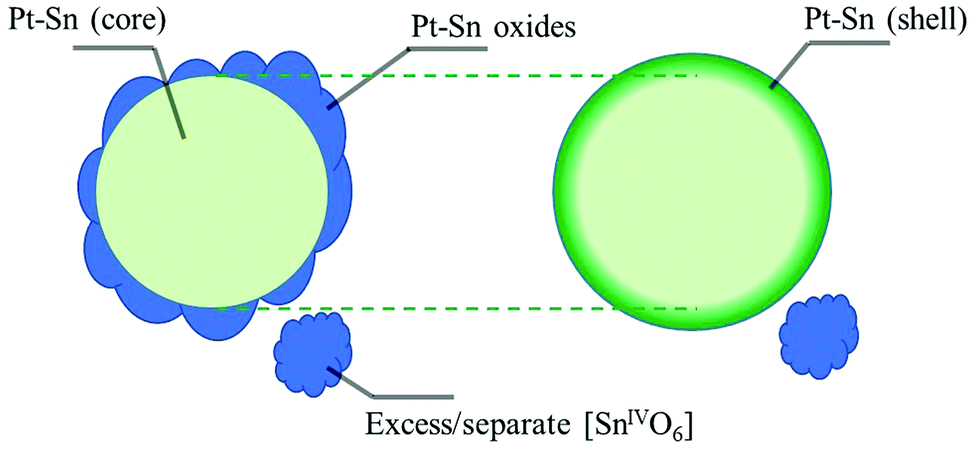 | ||
| Fig. 3 Schematic illustration of the structural model of the dealloyed Pt–Sn in air (left) and under H2 (right). In air the dealloyed Pt–Sn nanoparticles have an amorphous mixed oxide layer on the surface, and a metallic Pt core with small amount of alloyed Sn. When in H2 the surface oxide layer is reduced into a metallic Pt–Sn shell, and the reduction is assumed to have no effect on the metallic core and excess or separate [SnIVO6] species. | ||
The surface [SnIVO6] species are reduced when being measured in H2. The XANES spectrum at the Sn K-edge shows a sharp decrease of whiteline intensity from ∼1.46 to ∼1.22 and a negative shift of the edge position (defined as the first maxim of the derivative around the rising edge) by ∼3 eV (Fig. 1), indicating that the oxidation state of the Sn decreased significantly in H2. The reduction of the Sn is also supported by the decreased amplitude of the Sn–O component in EXAFS spectra (Fig. 2). For the Pt edge data measured in H2, the whiteline intensity decreases and becomes less than that of Pt foil (Fig. S9, ESI†), suggesting the complete reduction of the Pt surface oxide and the alloying with Sn, which results in a downshift of the d-band center of Pt.37,38
The reduction product was further studied by EXAFS fitting using the same model as that used for the data acquired under air. The fitting results are shown in Fig. S9 (ESI†), with the obtained structural parameters listed in Table 1. The CN of Sn–O decreases to 1.8 ± 0.2 and that of Sn–Pt increases to 5 ± 1, with no Sn neighbours found in the first shell of Sn, suggesting that the reduction of [SnIVO6] coincides with the formation of Sn–Pt bonds. Since the common oxidation states of Sn are 0, +2 and +4, the Sn–Pt bonds may come from alloyed Sn (Sn0–Pt), intermediate Sn (Pt–SnII–Ox), or both. The presence of the intermediate Sn is negligible, as no significant change in the Sn–O distance was observed (Table 1 and Fig. S10, ESI†), which should be seen if Pt–SnII–Ox or SnIIO is present. Thus, the formation of Sn–Pt bonds is attributed to Sn0 alloyed with Pt, which is the reduction product of [SnIVO6] in H2.
From the proposed structural model of dealloyed Pt–Sn nanoparticles (Fig. 3), the selective conversion of [SnIVO6] to Sn0 alloyed with Pt suggests that the reduction of [SnIVO6] is facilitated by the Pt surface, which was also found previously for organotin(IV)33,39,40 and SnO2 at higher temperature.32,41 The promotional role of Pt is ascertained by temperature-programmed reduction using diluted H2 (Fig. S11, ESI†), showing that the dealloyed Pt–Sn sample requires <60 °C to trigger reduction whilst SnO2/C needs 125 °C. The promoted [SnIVO6] reduction by Pt can be attributed to the highly negative formation enthalpy of Pt–Sn intermetallic compounds, −55.3 kJ mol−1 for Pt3Sn.42 Note that the reduction of [SnIVO6] is not complete in the room temperature experiments reported herein. The residual contribution of Sn–O may be due to excess clusters of [SnIVO6] on Pt particles, where the Sn:Pt ratio exceeds capacity of the topmost layer to reduce all the Sn atoms (see below), and/or to [SnIVO6] species located on the carbon support.
The Sn0 atoms resulting from the [SnIVO6] reduction facilitated by Pt probably stay on the nanoparticle surface rather than migrating into the Pt lattice at room temperature. Sn0 diffusion into bulk Pt crystal was found to be unfavourable and limited to the topmost layers43, presumably due to the significant lattice expansion accompanying the transition from Pt (3.92 Å, ffc) to Pt3Sn (4.00 Å, ffc). The preparation of Pt–Sn surface alloys (multiple layers) generally requires heat treatments to incorporate deposited excessive Sn layers into Pt crystals (>400 K under vacuum).43–45 The preferential location of Sn on Pt surface is also supported by the configuration of Sn ad-atoms on Pt (crystals and nanoparticles) prepared under electrochemical controls46,47 and other mild conditions.33,39,48
The Sn species of the dealloyed Pt–Sn in H2 at room temperature can therefore be considered as a mixture of Sn inside the Pt lattice (bulk alloyed) and Sn coordinated to Pt at the surface of the particles, forming a Pt-rich core/Sn-rich shell structure, with some residual [SnIVO6] (Fig. 3). From EXAFS fitting the structural parameters of Sn–Pt arising from these two Sn alloy environments yield an averaged bond length, R = 2.743 ± 0.008 Å (Table 1), which is significantly shorter than that measured in air (2.82 ± 0.02 Å) and that of bulk Pt3Sn (∼2.829 Å). Such a decrease has previously been found in an Al2O3-supported Pt–Sn nanoparticle catalyst,28 the R(Pt–Sn) of which decreased from ∼2.82 Å to 2.73∼2.74 Å after cycles of propane dehydrogenation, regeneration (in O2) and re-activation (in H2), where the regeneration step is analogous to the dealloying process carried out on the dealloyed Pt–Sn sample in the study reported herein.
The same XAS analysis for data measured in air and in H2 was conducted for the alloyed Pt–Sn and partly alloyed Pt–Sn, with the expectation that the effects of the mild H2 reduction would decrease with the increased extent of alloying owing to the lower fraction of Sn atoms at or near the surface of the particles. The XANES data are shown in Fig. S12 (ESI†) and EXAFS and the fitting results in Fig. S13–S16 and Table S3 (ESI†). Comparison of the XANES in air and in H2 shows that the [SnIVO6] species of both samples were reduced by H2, but the extent of reduction, as assessed by the decrease in the Sn K-edge whiteline and CN(Sn–O) (Fig. 4A), shows the opposite trend of the extent of alloying, as expected. Thus, the extent of alloying (or the fraction of surface [SnIVO6]) has a direct effect on the R(Pt–Sn), with the dealloyed catalysts showing the shortest R(Pt–Sn) in H2 and the largest decrease of R(Pt–Sn) in H2 with respect to that in air (Fig. 4B), which further suggests that the contraction of the Sn–Pt bonds results from freshly reduced Sn atoms located at the surface of the particles.
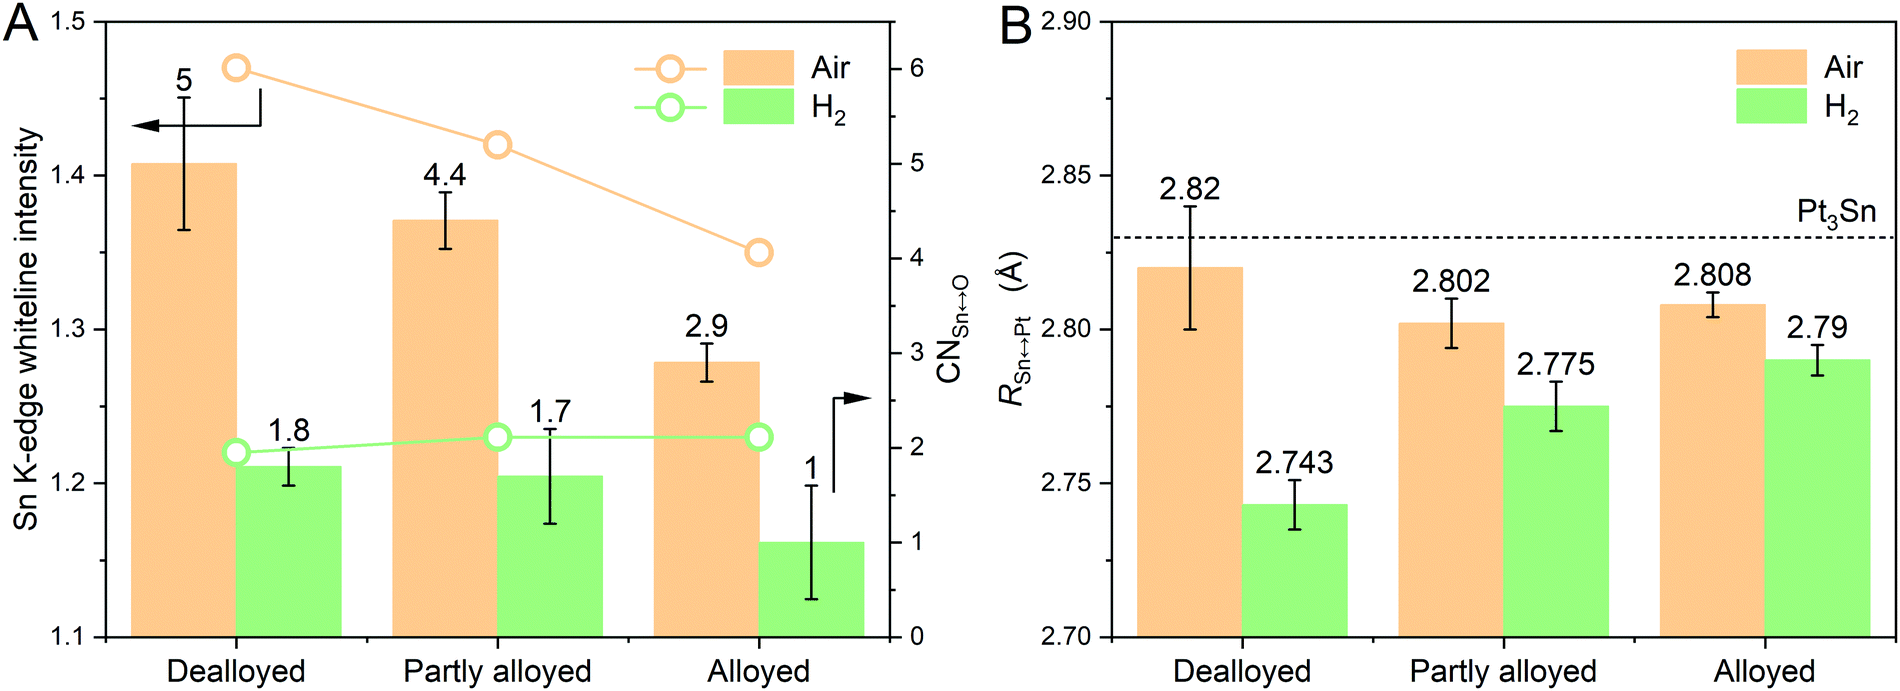 | ||
| Fig. 4 Comparison of the dealloyed Pt–Sn, the partly alloyed Pt–Sn and the alloyed Pt–Sn in terms of the decrease of (A) Sn K-edge whiteline intensity, CN(Sn–O) and (B) R(Sn–Pt) when being exposed to H2. The average CN(Sn–O) and R(Sn–Pt) values are labelled on the top of columns, along with that calculated from Pt3Sn crystal (ICSD 105796) using Feff6. | ||
The above analysis suggests that R(Sn–Pt) is related to the fraction of Sn–Pt contribution at the surface (shell) of the Pt–Sn particles. The CN of Sn–Pt is also a measure of this fraction, as only Sn atoms located in the core have a full Pt coordination shell corresponding to the Pt3Sn structure. The relationship between these two measures was further explored by the use of an improved fitting model (Table S4, ESI†). In this model, the added surface metal atoms and any structural changes due to the reduction of the [SnIVO6] shell are assumed to be independent from the metallic core (mainly Pt with alloyed Sn). Thus, parameters obtained from the metallic core of the data obtained in air can be transferred to the data in H2 as an unaffected ‘core’, and the contribution of the reduced Pt and Sn atoms to the structural parameters are described as the ‘shell’ (Fig. 3). The R and σ2 values of Sn–O and Sn–Sn are also assumed to be transferrable between data measured in the two atmospheres. As the fitting result shown in Fig. S17 (ESI†) and the obtained structural parameters listed in Table 2, the improved fitting model yields a good fit that produces an R-factor of 0.38% and improved accuracy in the obtained structural parameters and only uses 28 variables out of ∼54 independent points.
| Data set | Scattering path | N | R (Å) | σ 2 (×103 Å2) | ΔE0 (eV) | R-Factor (%) |
|---|---|---|---|---|---|---|
| *Pt–Pt (core), Pt–Sn (core) and Sn–Pt (core) of the H2 data and the corresponding ones of the air data are set to be equal in values of N, ΔR and σ2. **Sn–O and Sn–Sn (2nd shell) are set to be equal in values of R and σ2. ***For data measured in the same atmosphere and probing the core or the shell, Pt–Sn and Sn–Pt are set to be equal in values of R and σ2. | ||||||
| Pt L3 (air) | Pt–O | 0.84(8) | 1.998(4) | 5(1) | 7.3(2) | 0.38 |
| Pt–Pt | 7.4(2)* | 2.757(1)* | 7.5(1)* | |||
| Pt–Sn | 0.6(2)* | 2.82(1)*,*** | 14(4)*,*** | |||
| Sn K (air) | Sn–O | 5.0(4) | 2.043(7)** | 4.6(9)** | 5(2) | |
| Sn–Pt | 2.1(8)* | 2.82(1)*,*** | 14(4)*,*** | |||
| Sn–Sn (2nd shell) | 1.9 ± 1.1 | 3.25(2)** | 9(4)** | |||
| Pt L3 (H2) | Pt–Pt (core) | 7.4(2)* | 2.757(1)* | 7.5(1)* | 4.9(4) | |
| Pt–Sn (core) | 0.6(2)* | 2.82(1)* | 14(4)* | |||
| Pt–Pt (shell) | 1.5(3) | 2.761(5) | 3.5(6) | |||
| Pt–Sn (shell) | 0.39 ± 0.28 | 2.72(2)*** | 11(4)*** | |||
| Sn K (H2) | Sn–O | 1.7(2) | 2.043(7)** | 4.6(9)** | 3(1) | |
| Sn–Pt (core) | 2.1(8)* | 2.82(1)* | 14(4)* | |||
| Sn–Pt (shell) | 3.0 ± 1.8 | 2.72(2)*** | 11(4)*** | |||
| Sn–Sn (2nd shell) | 0.5 ± 0.6 | 3.25(2)** | 9(4)** | |||
Using the improved fitting model, structural parameters specifically of the surface Sn atoms were obtained. Compared with the conventional fitting model above, an even shorter bond length for the “shell” Sn–Pt was found, 2.72 ± 0.02 Å, which is expected because a small amount of Sn–Pt from the core (with longer R) was separated in the fitting model. Assuming the Sn atoms of tin oxide species are saturated with 6 oxygen atoms (unreduced SnO2) in both atmospheres, the amount of the freshly formed surface Sn atoms (Sn0surface%) is equal to [N(Sn–O)air – N(Sn–O)H2]/6, and the CN of the shell Sn–Pt is then equal to N(Sn–Pt)shell/Sn0surface%, 5.4 ± 3.3.
To further explore the relationship between the CN and R for the surface Sn atoms, two control samples were prepared, in which the tin oxide phases were deposited on to a commercial Pt/C rather than mixing Pt and Sn precursors at the beginning of the synthesis; (i) SnO2–Pt/C, in which disordered [SnIVO6] was deposited on a commercial Pt/C catalyst (with naturally formed surface oxide layers) by hydrolysis of SnO32−, and (ii) Snad-Pt/C, in which Sn ad-atoms were deposited on the same Pt/C catalyst using a surface organometallic chemistry (SOMC) method where the Sn atoms are selectively deposited on freshly reduced Pt surface.31 XAS analysis in air and in H2 was conducted on SnO2–Pt/C as for the dealloyed Pt–Sn sample (Supplementary note 1, ESI†), and the Snad–Pt/C data can be found in Fig. S18–S20 and Table S5 (ESI†). Only Sn K edge data were collected for these two samples, because the Pt–Sn signal from the Pt edge data would be diluted by the dominant Pt atoms in the interior.
Shortened R(Sn–Pt) values were found for both control samples; 2.768 ± 0.007 Å for SnO2–Pt./C and 2.690 ± 0.007 Å for Snad–Pt/C, and the corresponding CN values are 8.8 ± 1.7 and 4.5 ± 0.4, respectively. Such a shortened Sn–Pt bond distance can also be found on Sn/Pt(111)49,50 and Sn/Pt(100)51 surface alloys, where the CN(Sn–Pt) is 9 and 8, respectively. On these two surface alloys the surface Sn atoms were found to protrude ∼0.2 Å above the surface using scattering techniques, corresponding to a R(Sn–Pt) of ∼2.78 Å.52,53 Comparison of these two surface alloys with SnO2–Pt/C reveals that they have similar R and CN values, in agreement with the results presented here obtained by EXAFS fitting and suggesting that the R(Sn–Pt) has a similar coordination-dependence for both single crystals and nanoparticles.
To summarise, the R(Sn–Pt) values of the surface Sn are plotted as a function of CN(Sn–Pt) in Fig. 5, which includes the dealloyed Pt–Sn, Snad–Pt/C and SnO2–Pt/C, Sn/Pt(111)52,53 and Sn/Pt(100),52 and a reference Pt3Sn crystal (CN = 12, R = 2.829 Å). The correlation is almost linear. For monometallic metals, the Goldschmidt correction was used to convert atomic radii of the metals to the value that they would have with 12-fold coordination, and as per the correction, atomic radii contract by 3%, 4% and 12% if the CN is reduced from 12 to 8, 6 and 4, respectively.54 Sun55,56 formulates the correction into a CN-dependent bond-contraction coefficient (eqn (1)),
| C(z) = R(z)/R(12) = 2/{1 + exp[(12 − z)/(8z)]} | (1) |
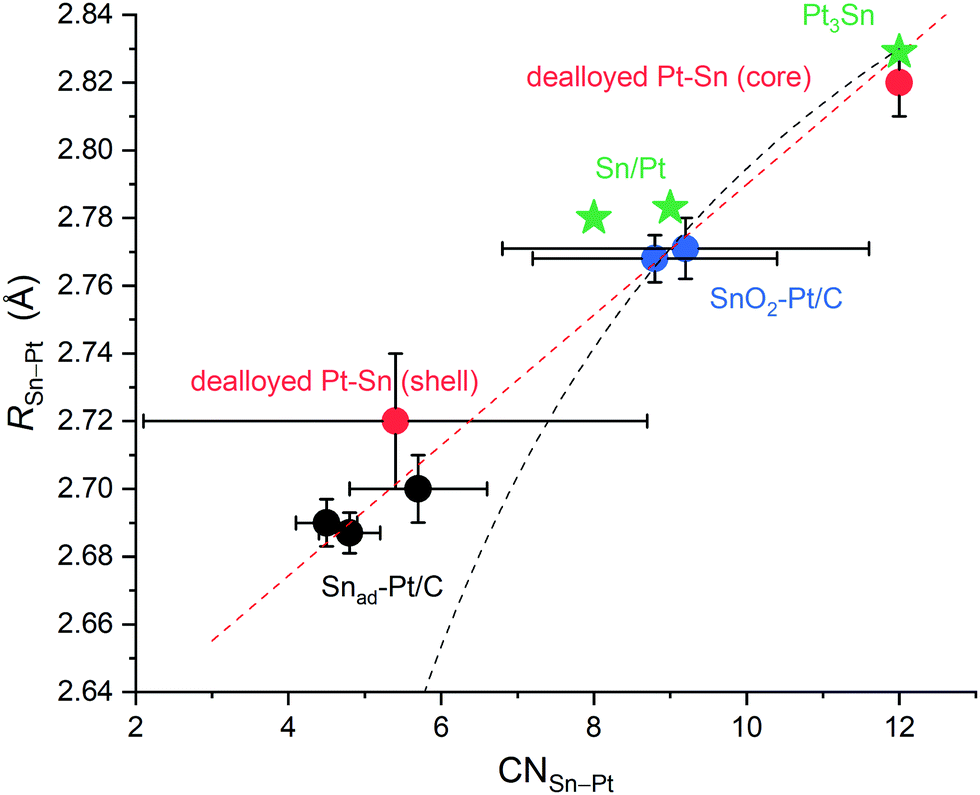 | ||
| Fig. 5 R(Sn–Pt) from different Pt–Sn systems plotted as a function of CN(Sn–Pt), showing a linear relationship (red dash line) and the deviation from eqn (1) (black dash line) at CN(Sn–Pt) = 4–6. The Pt–Sn systems include the present data in this study, dealloyed Pt–Sn (core and shell), SnO2–Pt/C from two batches and Snad–Pt/C with different Sn coverages, and two reference data, Sn/Pt surface alloys on Pt(100) and on Pt(111)52,53 and Pt3Sn crystal structure (ICSD 105796). | ||
Conclusions
In this work, XAS measurements in H2 at room temperature were carried out to ascertain the bond length contraction on the surface of Pt–Sn bimetallic nanoparticles. Dealloyed Pt–Sn nanoparticles, where most Sn atoms are segregated to the surface, show an average bond length of Sn-Pt ∼0.09 Å shorter than the bulk value. The bond contraction is found to decrease as the surface-to-bulk Sn ratio decreases (or as the extent of alloying increases), supporting the main contribution of surface contraction to the shortened bond length. To extract the structural information specifically of the surface from the average EXAFS results, an improved fitting model combining the data measured in H2 and in air was devised, yielding a good fit with a Sn–Pt bond length on the surface (2.72 ± 0.02 Å) and a corresponding coordination number (5.4 ± 3.3). Two control samples without Sn in the bulk were also studied in the same fashion, and the results support the surface contraction and provide data points for coordination-dependent bond length contraction. Plotting the measured R of Sn-Pt against the corresponding CN values reveals that R is proportional to the CN for the Pt–Sn bimetallic system, which is different from the established theory in monometallic system when the CN is <9. The origin of the mismatch is attributed to the directionality of Sn 5p orbitals, which causes poor overlap with the available orbital on the Pt surface.Conflicts of interest
There are no conflicts to declare.Acknowledgements
The UK Catalysis Hub is kindly thanked for resources and support provided via our membership of the UK Catalysis Hub Consortium and funded by EPSRC (Portfolio Grants EP/K014706/2, EP/K014668/1, EP/K014854/1, EP/K014714/1, and EP/I019693/1). XAS data were collected at Diamond on B18 as part of the UK Catalysis Hub BAG allocation (SP10306 and SP19850-4). HH acknowledges Fellowship support from the China Scholarship Council (201608440295) and the University of Southampton.References
- K. Loza, M. Heggen and M. Epple, Adv. Funct. Mater., 2020, 30, 1909260 CrossRef CAS.
- M. Sankar, N. Dimitratos, P. J. Miedziak, P. P. Wells, C. J. Kiely and G. J. Hutchings, Chem. Soc. Rev., 2012, 41, 8099–8139 RSC.
- W. Yu, M. D. Porosoff and J. G. Chen, Chem. Rev., 2012, 112, 5780–5817 CrossRef CAS PubMed.
- J. H. Kim, S. M. Choi, S. H. Nam, M. H. Seo, S. H. Choi and W. B. Kim, Appl. Catal., B, 2008, 82, 89–102 CrossRef CAS.
- S. I. Choi, S. Xie, M. Shao, N. Lu, S. Guerrero, J. H. Odell, J. Park, J. Wang, M. J. Kim and Y. Xia, ChemSusChem, 2014, 7, 1476–1483 CrossRef CAS PubMed.
- S. Alayoglu, P. Zavalij, B. Eichhorn, Q. Wang, A. I. Frenkel and P. Chupas, ACS Nano, 2009, 3, 3127–3137 CrossRef CAS PubMed.
- R. Ferrando, J. Jellinek and R. L. Johnston, Chem. Rev., 2008, 108, 845–910 CrossRef CAS PubMed.
- L. Calvillo, L. Mendez De Leo, S. J. Thompson, S. W. T. Price, E. J. Calvo and A. E. Russell, J. Electroanal. Chem., 2018, 819, 136–144 CrossRef CAS.
- P. Strasser, S. Koh, T. Anniyev, J. Greeley, K. More, C. Yu, Z. Liu, S. Kaya, D. Nordlund, H. Ogasawara, M. F. Toney and A. Nilsson, Nat. Chem., 2010, 2, 454–460 CrossRef CAS.
- B. T. Sneed, A. P. Young and C. K. Tsung, Nanoscale, 2015, 7, 12248–12265 RSC.
- M. Escudero-Escribano, P. Malacrida, M. H. Hansen, U. G. Vej-Hansen, A. Velazquez-Palenzuela, V. Tripkovic, J. Schiotz, J. Rossmeisl, I. E. Stephens and I. Chorkendorff, Science, 2016, 352, 73–76 CrossRef CAS PubMed.
- K. Oura, V. Lifshits, A. Saranin, A. Zotov and M. Katayama, Surface science: an introduction, Springer Science & Business Media, 2013 Search PubMed.
- G. A. Somorjai and Y. Li, Introduction to surface chemistry and catalysis, John Wiley & Sons, 2010 Search PubMed.
- F. Jona and P. Marcus, The structure of Surfaces II, Springer, 1988, pp. 90–99 Search PubMed.
- J. T. Miller, A. J. Kropf, Y. Zha, J. R. Regalbuto, L. Delannoy, C. Louis, E. Bus and J. A. van Bokhoven, J. Catal., 2006, 240, 222–234 CrossRef CAS.
- G. Apai, J. F. Hamilton, J. Stohr and A. Thompson, Phys. Rev. Lett., 1979, 43, 165–169 CrossRef CAS.
- J. R. Gallagher, T. Li, H. Zhao, J. Liu, Y. Lei, X. Zhang, Y. Ren, J. W. Elam, R. J. Meyer, R. E. Winans and J. T. Miller, Catal. Sci. Technol., 2014, 4, 3053–3063 RSC.
- R. Lamber, S. Wetjen and N. I. Jaeger, Phys. Rev. B: Condens. Matter Mater. Phys., 1995, 51, 10968–10971 CrossRef CAS.
- C. Solliard and M. Flueli, Surf. Sci., 1985, 156, 487–494 CrossRef CAS.
- W. J. Huang, R. Sun, J. Tao, L. D. Menard, R. G. Nuzzo and J. M. Zuo, Nat. Mater., 2008, 7, 308–313 CrossRef CAS PubMed.
- R. Xu, C. C. Chen, L. Wu, M. C. Scott, W. Theis, C. Ophus, M. Bartels, Y. Yang, H. Ramezani-Dakhel, M. R. Sawaya, H. Heinz, L. D. Marks, P. Ercius and J. Miao, Nat. Mater., 2015, 14, 1099–1103 CrossRef CAS PubMed.
- J. Miao, P. Ercius and S. J. Billinge, Science, 2016, 353, aaf2157 CrossRef PubMed.
- L. Deng, Z. Zhou and T. Shishido, Appl. Catal., A, 2020, 606, 117826 CrossRef CAS.
- L. Deng, H. Miura, T. Ohkubo, T. Shishido, Z. Wang, S. Hosokawa, K. Teramura and T. Tanaka, Catal. Sci. Technol., 2019, 9, 947–956 RSC.
- L. Deng, T. Shishido, K. Teramura and T. Tanaka, Catal. Today, 2014, 232, 33–39 CrossRef CAS.
- L. Deng, H. Miura, T. Shishido, S. Hosokawa, K. Teramura and T. Tanaka, ChemCatChem, 2014, 6, 2680–2691 CrossRef CAS.
- L. Deng, T. Arakawa, T. Ohkubo, H. Miura, T. Shishido, S. Hosokawa, K. Teramura and T. Tanaka, Ind. Eng. Chem. Res., 2017, 56, 7160–7172 CrossRef CAS.
- A. Iglesias-Juez, A. M. Beale, K. Maaijen, T. C. Weng, P. Glatzel and B. M. Weckhuysen, J. Catal., 2010, 276, 268–279 CrossRef CAS.
- H. Huang, A. Nassr, V. Celorrio, S. F. R. Taylor, V. K. Puthiyapura, C. Hardacre, D. J. L. Brett and A. E. Russell, Faraday Discuss., 2018, 208, 555–573 RSC.
- W. Du, G. Yang, E. Wong, N. A. Deskins, A. I. Frenkel, D. Su and X. Teng, J. Am. Chem. Soc., 2014, 136, 10862–10865 CrossRef CAS PubMed.
- E. M. Crabb, R. Marshall and D. Thompsett, J. Electrochem. Soc., 2000, 147, 4440–4447 CrossRef CAS.
- Y. Uemura, Y. Inada, K. K. Bando, T. Sasaki, N. Kamiuchi, K. Eguchi, A. Yagishita, M. Nomura, M. Tada and Y. Iwasawa, J. Phys. Chem. C, 2011, 115, 5823–5833 CrossRef CAS.
- F. Humblot, F. Lepeltier, J. P. Candy, J. Corker, O. Clause, F. Bayard and J. M. Basset, J. Am. Chem. Soc., 1998, 120, 137–146 CrossRef CAS.
- J. M. Ramallo-López, G. F. Santori, L. Giovanetti, M. L. Casella, O. A. Ferretti and F. G. Requejo, J. Phys. Chem. B, 2003, 107, 11441–11451 CrossRef.
- B. Ravel and M. Newville, J. Synchrotron Radiat., 2005, 12, 537–541 CrossRef CAS PubMed.
- Y. Uemura, Y. Inada, K. K. Bando, T. Sasaki, N. Kamiuchi, K. Eguchi, A. Yagishita, M. Nomura, M. Tada and Y. Iwasawa, Phys. Chem. Chem. Phys., 2011, 13, 15833–15844 RSC.
- M.-L. Yang, Y.-A. Zhu, X.-G. Zhou, Z.-J. Sui and D. Chen, ACS Catal., 2012, 2, 1247–1258 CrossRef CAS.
- Š. Pick, Surf. Sci., 1999, 436, 220–226 CrossRef.
- K. Pelzer, J.-P. Candy, G. Godard and J.-M. Basset, Nanoparticles and Catalysis, 2007, pp. 553–620 DOI:10.1002/9783527621323.ch18.
- J. M. Basset, A. Baudouin, F. Bayard, J. P. Candy, C. Copéret, A. De Mallmann, G. Godard, E. Kuntz, F. Lefebvre and C. Lucas, Modern Surface Organometallic Chemistry, Wiley Online Library, 2009, pp. 23–73 Search PubMed.
- M. Chen, Y. Han, T. W. Goh, R. Sun, R. V. Maligal-Ganesh, Y. Pei, C. K. Tsung, J. W. Evans and W. Huang, Nanoscale, 2019, 11, 5336–5345 RSC.
- P. Anres, M. Gaune-Escard, J. P. Bros and E. Hayer, J. Alloys Compd., 1998, 280, 158–167 CrossRef CAS.
- M. Galeotti, A. Atrei, U. Bardi, G. Rovida and M. Torrini, Surf. Sci., 1994, 313, 349–354 CrossRef CAS.
- B. E. Hayden, M. E. Rendall and O. South, J. Am. Chem. Soc., 2003, 125, 7738–7742 CrossRef CAS PubMed.
- S. Speller and U. Bardi, in The Chemical Physics of Solid Surfaces, ed. D. P. Woodruff, Elsevier, 2002, vol. 10, pp. 184–224 Search PubMed.
- S. Tillmann, G. Samjeské, K. A. Friedrich and H. Baltruschat, Electrochim. Acta, 2003, 49, 73–83 CrossRef CAS.
- H. Massong, S. Tillmann, T. Langkau, E. A. Abd El Meguid and H. Baltruschat, Electrochim. Acta, 1998, 44, 1379–1388 CrossRef CAS.
- G. Stalnionis, L. Tamašauskaitė-Tamašiūnaitė, V. Pautienienė, A. Sudavičius and Z. Jusys, J. Solid State Electrochem., 2004, 8, 892–899 CrossRef CAS.
- M. Nakamura, R. Imai, N. Otsuka, N. Hoshi and O. Sakata, J. Phys. Chem. C, 2013, 117, 18139–18143 CrossRef CAS.
- S. H. Overbury, D. R. Mullins, M. T. Paffett and B. E. Koel, Surf. Sci., 1991, 254, 45–57 CrossRef CAS.
- Y. Li and B. E. Koel, Surf. Sci., 1995, 330, 193–206 CrossRef CAS.
- D. P. Woodruff and J. Robinson, Appl. Surf. Sci., 2003, 219, 1–10 CrossRef CAS.
- S. H. Overbury and Y. Ku, Phys. Rev. B: Condens. Matter Mater. Phys., 1992, 46, 7868–7872 CrossRef CAS PubMed.
- M. Weller, T. Overton, J. Rourke and F. Armstrong, Inorganic Chemistry, OUP, Oxford, 2014 Search PubMed.
- C. Sun, Nano Mater. Sci., 2019, 2, 333–345 CrossRef.
- C. Q. Sun, Relaxation of the chemical bond, 2014.
- W. Qi, B. Huang and M. Wang, J. Comput. Theor. Nanosci., 2009, 6, 635–639 CrossRef CAS.
- H. L. Skriver, Phys. Rev. B: Solid State, 1976, 14, 5187–5197 CrossRef CAS.
- I. Pašti and S. Mentus, Mater. Chem. Phys., 2009, 116, 94–101 CrossRef.
- A. Kokalj and M. Causà, J. Phys.: Condens. Matter, 1999, 11, 7463–7480 CrossRef CAS.
- C. Elsasser, N. Takeuchi, K. M. Ho, C. T. Chan, P. Braun and M. Fahnle, J. Phys.: Condens. Matter, 1990, 2, 4371–4394 CrossRef CAS.
Footnote |
| † Electronic supplementary information (ESI) available. See DOI: 10.1039/d1cp00979f |
| This journal is © the Owner Societies 2021 |