 Open Access Article
Creative Commons Attribution 3.0 Unported Licence
Electronic structure of n-cycloparaphenylenes directly observed by photoemission spectroscopy†
Kaname
Kanai
 *a,
Takuya
Inoue
a,
Takaya
Furuichi
a,
Kaito
Shinoda
a,
Takashi
Iwahashi
 b and
Yukio
Ouchi
 b
b
aDepartment of Physics, Faculty of Science and Technology, Tokyo University of Science, 2641 Yamazaki, Noda, Chiba 278-8510, Japan. E-mail: kaname@rs.tus.ac.jp
bDepartment of Materials Science and Engineering, Tokyo Institute of Technology, 2-12-1 Ookayama, Meguro-ku, Tokyo 152-8550, Japan
First published on 30th March 2021
Abstract
A series of n-cycloparaphenylenes ([n]CPP, n = 8, 9, and 12) were studied by ultraviolet photoemission, inverse photoemission, ultraviolet-visible absorption, and X-ray photoemission spectroscopy to detect their unique electronic structures. [n]CPP has a cyclic structure in which both ends of n-poly(p-phenylene)s (nP) are connected. The molecular size dependence of the HOMO–LUMO gap of [n]CPP was investigated by direct observation and was found to increase as the molecular size increased. This trend is opposite to that of typical π-conjugated systems. Highly strained molecular structures, especially of small [n]CPPs, significantly impact their electronic structure. Insights into the electronic structure of [n]CPP obtained here will aid the design of electronic functionality of non-planar π-conjugation systems.
1. Introduction
To date, countless π-conjugated molecules have been used for various electronic applications such as in optoelectronic devices, light-harvesting devices, sensors and so on. Most π-conjugated molecules are planar, with little diversity in molecular backbones. This limits new molecular designs and highlights the need for exploring the possibility of controlling the properties of molecules with non-planar backbones.1,2n-Cycloparaphenylenes ([n]CPP), first synthesized in 2008,1 are polycyclic aromatic hydrocarbons (Fig. 1(a)) and are currently synthesized using innovative strategies.3–6 [n]CPPs have a cyclic structure consisting of n benzene rings linked in a circular alignment at their para-positions. [n]CPPs are potential building blocks of carbon nanotubes (CNTs) by acting as seeds for the size-selective growth of CNTs.7–9 A variety of synthetic approaches allow precise tuning of the properties of [n]CPPs.10–14 Many chemists have explored the possibility of adding practical functions to [n]CPPs by taking advantage of their unique chemical and electronic structures. For example, the cavity in [n]CPPs could make it a good host molecule, and the interesting properties arising from host–guest interactions between [n]CPPs and guest molecules are being actively explored.15,16 The cavity in [n]CPPs allows encapsulation of other molecules such as fullerenes in a “peapod” manner.17–19 [n]CPPs have also attracted much interest recently as new material for application to photochemical and electronic devices20–24 based on, for example, their unique optical properties.11,25 The photoluminescence emission maximum wavelength of a series of [n]CPP molecules gradually decreases as n increases. This size-dependent light emission is consistent with the molecular size dependence of Eg, which is the size of the energy gap between the highest occupied molecular orbital (HOMO) and the lowest unoccupied molecular orbital (LUMO) of [n]CPPs and has been investigated theoretically.25,26 [n]CPPs are attractive for use in organic electronics by virtue of the high controllability of Eg by controlling molecular size, and the theoretical prediction of high hole mobility in solid state [n]CPPs.27 The electronic structure of [n]CPPs is thus of interest for both basic and applied research.A series of [n]CPP molecules is also fascinating for basic research in physical chemistry, providing an excellent opportunity to study how the electronic structure of a π-conjugation system is modified by introducing strong strain into the molecular structure. The correlation between molecular and electronic structure is a subject of great interest for physical and synthetic chemists. The distortion of each phenylene unit markedly influences the electronic structure, resulting in reactivities unique from planar π-conjugated molecules. The effect of this distortion on the physical and chemical properties of the molecule can be understood from the electronic structure. The cyclic structures of [n]CPPs give them electronic structures that notably differ from that of most π-conjugated molecules. For instance, Eg of [n]CPP increases as n, the number of linked phenylene units, increases.25,26 Calculations within the framework of density functional theory (DFT) show that Eg of [n]CPP dramatically increases as n increases for n less than ∼15, then approaches that of poly(p-phenylene)s.
This Eg dependence on n is completely opposite to the case of poly(p-phenylene) (nP), which comprises n phenylene units linearly linked at the para positions (Fig. 1(b)). [n]CPP has a structure in which both ends of nP are linked together to form a macrocycle. The HOMO–LUMO gap of typical π-conjugation systems such as nP, polyacenes, and most conductive polymers narrows with increasing n because the π-conjugation length is enlarged. Molecular orbital (MO) calculations indicate that Eg of [n]CPP is smaller than that of nP for the same number of phenylene units,27 owing in part to destabilization of the π-electron system because the benzenoid forms are highly strained, especially in small [n]CPPs (e.g., n less than ∼10).
In this paper, we report the direct observation of the electronic structure of [n]CPP using ultraviolet photoemission (UPS), inverse photoemission (IPES), ultraviolet-visible absorption (UV-vis), and X-ray photoemission spectroscopy (XPS). DFT theoretical calculations were also performed to both support the interpretation of the experimental results and help understand the electronic structure of [n]CPP. The combined results of UPS, IPES, UV-vis, and XPS confirmed the theoretically predicted correlation between the molecular size of [n]CPP and its electronic structure.
2. Methods
Samples of [n]CPP were purchased from Tokyo Chemical Industry Co. Ltd and used without further purification. Substrates were prepared by vacuum deposition of Au on ultrasonically cleaned Si(100) wafers. The specimens were obtained by vacuum deposition of [n]CPP onto the substrate. The thickness of the [n]CPP thin film was monitored using a quartz microbalance.UPS measurements were performed under ultra-high vacuum with a base pressure below 5 × 10⁻⁸ Pa using an electron analyzer (SES200, Scienta) and a helium discharge lamp. The He Iα resonance line (hν = 21.22 eV) was used as an excitation source to acquire the UPS spectra. IPES spectra were recorded in situ on the same specimens as the UPS measurements using a commercial apparatus (PSP Vacuum Technology). A band-pass-type photon detector for photons of hν = 9.3 eV consisted of a channeltron coated with NaCl and placed behind a SrF2 window. Fermi level EF energy was determined from the Fermi edge of the Au substrate.
UV-vis experiments were performed using a UV spectrometer (UV-1800, Shimadzu).
XPS measurements were performed using an electron analyzer (ESCA, Omicron). The Al Kα line (hν = 1486.6 eV) was used as an excitation source to acquire the XPS spectra.
MO calculations for the isolated molecules based on DFT were performed using Gaussian 09 with B3LYP parameters and the 6-31G(d) basis set. Simulated spectra were obtained by broadening the calculated MOs with the Voigt function to reproduce the observed spectra.
3. Results and discussion
3.1. Direct observation of the electronic structure of [n]CPPs
Fig. 2 shows the UPS spectra of 6P and [8]CPP films with thickness d = 10 nm, together with the simulated UPS spectra based on the MO calculations. The data for 6P were taken from the literature.28 The bottom axis represents the binding energy with respect to EF. UPS allows direct probing of the occupied electronic structures of materials. The simulated spectra, which are individually shifted to reproduce the observed spectra, explain well the observed spectra for both 6P and [8]CPP. Ordinarily, the results for 8P should be compared with those for [8]CPP, which has the same number of phenylene units. However, the spectra for 8P have not been published. It is nonetheless instructive to compare the results for 6P instead of those for 8P with those of [8]CPP because the electronic structure around the HOMO–LUMO gap of 6P is similar to that of 8P, except for Eg, as predicted in the MO calculation (see Fig. S1 in the ESI†). The calculated HOMO and LUMO energies of [n]CPPs and nPs (n = 6, 8, 9, and 12) are summarized in Table 1.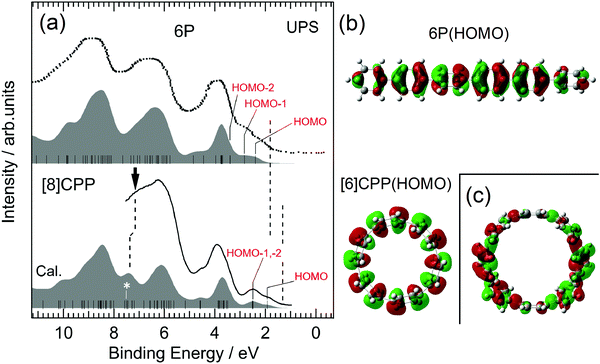 | ||
| Fig. 2 (a) UPS spectra of 6P and [8]CPP. The bottom axis represents the binding energy measured from EF. The spectrum for 6P is taken from the literature.28 The filled spectrum shown below each observed UPS spectrum is the simulated UPS spectrum. The vertical bars in the simulated spectra present the calculated MOs of 6P and [8]CPP. The leading edges of the UPS spectra were indicated by vertical broken lines at 1–2 eV. (b) The wave functions of the HOMOs of 6P and [6]CPP. (c) The wave function of the state of [8]CPP marked by an asterisk in (a). The figures of the orbital for [6]CPP and [8]CPP are the view from above the macrocycle. | ||
| HOMO | LUMO | |
|---|---|---|
| [6]CPP | 4.91 | 1.78 |
| [8]CPP | 5.02 | 1.80 |
| [9]CPP | 5.12 | 1.72 |
| [12]CPP | 5.22 | 1.68 |
| 6P | 5.50 | 1.36 |
| 8P | 5.44 | 1.44 |
| 9P | 5.43 | 1.47 |
| 12P | 5.40 | 1.53 |
The overall features of the spectra of 6P and [8]CPP are very similar, but there are some clear differences. First, the spectral structures at 1–3 eV of the binding energy in the UPS spectra of 6P consist of HOMO and HOMO−1, whereas the spectral structures in the same energy range in the UPS spectra of [8]CPP consist of HOMO, HOMO−1 and HOMO−2. The HOMO−1 and HOMO−2 of [8]CPP are almost degenerate. Comparing the energy of the leading edges of the UPS spectra indicated by vertical broken lines at 1–2 eV in Fig. 2(a), the energy of the leading edge for [8]CPP is much lower than that for 6P, mainly because of the difference in HOMO energy between 6P and [8]CPP: the calculated energy of HOMO of [8]CPP is lower than that of 6P. On the other hand, the HOMO energy of [6]CPP is lower by ∼0.1 eV than that of [8]CPP, as shown in Table 1. The low HOMO energy of [8]CPP can be attributed to its cyclic molecular structure. Fig. 2(b) shows the HOMOs of 6P and [6]CPP. That of [6]CPP extends perpendicular to its molecular plane, indicating that each phenylene unit is comparatively upright. The dihedral angles θ between neighboring phenylene units of [n]CPP strongly depend on the molecular size, for example, θ in small diameter [n]CPPs are generally lower than those in nPs. In contrast, the θ of nP is almost independent of n, as shown in Fig. S2 in the ESI.† For example, the dihedral angle in [6]CPP is about 80% of that in 6P.27 The plane of the phenylene units in [6]CPP tends to be vertical and the overlap between the π-orbitals of neighboring units are larger compared with 6P, leading to a larger transfer-integral between each phenylene unit. This explains the lower HOMO energy of [8]CPP compared with that of 6P. MO calculations were performed on [8]CPP to support this interpretation by setting all θ s to 0 degrees. The results are shown in Fig. S3 in ESI.†Eg of the molecule where all the phenylene units are vertical is significantly reduced (Eg = 2.20 eV) compared with that of the molecule with the optimized structure (Eg = 3.22 eV).
A second difference in the spectra of 6P and [8]CPP is the spectral features at 6–8 eV of the binding energy in the UPS spectrum. The states indicated by a vertical arrow in Fig. 2(a) appear only in the spectrum of [8]CPP. One of the wave functions belonging to these states, which is marked with an asterisk on the MO in Fig. 2(a), is shown in Fig. 2(c) and consists of a pair of reflectional symmetric parts with opposite signs, with one nodal plane perpendicular to the macrocycle plane. This is a characteristic orbital of the cyclic structure of the molecule. There is no corresponding state in 6P which has a linear structure.
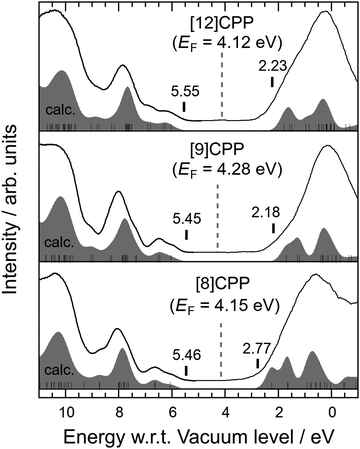
Fig. 3 shows the UPS spectra combined with the IPES spectra of [n]CPP (n = 8, 9, and 12). The combination of UPS and IPES measurements provides an excellent way to probe the electronic structure around the HOMO–LUMO gap of a molecule. The bottom axis represents the binding energy measured from the vacuum-level energy Evac, which can be directly calculated from the observed high-energy cut-off of the UPS spectra. The broken vertical lines in Fig. 3 indicate the obtained EF for each molecule. The simulated spectra based on the MO calculations explain the observed UPS and IPES (UPS/IPES) spectra, as shown in Fig. 3. The simulated spectra are shifted individually to reproduce the UPS/IPES spectra.
E g can be evaluated by the energy difference between the onset of the simulated UPS/IPES spectra, as indicated by vertical bars in each spectrum shown in Fig. 3. The values of the HOMO and LUMO energies and Eg evaluated from the UPS/IPES results are summarized in Table 2, together with the calculated values. Actually, Eg increases as the molecule in the series becomes larger.
| [8]CPP | [9]CPP | [12]CPP | |
|---|---|---|---|
| UPS/IPES | 2.69 ± 0.07 | 3.29 ± 0.03 | 3.33 ± 0.05 |
| UV-vis (film) | 2.72 ± 0.05 | 2.77 ± 0.05 | 2.96 ± 0.05 |
| UV-vis (solution) | 2.73 ± 0.03 | 2.85 ± 0.04 | 3.05 ± 0.04 |
| XPS (shake-up) | 2.8 ± 0.5 | 3.5 ± 0.1 | — |
| MO calculation | 3.22 | 3.41 | 3.54 |
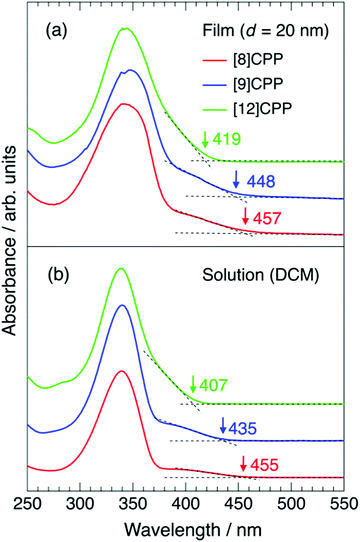
Fig. 4(a) and (b) show the UV-vis spectra of thin films and dichloromethane solutions of [n]CPP (n = 8, 9, and 12), respectively. The concentrations of the solutions are 0.03 wt%, 0.02 wt% and 0.004 wt% for [8]CPP, [9]CPP and [12]CPP. The films were 20 nm thick. The spectral widths of the UV-vis spectra of the thin films are broader than those of the corresponding solution, but there is no significant difference in spectral shape, indicating that there is little intermolecular interaction between [n]CPP molecules and that each molecule is relatively isolated in the film. Strong intermolecular interaction often results in molecular aggregation and change in spectral shape, such as Davydov splitting accompanied by a redshift.
The wavelength of the UV-vis absorption maxima λmax is at ∼340 nm for all films and solutions tested, consistent with a previous report,1 but appear inconsistent with the n dependence of Eg, discussed above. However, Iwamoto et al. reported that the HOMO–LUMO transition is forbidden in [n]CPPs and that no or little oscillator strength is expected.25,29,30 The transitions from HOMO−2 to LUMO, HOMO−1 to LUMO, HOMO to LUMO+1, and HOMO to LUMO+2 are responsible for the intense absorption peaks at ∼340 nm in all cases. On the other hand, small shoulder structures at 380–450 nm likely originate from the HOMO–LUMO transition.31,32 The appearance of the HOMO–LUMO transition, which is typically forbidden, results from breaking of the D(n/2)h or C2 symmetry of [n]CPP molecules. As pointed out in previous theoretical studies,27,33 [n]CPPs with an even number of phenylene units have D(n/2)h symmetry and those with an odd number have C2 symmetry, but physical molecules do not have such perfect symmetry due to their distorted structure. The intensity of the shoulder is higher, especially for [8]CPP but also for [9]CPP, than for [12]CPP, as seen in Fig. 4. The wavelength of the onset of the shoulder structures in the UV-vis spectra in Fig. 4 decreases as n increases for both the film and solution for each compound, consistent with the behavior of Eg against n observed by UPS/IPES. The onset values are summarized in Table 2.
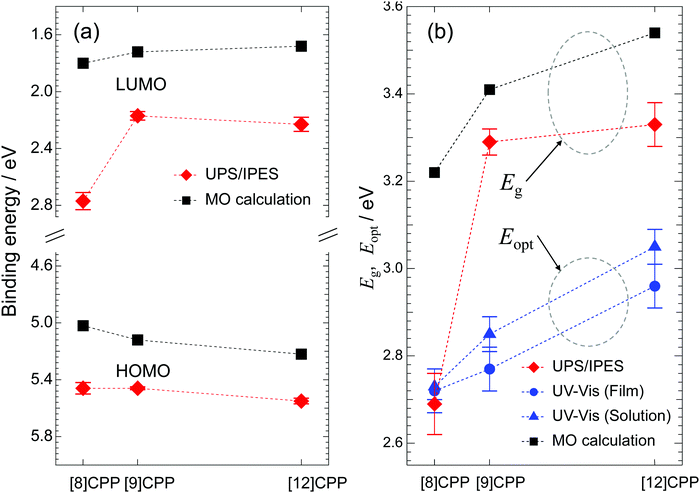
Fig. 5(a) shows the HOMO and LUMO energies measured in the UPS/IPES spectra plotted against n together with the calculated results, and Fig. 5(b) shows the values for Eg determined from the UPS/IPES and Eopt from the UV-vis spectra together with the values determined by MO calculation. Here, Eopt represents the energy gap related to the optical transition from HOMO to LUMO observed in the UV-vis spectra in Fig. 4. The Eopt values were calculated from the wavelength of the onset in the UV-vis spectra. The Eopt value of each molecule is similar for the film and solution. In general, the difference between Eg and Eopt is due to the binding energy of excitons in the S1 final state of the UV-vis absorption process, but as can be seen in Fig. 5(b), there is little difference in these values for [8]CPP.
Comparison of the HOMO and LUMO energies obtained from the experiments and the calculation shows trends against n in overall agreement. This is also true for Eg and Eopt plotted against n in Fig. 5(b). The n dependences of Eg and Eopt, which were experimentally obtained, increase as n increases, consistent with the prediction by calculation. The discrepancy in the value of Eg between the theoretical and experimental results is due to many factors, such as the polarization energy in solid films, electron correlation effects, and differences in the chemical environment of each molecule in the film. In contrast, the MO calculations are performed on an isolated molecule. Addressing these issues is beyond the scope of this article and further details will not be discussed here. However, MO calculations are very helpful for qualitative discussions.
As pointed out in previous theoretical work,25 strains in the cyclic molecular structure of [n]CPP generate the observed anomalous dependence of Eg on molecular size. Here, this unique behavior of the Eg value of [n]CPP was experimentally confirmed by direct observation.
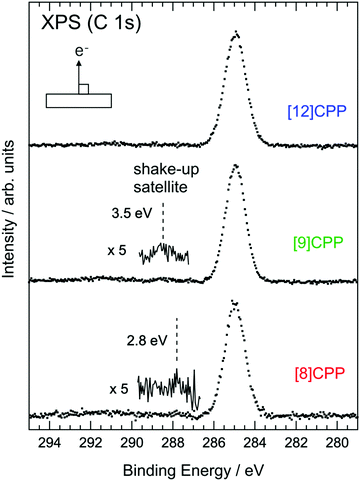
The molecular size dependence of Eg can also be detected by XPS experiments. Fig. 6 shows the C 1s XPS results for solid films of [8]CPP, [9]CPP, and [12]CPP. The bottom axis is the binding energy measured from EF. The binding energies of the main peaks of [8]CPP, [9]CPP, and [12]CPP are 284.90 eV, 284.95 eV, and 284.71 eV, respectively. The C 1s XPS spectrum of [8]CPP is basically consistent with the result previously reported.34 There are several small humps at the higher binding energy side of the C 1s main peaks of [8]CPP and [9]CPP in Fig. 6. On the other hand, the spectrum of [12]CPP doesn’t show any clearly distinguishable structure in the same energy region. The hump nearest each main peak is indicated by a dashed line and is the “shake-up satellite” originating from photoemission from the C 1s core level accompanied by electron excitation from HOMO to LUMO. Part of the kinetic energy of the photoelectron from the core level is expended to excite one electron in the HOMO to LUMO. Thus, the energy of the shake-up satellite measured from the main peak roughly represents Eg in the presence of the C 1s core hole. Generally, it is not possible to evaluate the correct value of Eg from the shake-up satellite, but one can discuss the magnitude of the relation of Eg with different molecules. In the cases of [8]CPP and [9]CPP, as n increases, the shake-up satellite recedes from the main peak, indicating an increase in Eg. The energies of the shake-up satellites measured from the main peaks in the XPS spectra are summarized in Table 2. Discussion of the exact value of the shake-up satellite is difficult; nonetheless, this result provides evidence that Eg of a series of [n]CPP molecules increases as the size of the molecule increases, which supports the conclusion based on the UPS/IPES and UV-vis results given above.
4. Conclusion
The electronic structure of a series of [n]CPP molecules was investigated by direct observation by means of UPS, IPES, UV-vis, and XPS experiments. The unusual molecular size dependence of the HOMO–LUMO gap of the [n]CPP series confirmed the prediction of theoretical calculations. Comparison between nP and [n]CPP aids interpretation of the unique properties of [n]CPP from the viewpoint of molecular structure. To understand the Eg of nP and [n]CPP, two factors should be considered. First, the number of MOs increases as a linear function of n, leading to narrowing of Eg. In general, the distribution width of such MOs at a given number of unit n depends on the transfer-integral β, resulting from the overlap between the π-orbitals of neighboring units. For large β, the energy of HOMO measured from vacuum level is low and that of LUMO measured from vacuum level is high, and therefore Eg becomes small. Second, the value of β is strongly influenced by the strain in the molecule. For largely strained structure with large dihedral angles, the overlap between the π-orbitals of neighboring units is small making Eg large. The first and second factors have opposite effects on Eg. For nP, the first factor should be dominant because no striking structural change occurs with increasing n. The dihedral angles between neighboring phenylene units in nP stay almost the same independently of n. Because the average dihedral angles of nP are basically larger than those of [n]CPP, nP has larger Eg than [n]CPP. In contrast to nP, the electronic structure, including the size of Eg of [n]CPP, is strongly affected by the second factor. In the case of [n]CPP, as the dihedral angles between neighboring phenylene units dramatically increase as n increases, the overlap between the π-orbitals of neighboring units rapidly decreases. This effect damps β and decreases the distribution width of the MOs around Eg. As a result, Eg is widened and approaches the Eg of poly(p-phenylene) as n increases.Conflicts of interest
There are no coflicts to declare.References
- R. Jasti, J. Bhattacharjee, J. B. Neaton and C. R. Bertozzi, J. Am. Chem. Soc., 2008, 130, 17646–17647, DOI:10.1021/ja807126u.
- H. Chen, S. Gui, Y. Zhang, Z. Liu and Q. Miao, CCS Chem., 2020, 2, 613–619, DOI:10.31635/ccschem.020.202000189.
- H. Takaba, H. Omachi, Y. Yamamoto, J. Bouffard and K. Itami, Angew. Chem., Int. Ed., 2009, 48, 6112–6116, DOI:10.1002/anie.200902617.
- H. Omachi, S. Matsuura, Y. Segawa and K. Itami, Angew. Chem., Int. Ed., 2010, 49, 10202–10205, DOI:10.1002/anie.201005734.
- Y. Segawa, S. Miyamoto, H. Omachi, S. Matsuura, P. Senel, T. Sasamori, N. Tokito and K. Itami, Angew. Chem., Int. Ed., 2011, 50, 3244–3248, DOI:10.1002/ange.201007232.
- Y. Segawa, P. Šenel, S. Matsuura, H. Omachi and K. Itami, Chem. Lett., 2011, 40, 423–425, DOI:10.1246/cl.2011.423.
- R. Jasti and C. R. Bertozzi, Chem. Phys. Lett., 2010, 494, 1–7, DOI:10.1016/j.cplett.2010.04.067.
- E. H. Fort, P. M. Donovan and L. T. Scott, J. Am. Chem. Soc., 2009, 131, 16006–16007, DOI:10.1021/ja907802g.
- H. Omachi, T. Nakayama, E. Takahashi, Y. Segawa and K. Itami, Nat. Chem., 2013, 5, 572–576, DOI:10.1038/nchem.1655.
- P. Li, B. M. Wong, L. N. Zakharov and R. Jasti, Org. Lett., 2016, 18, 1574–1577, DOI:10.1021/acs.orglett.6b00430.
- J. M. Van Raden, S. Louie, L. N. Zakharov and R. Jasti, J. Am. Chem. Soc., 2017, 139, 2936–2939, DOI:10.1021/jacs.7b00359.
- P. J. Evans, L. N. Zakharov and R. Jasti, J. Photochem. Photobiol., A, 2019, 382, 111878, DOI:10.1016/j.jphotochem.2019.111878.
- K. Matsui, Y. Segawa and K. Itami, Org. Lett., 2012, 14, 1888–1891, DOI:10.1021/ol3005112.
- N. Kubota, Y. Segawa and K. Itami, J. Am. Chem. Soc., 2015, 137, 1356–1361, DOI:10.1021/ja512271p.
- T. Fukushima, H. Sakamoto, K. Tanaka, Y. Hijikata, S. Irle and K. Itami, Chem. Lett., 2017, 46, 855–857, DOI:10.1246/cl.170210.
- Y.-D. Guo, H.-L. Zeng, L.-Z. Hu, X.-H. Yan, X.-Y. Mou and M.-S. Yanga, Phys. Lett. A, 2018, 382, 2763–2768, DOI:10.1016/j.physleta.2018.07.028.
- T. Iwamoto, Y. Watanabe, T. Sadahiro, T. Haino and S. Yamago, Angew. Chem., Int. Ed., 2011, 50, 8342–8344, DOI:10.1002/anie.201102302.
- J. Xia, J. W. Bacon and R. Jasti, Chem. Sci., 2012, 3, 3018–3021, 10.1039/C2SC20719B.
- K. Yuan, C.-H. Zhou, Y.-C. Zhu and X. Zhao, Phys. Chem. Chem. Phys., 2015, 17, 18802–18812, 10.1039/C5CP02882E.
- S. Canola, C. Graham, A. J. Pérez-Jiménez, J. C. Sancho-García and F. Negri, Phys. Chem. Chem. Phys., 2019, 21, 2057–2068, 10.1039/C8CP06727A.
- L. Hu, Y. Guo, X. Yan, H. Zeng and J. Zhou, Phys. Lett. A, 2017, 381, 2107–2111, DOI:10.1016/j.physleta.2017.04.035.
- A. Pérez-Guardiola, J. Pérez-Jiménez, L. Muccioli and J. C. Sancho-García, Adv. Mater. Interfaces, 2019, 6, 1801948, DOI:10.1002/admi.201801948.
- J. C. Sancho-García, M. Moral and A. J. Pérez-Jiménez, J. Phys. Chem. C, 2016, 120, 9104–9111, DOI:10.1021/acs.jpcc.6b02424.
- J. B. Lin, E. R. Darzi, R. Jasti, I. Yavuz and K. N. Houk, J. Am. Chem. Soc., 2019, 141, 952–960, DOI:10.1021/jacs.8b10699.
- T. Iwamoto, Y. Watanabe, Y. Sakamoto, T. Suzuki and S. Yamago, J. Am. Chem. Soc., 2011, 133, 8354–8361, DOI:10.1021/ja2020668.
- Y. Segawa, A. Fukazawa, S. Matsuura, H. Omachi, S. Yamaguchi, S. Irle and K. Itami, Org. Biomol. Chem., 2012, 10, 5979–5984, 10.1039/C2OB25199J.
- E. R. Darzi and R. Jasti, Chem. Soc. Rev., 2015, 44, 6401–6410, 10.1039/C5CS00143A.
- K. Seki, U. O. Karlsson, R. Engelhardt, E. Koch and W. Shmidt, Chem. Phys., 1984, 91, 459–470, DOI:10.1016/0301-0104(84)80078-6.
- J. Xia, M. R. Golder, M. E. Foster, B. M. Wong and R. Jasti, J. Am. Chem. Soc., 2012, 134, 19709–19715, DOI:10.1021/ja307373r.
- B. M. Wong, J. Phys. Chem. C, 2009, 113, 21921–21927, DOI:10.1021/jp9074674.
- N. Kubota, Y. Segawa and K. Itami, J. Am. Chem. Soc., 2015, 137, 1356–1361, DOI:10.1021/ja512271p.
- P. Li, T. J. Sisto, E. R. Darzi and R. Jasti, Org. Lett., 2014, 16, 182–185, DOI:10.1021/ol403168x.
- Y. Segawa, H. Omachi and K. Itami, Org. Lett., 2010, 12, 2262–2265, DOI:10.1021/ol1006168.
- D. Newby Jr., PhD thesis, Boston University, 2015. https://hdl.handle.net/2144/15176.
Footnote |
| † Electronic supplementary information (ESI) available. See DOI: 10.1039/d1cp00625h |
| This journal is © the Owner Societies 2021 |


