
 Open Access Article
 This Open Access Article is licensed under a
 Creative Commons Attribution 3.0 Unported Licence
Effect of the in-plane aspect ratio of a graphene filler on anisotropic heat conduction in paraffin/graphene composites†
Hiroki
Matsubara
 * and
Taku
Ohara
* and
Taku
Ohara
Institute of Fluid Science, Tohoku University, 2-1-1 Katahira, Aoba-ku, Sendai, 980-8577, Japan. E-mail: matsubara@microheat.ifs.tohoku.ac.jp; Tel: +81 22 217 5252
First published on 14th May 2021
Abstract
Enhancement of polymer thermal conductivity using nanographene fillers and clarification of its molecular-scale mechanisms are of great concern in the development of advanced thermal management materials. In the present study, molecular dynamics simulation was employed to theoretically show that the in-plane aspect ratio of a graphene filler can have a significant impact on the effective thermal conductivity of paraffin/graphene composites. Our simulation included multiple graphene fillers aggregated in a paraffin matrix. The effective thermal conductivity of a paraffin/graphene composite, described as a second-rank tensor in the framework of equilibrium molecular dynamics simulation, was calculated for two types of graphene fillers with the same surface area but in-plane aspect ratios of 1 and 10. The filler with the higher aspect ratio was found to exhibit a much higher thermal conductivity enhancement than the one with the lower aspect ratio. This is because a high in-plane aspect ratio strongly restricts the orientation of fillers when they aggregate and, consequently, highly ordered agglomerates are formed. On decomposing the effective thermal conductivity tensor into various molecular-scale contributions, it was identified that the thermal conductivity enhancement is due to the increased amount of heat transfer inside the graphene filler, particularly along the longer in-plane axis. The present result indicates a possibility of designing the heat conduction characteristics of a nanocomposite by customizing the filler shapes so as to control the aggregation structure of the fillers.
1. Introduction
Composites consisting of a paraffin matrix and graphene fillers have attracted interest as thermal materials, such as phase change materials (PCMs) for thermal energy storage1 and thermal interface materials (TIMs) for reducing thermal resistance in semiconductor devices.2 While paraffin has many advantages including light weight, high flexibility, and low cost, it has the disadvantage of a low thermal conductivity, of the order of 10−1 W (m K)−1. Graphene, whose thermal conductivity has been reported to be in the range of 1000–5000 W (m K)−1,3,4 is a suitable filler to enhance the thermal conductivity of paraffin. If the effect of the filler is proportional to the contact area between the matrix and the filler, a smaller filler would be more advantageous, as a larger contact area could be achieved at the same filler concentration. Therefore, attempts have been made to use various types of nanographene fillers.5,6 The observed values for the effective thermal conductivity of actual paraffin/graphene composites are rather scattered in the range of the order of 10−1–101 W (m K)−1 for filler concentrations less than 20 wt%,7–10 and these values are much lower than expected when compared with the high thermal conductivity of graphene. To understand this result, many molecular-scale factors must be considered in addition to thermodynamic conditions including temperature, pressure, and filler concentration.The geometric shape of graphene fillers is one such factor. The thermal conductivity of a single-layer graphene (SLG) with nanoscale in-plane dimensions is typically lower by one or two orders of magnitude than that of macroscopic graphene4,11 in particular by enhanced scattering of ballistic phonons at the filler edges. In addition, the effect of interfacial thermal resistance between paraffin and graphene, estimated to be of the order of 10−9–10−7 m2·K W−1,7,10,12 increases with decreasing filler size. These effects of the filler size may be a reason for the insufficient thermal conductivity enhancement.
The aspect ratio of the graphene filler is also an important factor. Some authors have reported that filler percolation dramatically enhances effective thermal conductivity.13,14 In general, filler particles with a higher aspect ratio can achieve the percolation threshold at lower filler concentration.15 The thermal percolation, however, may not always be visible because the contrast in thermal conductivity between matrix and filler is several orders of magnitude lower than the contrast in electric conductivity in the case of electric percolation.16,17 Some of the recent effective medium theories take into account the aspect ratio of the in-plane width to the cross-plane thickness of multi-layer graphene (MLG) fillers,17,18 but the effect of the in-plane aspect ratio (the ratio of one in-plane side to the other in-plane side) has rarely been discussed.
Effective thermal conductivity also depends strongly on the detailed arrangement of matrix and filler molecules in a composite. It is known that pristine graphene fillers aggregate easily in a polymer matrix, especially by stacking in the cross-plane direction, resulting in a poor filler dispersion.19,20 Although it is generally believed that better filler dispersion leads to higher effective thermal conductivity, the effect of filler aggregation in reality is more complicated as summarized in the review paper of Gu et al.11 The thermal conductivity of an MLG suspended across a trench decreases with increasing number of graphene layers, Nlayer, because of the increased scattering of the out-of-plane phonon modes.21 Molecular dynamics (MD) simulation showed that an MLG in a vacuum behaves similarly.22 Since the interaction with a substrate also scatters the out-of-plane phonon modes of graphene, the thermal conductivity of an SLG supported on a hard substrate reduces to the order of 102 W (m K)−1.23,24 In contrast to the suspended case, the thermal conductivity of the supported graphene increases with Nlayer, as the graphene–substrate interactions per single sheet become weaker. Both MD simulation18 and experiments7 indicate that a sufficiently stiff matrix can play the same role as the substrate. Thus, graphene stacking (poor filler dispersion) either increases or decreases the effective thermal conductivity of a composite, depending on whether the graphene filler in the composite is close to the suspended or supported graphene, respectively.
As for molecular orientation, the effective thermal conductivity of a polymer/graphene composite is usually higher when graphene fillers are more aligned,2,25,26 although the opposite behavior has been observed in some cases.27 In addition, both MD simulations28,29 and experiments8 have shown that paraffin molecules in the vicinity of a graphene or carbon nanotube filler are forced to align along the fillers and thus contribute to the enhancement of thermal conductivity. Consequently, heat conduction in a paraffin/graphene composite is anisotropic.
MD simulation has been utilized to investigate the effect of molecular-scale factors on the thermal conductivity enhancement in paraffin/graphene composites,10,12,25,28–30 as well as other polymer/graphene composites.5,18 Most of these MD studies dealt with a system where a single filler of SLG or MLG was embedded in a matrix or multiple SLGs were uniformly dispersed,25 and therefore the aggregation of fillers except for simple stacking has not been fully discussed. In addition, the effective thermal conductivity of composites has been calculated mostly using non-equilibrium MD (NEMD) simulation. In order to examine the anisotropy in thermal conductivity using the NEMD method, one must perform multiple simulations with a temperature gradient imposed in different directions.28–31 Ideally, it is desirable to express thermal conductivity as a second-rank tensor and examine heat conduction in the principal directions. To this aim, the equilibrium MD (EMD) simulation based on the Green–Kubo formula is more suitable than the NEMD method because all components of the thermal conductivity tensor can be obtained in a single simulation run.
In the present study, we used such an EMD evaluation of the thermal conductivity tensor to calculate the effective thermal conductivity of a paraffin/graphene composite as a function of filler concentration. The results of two nanographene fillers with the same surface area but different in-plane aspect ratios were compared to show the significant effect of the shape of the graphene filler on thermal conductivity enhancement. In our simulation, the filler aggregation and the resultant anisotropy in heat conduction were explicitly considered by using multiple graphene nanofillers and by representing effective thermal conductivity as a tensor. In addition, heat conduction in each principal direction was further decomposed into various molecular-scale contributions32 to obtain a detailed picture of heat conduction in the composite.
To provide reference information, we also computed the thermal conductivity of an SLG and the melting point of paraffin for the models used in the present study. The computational methods for these values are briefly described in the ESI.†
2. Methods
2.1. Thermal conductivity tensor for a binary system
Let us consider a two-component system consisting of molecular species I = 1 and 2 in a volume V in a non-equilibrium steady state under a constant temperature gradient ∇T. The volume-averaged mass flux vector of species I is defined as | (1) |
 are the mass and velocity vector of atom i, respectively, and
  and
and  are the mass density and streaming velocity of species I, respectively. We assume that there is no net mass flow at any moment of time as
| J1 + J2 = 0, | (2) |
and that mass flux for each species on average is zero as
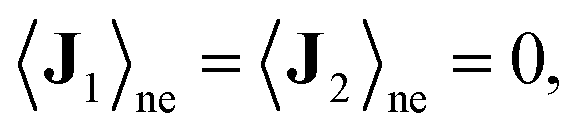 | (3) |
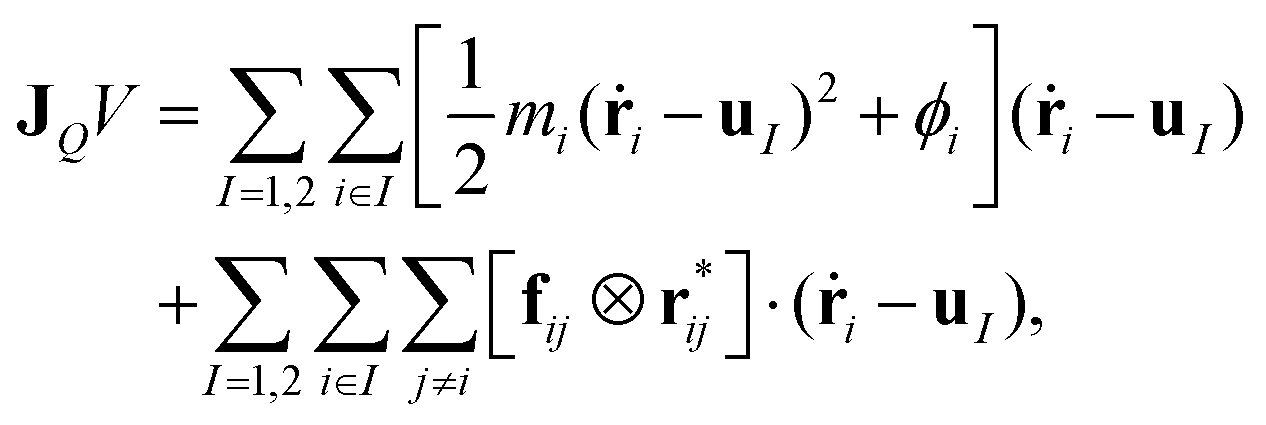 | (4) |
 is the fragment of vector rij = ri − rj contained in the volume V, and the operator ⊗ indicates the tensor product. If V denotes the entire MD box under the three-dimensional periodic boundary conditions,
  can be replaced with rij. The i–j force vector fij = −∂ϕj/∂ri, in general, depends on the coordinates of i, j, and many other atoms. In the right-hand side of eqn (4), the first term is called the transport term since it expresses the thermal energy transfer associated with the transport of atoms excluding the macroscopic mass flow. The second term is named the interaction term since it explains the thermal energy transfer between different atoms via inter- and intramolecular interactions. Within the framework of linear irreducible thermodynamics, the steady state averages of heat and mass fluxes can be linearly expanded using the gradients of temperature and chemical potentials as33,35
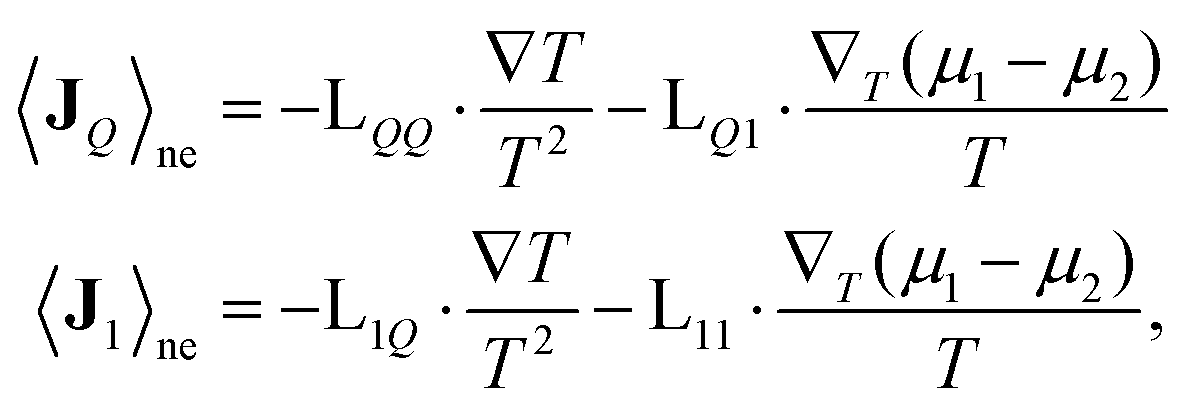 | (5) |
| λ = λQ + λMass | (6) |
The Green–Kubo formula relates the running value of the Onsager coefficient, LAB(t), to a correlation function in the reference equilibrium state as36,37
 | (7) |
 is the time correlation function between JA and JB at a time difference t′.
The reference equilibrium state signifies the equilibrium state which is spontaneously reached when ∇T applied in the non-equilibrium steady state is turned off. After a sufficiently large time t, LAB(t) becomes constant, and this value is equal to LAB appeared in eqn (5). Using eqn (6) and (7), one can derive the thermal conductivity tensor λ as a 3 × 3 matrix from EMD simulation. The three eigenvectors of λ, e1, e2, and e3, indicate the principal axes of heat conduction, and the corresponding eigenvalues λ1, λ2, and λ3 represent the thermal conductivity with respect to these axes. We refer to the largest and lowest eigen values as the first and third principal thermal conductivities, respectively.
The heat flux in eqn (4) can be expressed by the sum of the partial heat flux JX due to a specific interaction or a specific group of atoms,  . In the present study, molecular species I was either paraffin (P) or graphene (G), and the total heat flux in eqn (4) was decomposed as follows:
| JQ = (JTransP + JTransG) + (JIntraP + JIntraG + JInterP–P + JInterG–G + JInterG–P) | (8) |
 | (9) |
| λ = (λTransP + λTransG) + (λIntraP + λIntraG + λInterP–P + λInterG–G + λInterG–P) + λMass | (10) |
The contribution to the principal thermal conductivity λα (α = 1, 2, or 3) from a partial thermal conductivity can be obtained by the transformation P−1λXP, where P is the matrix that diagonalizes the total thermal conductivity tensor λ, and not λX.
2.2. Equilibrium MD simulations of a paraffin/graphene composite
Nonacosane (C29H60) was considered as the paraffin matrix in the present study. This molecule was also used in the experimental study on the thermal conductivity enhancement of paraffin/graphene PCM by Shi et al.9 The nonacosane molecule was modeled using the NERD potential.38 This potential employs a united atom model, where a CH2 unit and a CH3 unit are considered as the single interaction sites and the sites interact via van der Waals (vdW) interactions and intramolecular bond stretching, angle bending, and dihedral interactions. The graphene filler was modeled using the AIREBO potential,39 which satisfactorily describes the covalent bonds between C and H atoms in the sp, sp2, and sp3 hybridization states as well as vdW interactions among the non-bonded atoms. For both NERD and AIREBO potentials, vdW interactions are described using the Lennard-Jones (LJ) potential, where the distance parameter σab and the energy parameter εab for heterogeneous atom types a and b are given using the Lorentz–Berthelot combining rules. In the present study, the vdW interactions between nonacosane and graphene atoms were modeled using the LJ potential in the same manner. The cutoff distance for the LJ interaction between graphene atoms was set to 3σab according to the original parametrization of the AIREBO potential,39 while the cutoff distance of 15 Å was used for other atom pairs.To investigate the effect of the in-plane aspect ratio of the graphene filler, two filler shapes with a similar surface area were used. One had an in-plane aspect ratio of ∼1 as shown in Fig. 1(a) and is referred to as the square filler hereafter, while the other had an in-plane aspect ratio of ∼10 as shown in Fig. 1(d) and is called the ribbon-like filler. For both fillers, the shorter and the longer edges had armchair and zigzag structures, respectively, and all edges were terminated with hydrogen atoms. The square filler consisted of 284 C atoms and 78 H atoms, and the ribbon-like filler consisted of 276 C atoms and 46 H atoms.
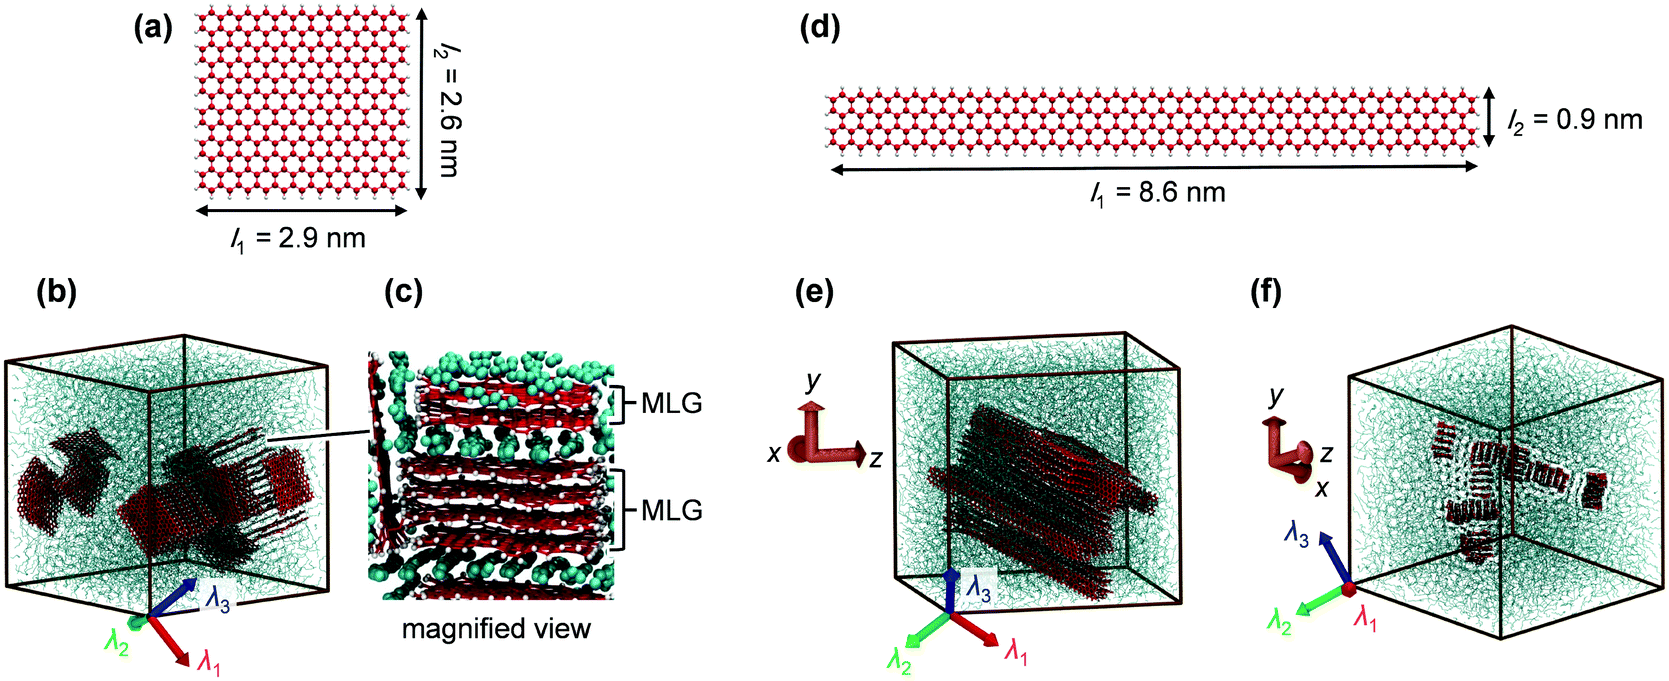 | ||
| Fig. 1 Structure of graphene fillers and snapshots of paraffin/graphene composites. (a) The square graphene filler. (b) The paraffin/graphene composite with 20 wt% square fillers and (c) its magnified view. (d) The ribbon-like graphene filler. (e and f) The paraffin/graphene composite with 20 wt% ribbon-like fillers as observed from two different directions. In figures (b), (e), and (f), the axes λ1, λ2, and λ3 indicate the first, second, and third principal axes of the thermal conductivity tensor, respectively. | ||
All MD simulations in the present study were performed using the LAMMPS software package.40 The algorithm of Martyna et al.41 was used with a timestep of 0.5 fs for the numerical integration of the equation of motion to generate various statistical ensembles such as the NVE (micro canonical), NVT (canonical), and NpT (isobaric–isothermal) ensembles. We modified some source codes so that heat flux was computed according to eqn (4) with the decomposition as in eqn (8). The detailed expression for the i–j force fij in eqn (4) that we employed here for NERD and AIREBO potentials can be found in ref. 42 and 43, respectively. It should be noted that these expressions satisfy the energy conservation law, which is not guaranteed by the original heat flux formula in LAMMPS.44,45
We constructed several MD systems of the composites at 360 K using either the square or ribbon-like filler with different filler mass fractions wG up to relatively high values of filler concentration. The simulation settings for all cases examined are summarized in Table 1. The system with wG = 0 wt% corresponds to the pure paraffin matrix, containing 1440 nonacosane molecules. The maximum filler concentration was wG = 60.5 wt%, containing 140 sheets of square graphene.
![[small lambda, Greek, macron]](https://www.rsc.org/images/entities/i_char_e0cc.gif) (isotropic average), where the figure in parentheses indicates uncertainty in the last digit
(isotropic average), where the figure in parentheses indicates uncertainty in the last digit
| Run | w G [wt%] | N P | N G | L [Å] | τ [ns] |
[W (m K)−1] |
|---|---|---|---|---|---|---|
| Square filler | ||||||
| 0 | 0 | 1440 | 0 | 108.631 | 30.0 | 0.130(2) |
| 1 | 0.569 | 1436 | 1 | 108.611 | 30.0 | 0.131(2) |
| 2 | 1.70 | 1425 | 3 | 108.494 | 30.0 | 0.132(5) |
| 3 | 2.82 | 1417 | 5 | 108.446 | 30.0 | 0.130(2) |
| 4 | 5.06 | 1390 | 9 | 108.084 | 30.0 | 0.132(4) |
| 5 | 7.24 | 1369 | 13 | 107.821 | 30.0 | 0.131(2) |
| 6 | 10.4 | 1342 | 19 | 107.646 | 30.0 | 0.143(3) |
| 7 | 20.0 | 1250 | 38 | 106.833 | 42.5 | 0.141(4) |
| 8 | 30.2 | 1136 | 60 | 105.644 | 42.5 | 0.150(3) |
| 9 | 39.6 | 1029 | 82 | 104.750 | 42.5 | 0.148(6) |
| 10 | 60.5 | 751 | 140 | 102.473 | 42.5 | 0.183(7) |
| Ribbon-like filler | ||||||
| 11 | 0.591 | 1435 | 1 | 108.587 | 30.0 | 0.131(3) |
| 12 | 5.22 | 1395 | 9 | 109.952 | 30.0 | 0.145(3) |
| 13 | 10.2 | 1348 | 18 | 107.928 | 30.0 | 0.162(4) |
| 14 | 20.5 | 1255 | 38 | 107.376 | 42.5 | 0.174(2) |
| 15 | 40.0 | 1024 | 80 | 105.275 | 42.5 | 0.233(6) |
The MD box was initially a cube with side length of 170 Å, in which graphene fillers and paraffin molecules were arranged regularly in a lattice-like pattern with fixed molecular orientations. Graphene sheets were sufficiently far from each other (an example of this molecular arrangement is shown in Fig. S3 in the ESI†). The initial velocities of atoms were randomly assigned from the Maxwell velocity distribution at 10 K. The system temperature was then increased to 600 K at a constant rate by a 0.5 ns NVE run with velocity scaling at 50 fs interval. Next, the system was agitated by a 9.5 ns NpT run at 600 K and 1 atm to erase the memory of the initial molecular arrangement. After this, the system was cooled down to 360 K over 3 ns and equilibrated at 360 K for 6 ns. In these NpT runs, a pressure of 1 atm was applied isotropically. At this point, the volume of the MD box was fixed, and the system was further relaxed by a 3 ns NVT run followed by a 3 ns NVE run. It was considered that an equilibrium state was reached at this point, since no significant drift in the potential energy was recognized during the last NVE run. Finally, the production NVE run was then performed for τ = 30.0–42.5 ns. The total simulation time τ was equally partitioned into five segments to estimate the statistical error of a physical quantity A as  , where σ(A) is the standard deviation of the five average values computed for the five segments. We note that the temperature chosen here, 360 K, is higher than the melting temperature of pure nonacosane, which was calculated to be 348 K as described in the ESI.† Thus, we focused on the liquid-like states of the composite. While the self-diffusion coefficient of the nonacosane matrix in the composite was D ∼ 2.8–6.2 × 10⁻¹⁰ m2 s−1, that of a graphene filler was much lower and the filler arrangement did not significantly change within the simulation time τ. Here, self-diffusion coefficient D for each component was estimated using the Einstein relation
  ,46 where ξ(t) is the mean square displacement of the center-of-mass coordinates of a paraffin molecule or a graphene sheet at time difference t, and its slope for t → ∞ was approximately obtained from the linear fit to the ξ–t curve for 1 ≤ t ≤ 1.5 ns.
3. Results and discussion
3.1. Effective thermal conductivity
The running values of the principal thermal conductivities were calculated for each time point t by diagonalizing the temporal thermal conductivity tensor constituted of LAB(t) in eqn (7). As an example, the results of the sample with 20 wt% ribbon-like fillers are plotted in Fig. 2. The three curves show different behaviors, indicating the anisotropy of heat conduction in the composite. For all cases examined, the curve was approximately constant after t = 8 ps, and the steady-state value of the principal thermal conductivity was determined as the time average over t = 8–10 ps.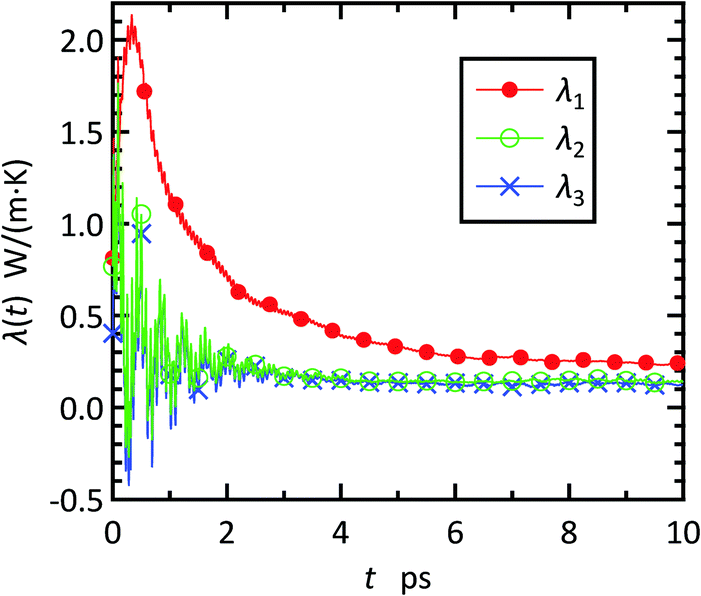 | ||
| Fig. 2 First, second, and third principal thermal conductivities, λ1, λ2, and λ3, respectively, as a function of time t for the paraffin/graphene composite with 20 wt% ribbon-like fillers. | ||
The isotropic thermal conductivity was calculated as the average of the three principal thermal conductivities, = (λ1 + λ2 + λ3)/3. The results are shown in Fig. 3(a), as a function of graphene mass fraction wG. The right axis shows the enhancement factor η = ( − λmat)/λmat × 100 relative to the matrix thermal conductivity λmat. As shown in Table 1, the thermal conductivity of pure nonacosane was calculated to be λmat = 0.130 ± 0.002 W (m K)−1. The isotropic thermal conductivity increased with graphene mass fraction. In the case of square filler, the enhancement was almost invisible for small graphene mass fractions until the enhancement factor increased to η = 9.8% at wG = 10 wt%.
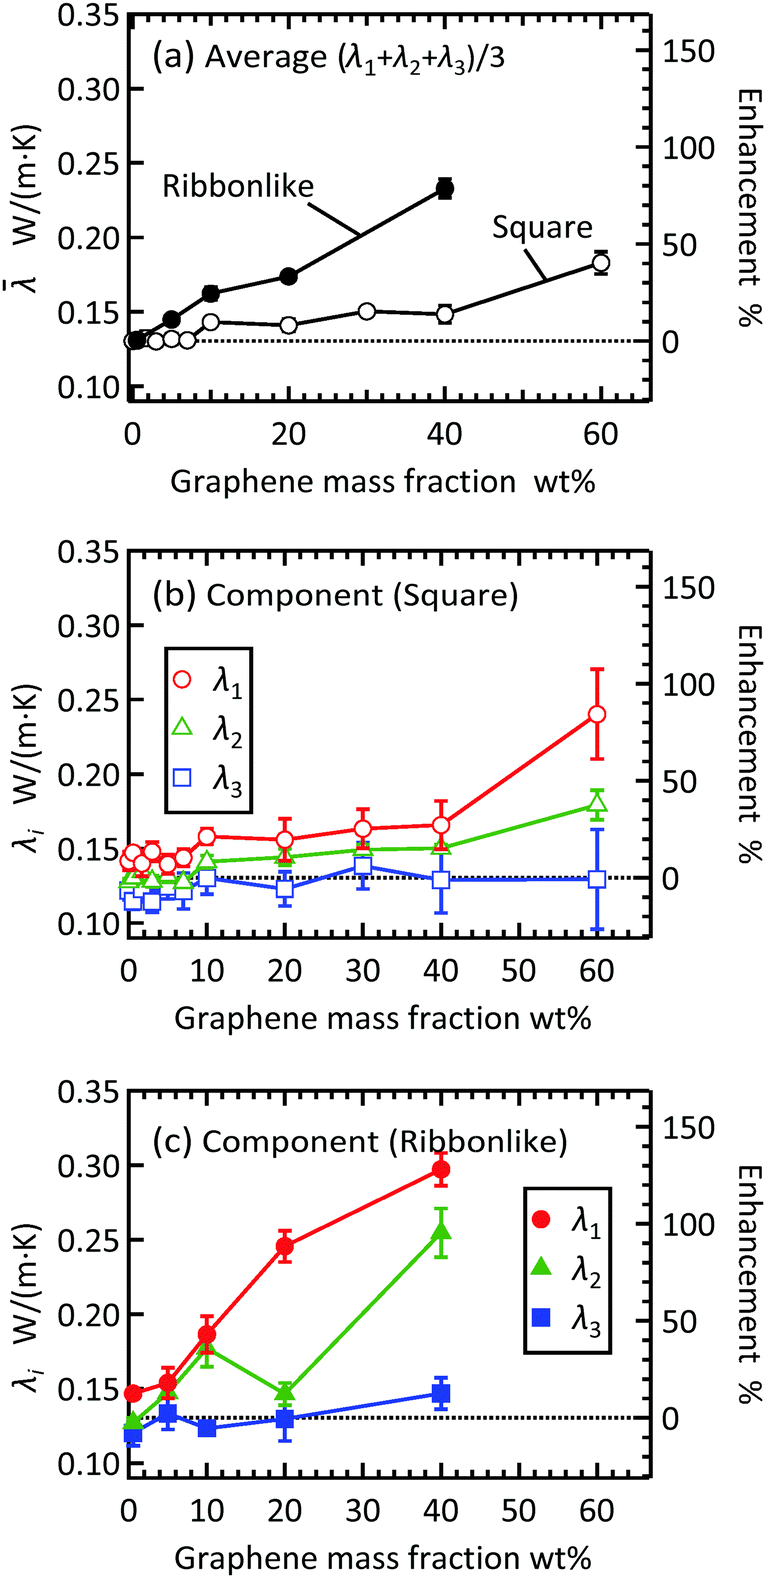 | ||
| Fig. 3 Effective thermal conductivity of a paraffin/graphene composite as a function of graphene mass fraction. (a) Isotropic average of the principal thermal conductivities, λ1, λ2, and λ3, for the ribbon-like and square graphene fillers; (b) principal thermal conductivities for the square filler; (c) principal thermal conductivities for the ribbon-like filler. | ||
The enhancement factor for the liquid-like states is usually lower than that for the solid-like states.9,28,29 Shi et al. measured the effective thermal conductivity of liquid-like nonacosane/graphene composites for wG ≤ 10 wt%. They observed the maximum enhancement of η ∼ 100% at 2 wt%, but the enhancement was not significant at some other filler concentrations.9 Our MD results are qualitatively consistent with their observation, but in our case, another reason for the low enhancement factor comes from the small size of the graphene filler. As described in the ESI,† the thermal conductivity of a single square filler was 54 ± 5 W (m K)−1 and that of a ribbon-like filler was 66 ± 4 along the longest axis, and these values are two orders of magnitude smaller than those of macroscopic graphene. We note that in many experiments, η reaches several hundred percent at filler concentrations less than 10 wt%,10,27 but these values were obtained for the solid-like states using graphene fillers of micrometer sizes. The ribbon-like filler shows a much higher enhancement than the square filler. When compared at wG = 40 wt%, the enhancement factor was η = 79% for the ribbon-like filler while η = 14% for the square filler, demonstrating clearly the effect of the in-plane aspect ratio of the graphene filler.
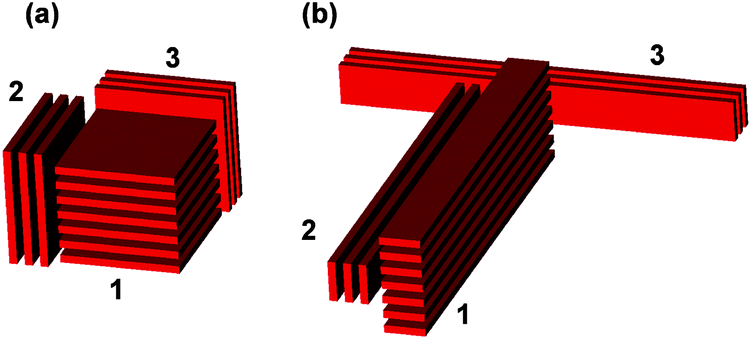
The principal thermal conductivities λ1, λ2, and λ3 for the square and ribbon-like fillers are shown in Fig. 3(b) and (c), respectively. For both the filler types, the anisotropy in heat conduction, indicated by the difference among the three principal components, increased with increasing graphene mass fraction. We note that the pure paraffin case also showed a small anisotropy as indicated by λ1 = 0.142 ± 0.006 W (m K)−1, λ2 = 0.128 ± 0.002 W (m K)−1, and λ3 = 0.122 ± 0.006 W (m K)−1, since the molecular alignment is not perfectly isotropic at a certain moment of time owing to the limited size of the system. Therefore, if the anisotropy in the composite is as small as at this level, we cannot judge whether or not it is due to the addition of graphene fillers. As wG increases, λ3 remains close to the pure matrix value, indicating that the enhancement in the isotropic thermal conductivity is mostly due to λ1 and λ2. This also means that the different degrees of enhancement between the square and ribbon-like fillers seen in Fig. 3(a) originate from λ1 and λ2. The effect of filler shape observed in Fig. 3 cannot be explained by the 22% difference in thermal conductivity of a single layer between the square and ribbon-like fillers. A more important factor is that fillers with different shapes aggregate differently in a composite, as will be discussed in the next section.
3.2. Molecular structure of the composite
In our MD simulations, the graphene fillers aggregated into several clusters during the process of reaching the equilibrium state at 360 K, which is consistent with the poor dispersion of graphene fillers in actual composites.20 When the filler concentration was lower than 5 wt%, each cluster was an MLG, which is an aggregate of several graphene sheets stacked in the cross-plane direction and has an almost rectangular-parallelepiped shape. At higher filler concentrations, agglomerates of multiple MLGs were formed. These structures in the composites with 20 wt% fillers are demonstrated in Fig. 1. It is well-known47 that the adsorption layers of paraffin molecules are formed at the filler–matrix interface. During the agglomeration process, some of these layers failed to escape from the gap between the MLGs and became part of the agglomerate as shown in Fig. 1(b) and (c).As shown in Fig. 1(b), MLGs in an aggregate are oriented in various directions and there is no apparent correlation between the agglomerate structure and the principal axes of the thermal conductivity tensor. By contrast, in the case of the ribbon-like filler, multiple MLGs orient in the same direction. That is to say, the longest axes of all constituent graphene sheets point in the same direction as shown in Fig. 1(e) and (f), and this direction is nearly equal to the first principal axis of thermal conductivity tensor. This highly ordered alignment of the ribbon-like fillers explains the large anisotropy in thermal conductivity exhibited in Fig. 3(c).
The λ2 curve of the ribbon-like filler in Fig. 3(c) makes a sudden dip at 20 wt%. This dip is likely because the filler orientation in the directions other than the longest-axis direction was less uniform in the 20 wt% case than those in other cases with ribbon-like fillers (see Fig. S4 in the ESI† for the simulation snapshots of all cases examined in the present study). The dip in λ2 explains the relatively small inclination of the curve of isotropic average of the ribbon-like filler at 10–20 wt% in Fig. 3(a).
The size of our MD system may appear to be small in comparison to the longest axis of the ribbon-like filler. To check the effects of the system size and the periodic boundary conditions, another simulation was performed for 20 wt% ribbon-like fillers using a simulation box with a side of L = 156.2 Å, which was 1.45 times larger than the original one, and contained 114 graphene sheets and 3873 nonacosane molecules. In this system, the graphene fillers aggregated into more than one cluster having different orientations (see Fig. S4 in the ESI†). However, the effective thermal conductivity and its components were calculated to be = 0.172 ± 0.004, λ1 = 0.23 ± 0.01, λ2 = 0.159 ± 0.005, and λ3 = 0.128 ± 0.007 in the units of W (m K)−1. These values are close to those obtained with the original system size (Run 14 in Table 1), = 0.174 ± 0.002, λ1 = 0.25 ± 0.01, λ2 = 0.146 ± 0.007, and λ3 = 0.13 ± 0.01 W (m K)−1. Therefore, although the system size can affect the details of filler arrangement, the highly ordered filler orientation and the resultant high effective thermal conductivity of the ribbon-like filler are not artifacts of the limited size of the simulation box. This result is also consistent with the fact that the size effect in EMD is generally much smaller than that in NEMD simulation.48
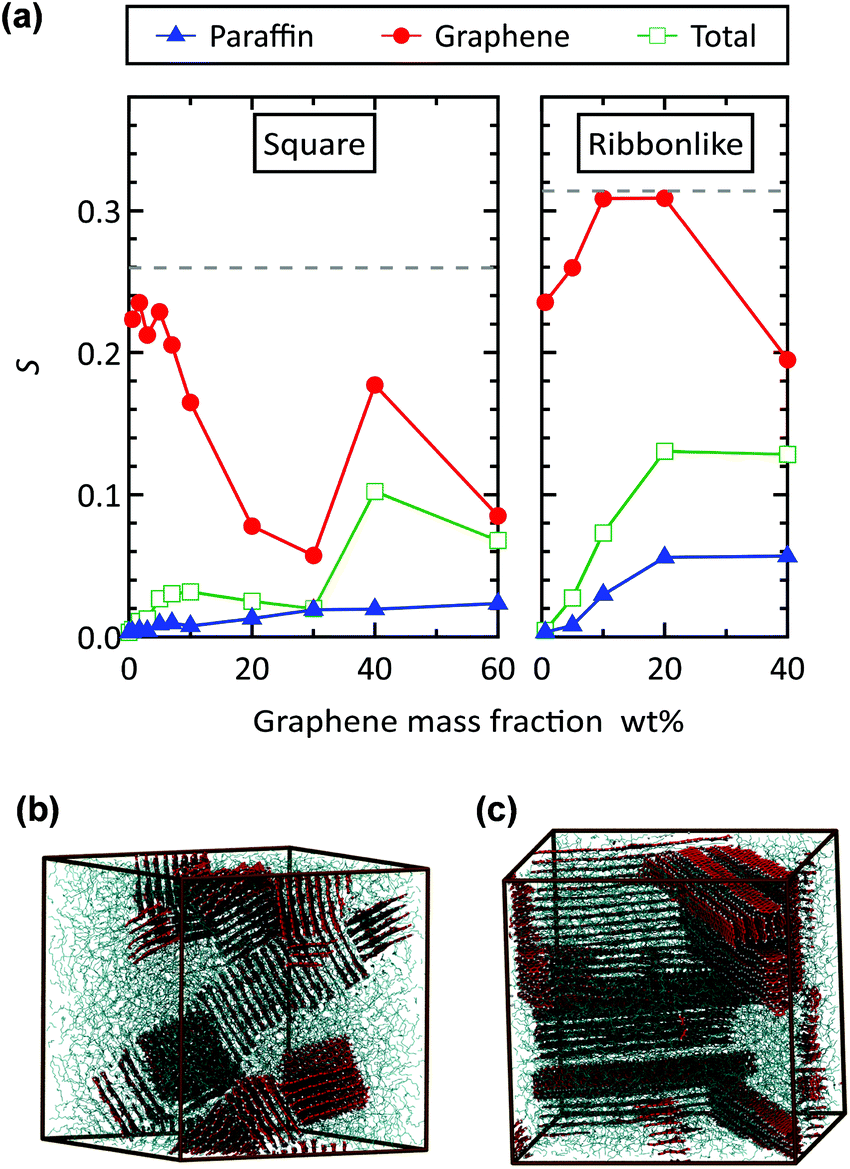
The structural difference between the agglomerates of the square and ribbon-like fillers can be understood by the fact that MLGs tend to stick together in such a way that the area of the joint surface is maximized as much as possible. This tendency restricts the possible patterns of aggregation for the ribbon-like fillers, for example, Fig. 4(a) and (b) illustrate the agglomerates of MLG1, MLG2, and MLG3, for the square and ribbon-like fillers, respectively. In the case of square filler, MLG1 in Fig. 4(a) has a sufficiently large surface area on any face and can form an agglomerate in which the in-plane directions of the constituent MLGs are not the same as shown in the figure. A similar aggregation pattern for the ribbon-like filler is shown in Fig. 4(b). In this case, the sticking pattern like that of MLG3 is unlikely to occur because the joint surface area with other MLGs is too small. Consequently, MLGs tend to stick together so that their longest axes point in the same direction, as MLG1 and MLG2 do in Fig. 4(b).
 | ||
| Fig. 4 Examples of aggregation pattern for three multi-layer graphene (MLG) 1–3 for (a) square fillers and (b) ribbon-like fillers. In (b), the attachment of MLG3 is not stable. | ||
Although rectangular fillers only are dealt with here, it would be possible to consider the effect of in-plane aspect ratio for other filler shapes in the same way. For example, in the case of a triangular filler, the five faces of an MLG are all flat, then the effect will be quite similar to that of a rectangular filler. In contrast, for an elliptical filler, since the side faces of an MLG are curved, the sticking of two MLGs using these faces may not be stable regardless of the in-plane aspect ratio. In such a case, the effect of in-plane aspect ratio is considered to be small.
In order to further examine the structural order of filler and matrix molecules, we computed the orientation of the C–C bonds in terms of the orientational order parameter S used for the isotropic–nematic transition of liquid crystals.49 Here, S was obtained as the largest eigenvalue of the second-rank ordering tensor 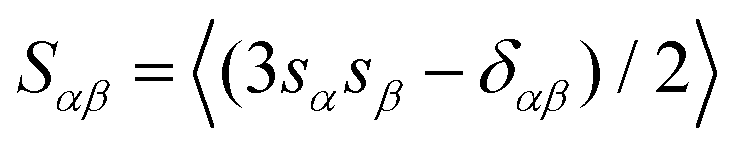 , where sα is the α component (α = x, y, or z) of the unit vector along a C–C bond, δαβ is the Kronecker delta, and 〈…〉 denotes the average over time and different bonds. The value of S varies from 0 to 1 according to the degree to which the C–C bonds are aligned in the same direction. The results for the square and ribbon-like fillers are compared in Fig. 5(a), where the order parameters computed for the C–C bonds in graphene, in paraffin, and in both molecules are separately shown.
 | ||
| Fig. 5 (a) Orientational order parameter S of the C–C bonds in graphene and paraffin molecules as a function of graphene mass fraction, obtained for the square (left) and ribbon-like (right) graphene fillers. The dashed line shows the value for a single, undeformed graphene sheet in vacuum, S = 0.260 for the square graphene and S = 0.314 for the ribbon-like graphene. Subfigures (b) and (c) show the simulation snapshots for the systems with 40 wt% square and ribbon-like graphene fillers, respectively. | ||
The results confirm that the ribbon-like filler gives a higher orientational order of molecules than the square filler. In the case of the square filler, S of graphene decreases with graphene mass fraction wG as expected from the random orientation of the MLGs. In contrast, S of paraffin always increases with filler concentration, indicating the effect of graphene filler in inducing the alignment of paraffin molecules.28,29 At wG = 40 wt%, a relatively high value of S is observed because the in-plane direction of the graphene fillers is aligned by chance as shown in Fig. 5(b). This irregularity is, however, not reflected in the curve of the effective thermal conductivity for the square filler in Fig. 3(a) and (b).
For the ribbon-like filler, S of graphene remained high up to a filler concentration of 20 wt%, which is consistent with a highly ordered filler alignment. In the case of 40 wt% ribbon-like fillers, two domains of different filler orientations are formed as shown in Fig. 5(c), reducing the S value. This reduction in S explains the relatively small slope of λ1 at 20–40 wt% in Fig. 3(c), since the S of the ribbon-like filler approximately represents how much the long axis of the filler is aligned in the first principal direction of heat conduction. The value of isotropic average is therefore considered lower than when the two domains were oriented in the same direction.
As a result of the reduction in S, on the other hand, the square and ribbon-like fillers have similar values of S at 40 wt%. Nevertheless, effective thermal conductivity is much higher for the ribbon-like filler because the size of a single orientational domain is still larger for the ribbon-like filler as can be understood by comparing Fig. 5(b) and (c). In addition to the graphene fillers, the ordering of paraffin molecules is also more significant in the case of the ribbon-like filler than in the case of the square filler.
As we saw above, effective thermal conductivity depends on the detailed filler arrangement in a composite. In the case of ribbon-like filler, effective thermal conductivity is linearly approximated as = 0.129 + 0.00328wG for wG = 0.591–10.2 wt% (Run 11 to 13). In this range of wG, most of the fillers in a composite had the same orientation with respect to all molecular axes (see Fig. S4 in the ESI†). Therefore, this linear equation is considered to predict the upper bound of for each value of wG that is reached when all fillers have the same orientation. The linear equation predicts that the effective thermal conductivity values for the perfect filler alignment will be = 0.196 and 0.260 W (m K)−1 at wG = 20.5 and 40 wt%, respectively. These values are about 10% higher than our results, = 0.174 and 0.233 W (m K)−1, respectively. Thus, about 10% difference in effective thermal conductivity is typically expected with different filler arrangements in a composite. This level of difference does not change the superiority of the ribbon-like filler shown in Fig. 3(a). In the present study, the high computational cost restricted us to consider only one molecular configuration for each filler concentration. Therefore, the curves in Fig. 3 are not the ideal ones obtained by averaging over different initial molecular configurations. However, based on the above discussion, the main conclusion of the present study would not be affected by a specific filler arrangement, as long as the relaxation simulation is sufficiently long for graphene sheets to move in a paraffin matrix and form agglomerates of MLGs.
3.3. Molecular scale heat transfer
To examine the molecular mechanism of thermal conductivity enhancement in Fig. 3, the decomposition of the isotropic thermal conductivity into the molecular contributions according to eqn (10) is shown in Fig. 6. For all cases, the heat–mass coupling term is a negative value as expected. Its magnitude was at most 2% of the total thermal conductivity of the composite, meaning that the heat–mass coupling is insignificant in the present study. As is typically the case with liquids in general,50–52 the contribution of the transport term (λTransP + λTransG) in the present case was also small with a maximum of 16% of the total thermal conductivity. The effective thermal conductivity is therefore determined by heat transfer via intra- and intermolecular interactions.
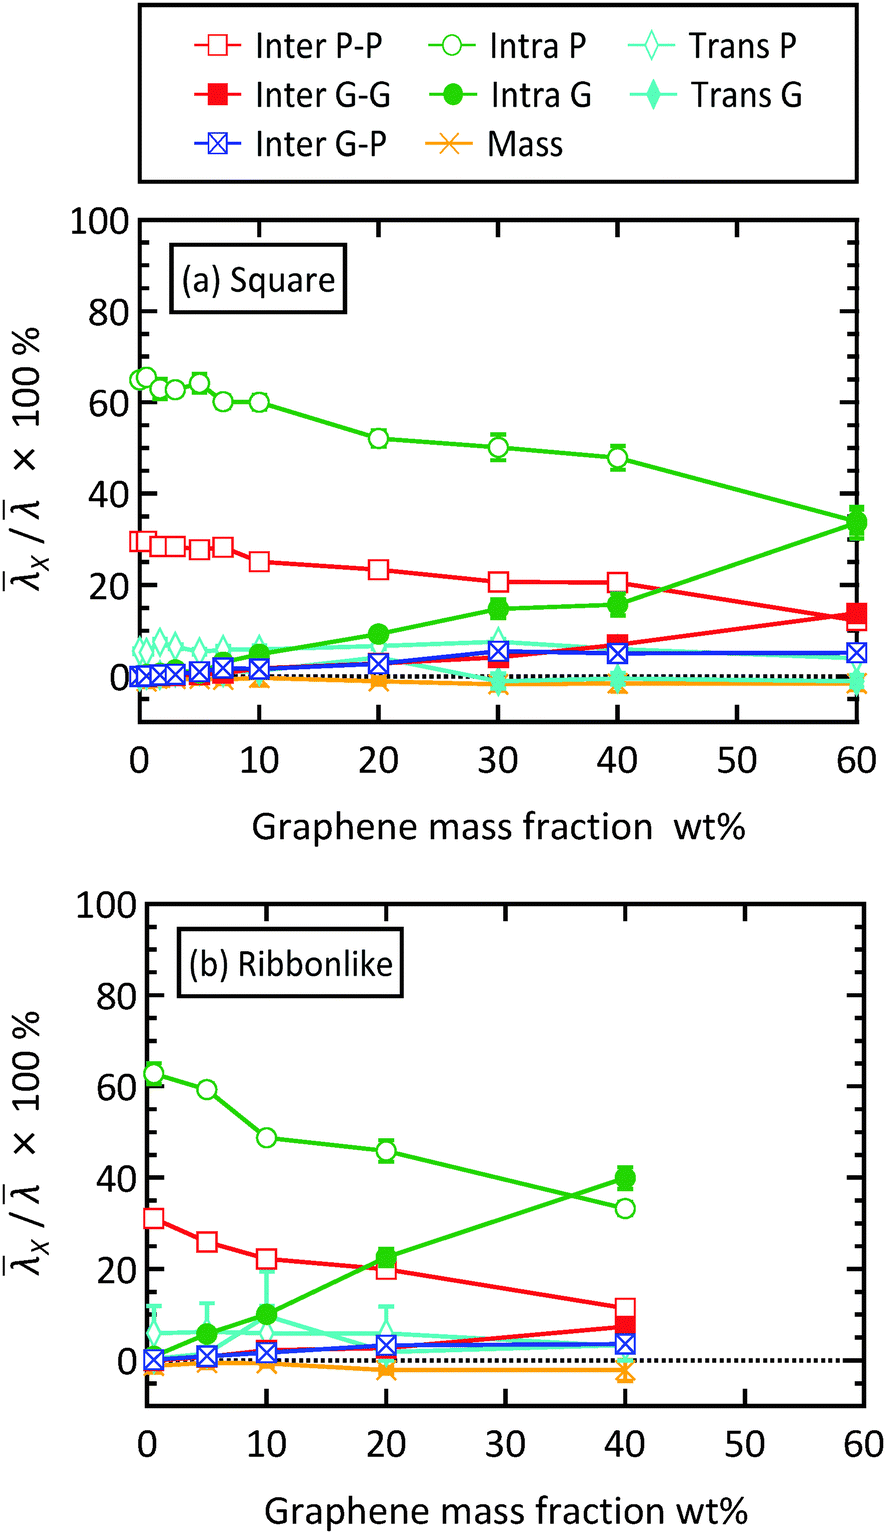 | ||
| Fig. 6 Decomposition of the isotropic thermal conductivity of the paraffin/graphene composite with (a) square filler and (b) ribbon-like filler. The total thermal conductivity was decomposed into contributions from the thermal energy transfer associated with intermolecular interaction (Inter), intramolecular interaction (Intra), molecular transport (Trans), and heat–mass coupling (Mass), and P and G indicate paraffin and graphene, respectively. The partial contribution X is shown as the percentage to the total thermal conductivity (see Fig. S5 in the ESI† for the plot of the absolute value of X). | ||
At low filler concentrations, effective thermal conductivity can be mainly explained by heat transfer among paraffin molecules through their intra- and intermolecular interactions (λIntraP + λinterP), and λIntraP is the largest contributor as is typically the case with liquid alkanes longer than decane.51,52 As the graphene mass concentration increases, these paraffin contributions decrease their percentage and, instead, the graphene counterparts (λIntraG + λinterG) increase. In particular, increase in λIntraG is exceptional, demonstrating that the enhancement of effective thermal conductivity is mainly achieved by the increased amount of heat transfer inside graphene. Comparing Fig. 6(a) and (b) reveals that the curves of the partial thermal conductivities other than that of λIntraG are quite similar for the two filler shapes. These results indicate that it is the amount of heat transfer inside the graphene filler that is most affected by both filler concentration and filler shape. As discussed above, the contributions relevant to graphene filler and paraffin matrix increase and decrease, respectively, with increasing filler concentration. This trend is mainly due to the change in the number density of graphene sheets, nG, and that of paraffin molecules, nP. To understand this, the heat transfer efficiency per graphene sheet and that per paraffin molecule are defined as ΛG = tr(λTransG + λIntraG + λInterGG)/(3nG) and and ΛP = tr(λTransP + λIntraP + λInterPP)/(3nP), respectively, and plotted in Fig. 7, where tr(A) means the trace of a tensor A. As shown in Fig. 7(a), the dependence of ΛG on filler concentration is not significant. The relatively large value at 10 wt% for the ribbon-like filler is presumably due to a specific filler arrangement in the composite rather than to filler concentration, because in this case all fillers had the same orientation.
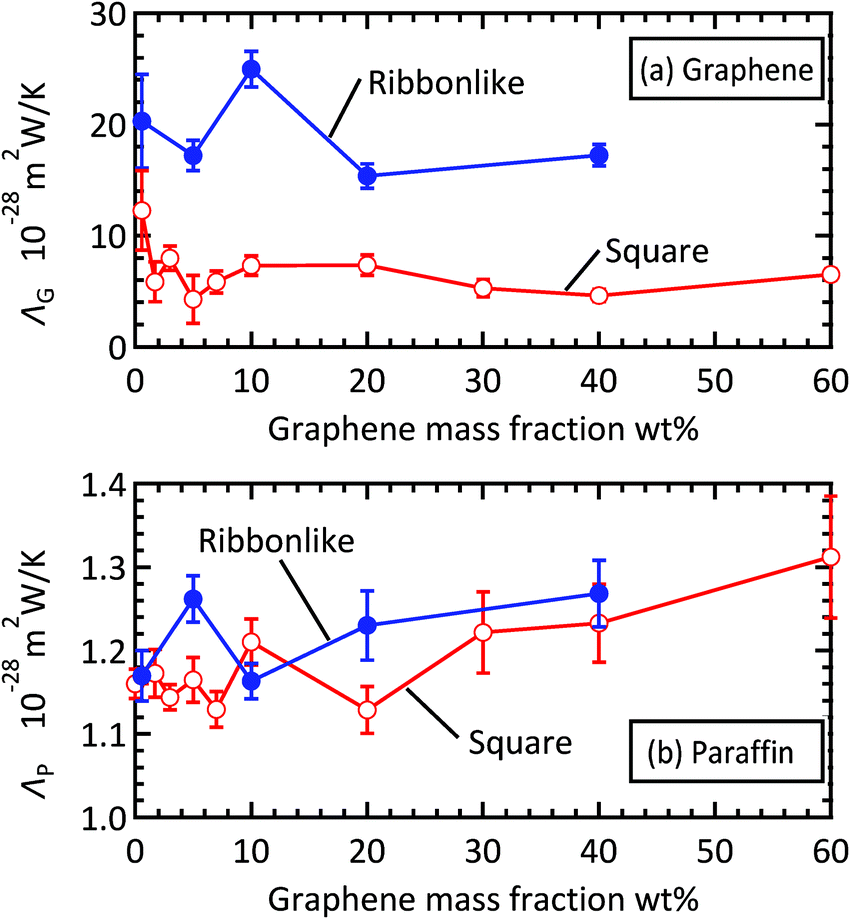 | ||
| Fig. 7 (a) Efficiency of heat transfer per graphene sheet and (b) that per paraffin molecule for the cases with square and ribbon-like fillers. | ||
The change in ΛG is considered to correspond roughly, if not exactly, to the change in the intrinsic thermal conductivity of graphene in the composite. As described in the Introduction, thermal conductivity per single graphene sheet in an MLG depends on the number of stacking layers, and the dependence is inverted depending on whether the MLG is suspended or supported.11 The weak dependence of ΛG on filler concentration in Fig. 7(a) indicates that the nature of the graphene fillers in our paraffin matrix is between that of the suspended and supported graphenes, considering that the average number of layers in an MLG is proportional to filler concentration. This behavior is reasonable as our composite is liquid-like but exhibits very low fluidity. As for paraffin, the dependence of ΛP on filler concentration, as shown in Fig. 7(b), is also insignificant but has a slightly increasing trend. This result implies that the thermal conductivity of the paraffin matrix is enhanced in the composite because of the filler-induced ordering of the paraffin molecules shown in Fig. 5(a). A similar phenomenon of ordering of paraffin molecules induced by graphene fillers has also been reported in other computational28,29 and experimental8 studies.
Next, the same decomposition as that for the isotropic thermal conductivity was examined for each principal thermal conductivity to investigate the origin of anisotropy. As an example, Fig. 8 compares the results for the cases with 20 wt% fillers, whose simulation snapshots are displayed in Fig. 1. For the square filler, Fig. 8(a) indicates that the moderate anisotropy in the effective thermal conductivity (Fig. 3(b)) originates from that in the intramolecular heat transfers in paraffin and graphene, i.e., λIntraP and λIntraG. For the ribbon-like filler, as shown in Fig. 8(b), the intra-graphene contribution in the first principal direction is prominent, and this direction is approximately parallel to the longer in-plane axis of the ribbon-like fillers as discussed before in relation to Fig. 1(e) and (f).
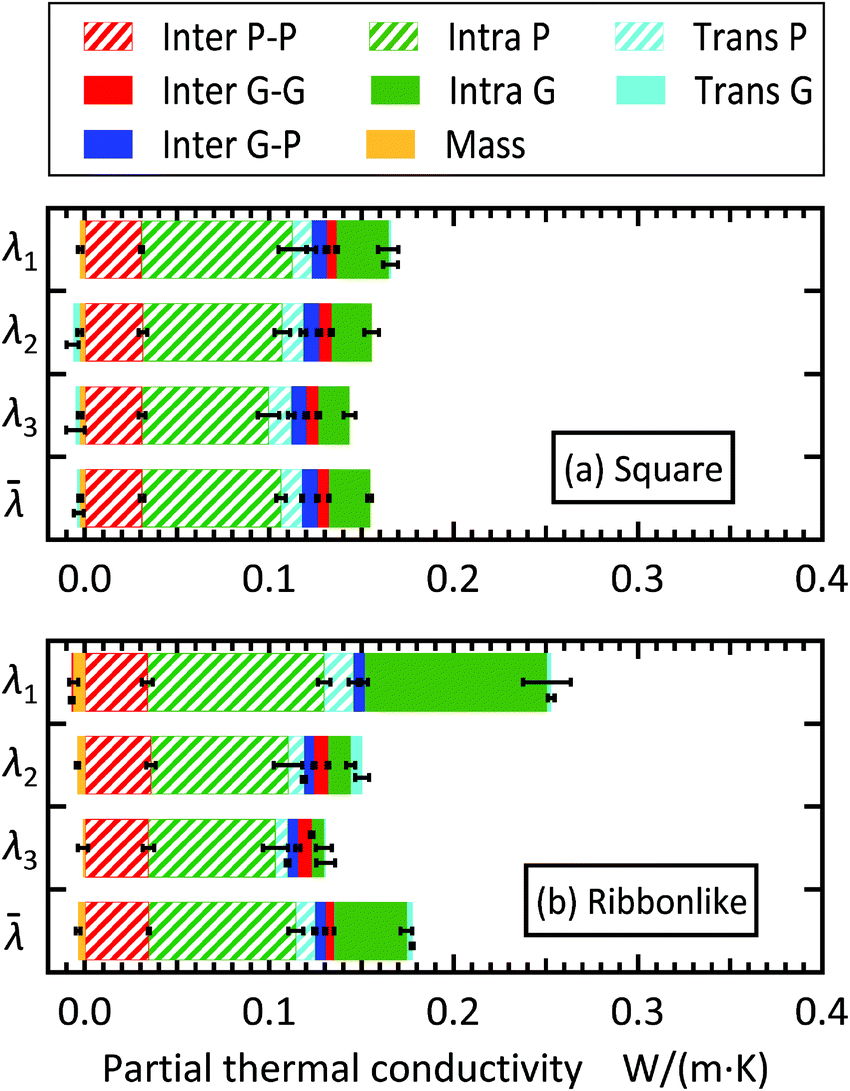 | ||
| Fig. 8 Decomposition of the first, second, and third principal components of thermal conductivity tensor, λ1, λ2, and λ3, and their average, , for the paraffin/graphene composite with the (a) square filler and (b) ribbon-like filler. For both cases, the mass fraction of graphene filler is 20 wt%. | ||
This result clearly shows that the enhancement in the intra-graphene heat conduction along the longest axis is the reason for the high enhancement in λ1. As shown in Fig. 3(c), the second principal thermal conductivity λ2 also increases to some extent with filler concentration, but this enhancement is due not only to the intra-graphene heat transfer, but also to other contributions, although we do not explicitly show it here. In contrast to the intramolecular contributions, the partial thermal conductivities associated with intermolecular heat transfer were mostly isotropic for all graphene–graphene, graphene–paraffin, and paraffin–paraffin pairs, regardless of the filler shape.
Our results clearly indicate that an increased amount of heat transfer inside the graphene fillers is the dominant factor for thermal conductivity enhancement upon adding graphene fillers. In contrast, the NEMD study of octadecane/graphene composite by Babaei et al.28,29 reached the conclusion that the thermal conductivity enhancement can be explained by increase in the thermal conductivity of the paraffin matrix. They employed a 4 × 4 nm2 graphene filler and observed 28% thermal conductivity enhancement with a filler concentration as low as 1.55 wt% above the melting temperature of paraffin. In their case, the orientational order parameter of paraffin, which is based on the end-to-end vector of a paraffin chain, dramatically changed by one order of magnitude upon adding one sheet of graphene. Since, as shown in Fig. 6, effective thermal conductivity at several wt% values of filler concentration is mostly explained by heat conduction in the paraffin matrix, it is reasonable that this sudden ordering of paraffin dramatically enhances heat conduction in paraffin, thereby leading to a large thermal conductivity enhancement. In our case, however, such a phase transition was not observed at least for filler concentrations of a few wt%. Thus, the detailed mechanism of thermal conductivity enhancement in their simulations and ours at low filler concentrations is different. The identification of the condition under which the strong ordering of paraffin is induced by graphene filler is a subject for future study.
4. Conclusions
In the present study, the effect of the in-plane aspect ratio of the graphene filler on the effective thermal conductivity of a paraffin/graphene composite was investigated using MD simulation, where filler aggregation, anisotropy in heat conduction, and the detailed picture of molecular-scale heat transfer were explicitly considered. At relatively high filler concentrations, thermal conductivity enhancement was explained to be mostly due to the increased amount of heat transfer inside the graphene filler. It was shown that a higher in-plane aspect ratio restricts the variation in filler orientation more when they aggregate and therefore the agglomerates formed are more ordered. Since this filler alignment further improves the intra-graphene heat transfer, fillers with a higher in-plane aspect ratio can more efficiently enhance the effective thermal conductivity. Here, the superiority of high aspect ratio fillers was demonstrated from the viewpoint of filler aggregation rather than thermal percolation. We used graphene fillers with rather small in-plane width and length, thereby leading to modest values of thermal conductivity enhancement. It is expected that, for larger fillers, thermal conductivity enhancement is higher, and accordingly the effect of the in-plane aspect ratio is more significant. The present result indicates the possibility of controlling the aggregation structure of fillers by customizing filler shapes, which is an intriguing strategy for the rational design of the heat transfer characteristics of composites.6Conflicts of interest
The authors declare that there are no conflicts of interest.Acknowledgements
This work was supported by JST CREST Grant Number JPMJCR17I2, Japan. Numerical simulations were performed on the Supercomputer system “AFI-NITY” at the Advanced Fluid Information Research Center, Institute of Fluid Science, Tohoku University.References
- R. Gulfam, P. Zhang and Z. Meng, Advanced thermal systems driven by paraffin-based phase change materials – A review, Appl. Energy, 2019, 238, 582–611 CrossRef CAS.
- A. Li, C. Zhang and Y. F. Zhang, Thermal conductivity of graphene-polymer composites: Mechanisms, properties, and applications, Polymers, 2017, 9, 1–17 CrossRef PubMed.
- A. A. Balandin, S. Ghosh, W. Bao, I. Calizo, D. Teweldebrhan, F. Miao and C. N. Lau, Superior thermal conductivity of single-layer graphene, Nano Lett., 2008, 8, 902–907 CrossRef CAS PubMed.
- X. Xu, L. F. C. Pereira, Y. Wang, J. Wu, K. Zhang, X. Zhao, S. Bae, C. Tinh Bui, R. Xie, J. T. L. Thong, B. H. Hong, K. P. Loh, D. Donadio, B. Li and B. Özyilmaz, Length-dependent thermal conductivity in suspended single-layer graphene, Nat. Commun., 2014, 5, 1–6 Search PubMed.
- X. Huang, C. Zhi, Y. Lin, H. Bao, G. Wu, P. Jiang and Y. W. Mai, Thermal conductivity of graphene-based polymer nanocomposites, Mater. Sci. Eng., R, 2020, 142, 100577 CrossRef.
- X. Shen, Q. Zheng and J. K. Kim, Rational design of two-dimensional nanofillers for polymer nanocomposites toward multifunctional applications, Prog. Mater. Sci., 2021, 115, 100708 CrossRef CAS.
- R. J. Warzoha and A. S. Fleischer, Effect of graphene layer thickness and mechanical compliance on interfacial heat flow and thermal conduction in solid-liquid phase change materials, ACS Appl. Mater. Interfaces, 2014, 6, 12868–12876 CrossRef CAS PubMed.
- R. J. Warzoha and A. S. Fleischer, Improved heat recovery from paraffin-based phase change materials due to the presence of percolating graphene networks, Int. J. Heat Mass Transfer, 2014, 79, 314–323 CrossRef CAS.
- J. N. Shi, M. Der Ger, Y. M. Liu, Y. C. Fan, N. T. Wen, C. K. Lin and N. W. Pu, Improving the thermal conductivity and shape-stabilization of phase change materials using nanographite additives, Carbon, 2013, 51, 365–372 CrossRef CAS.
- S. Srinivasan, M. S. Diallo, S. K. Saha, O. A. Abass, A. Sharma and G. Balasubramanian, Effect of temperature and graphite particle fillers on thermal conductivity and viscosity of phase change material n-eicosane, Int. J. Heat Mass Transfer, 2017, 114, 318–323 CrossRef CAS.
- X. Gu, Y. Wei, X. Yin, B. Li and R. Yang, Colloquium: Phononic thermal properties of two-dimensional materials, Rev. Mod. Phys., 2018, 90, 41002 CrossRef CAS.
- T. Luo and J. R. Lloyd, Enhancement of thermal energy transport across graphene/graphite and polymer interfaces: A molecular dynamics study, Adv. Funct. Mater., 2012, 22, 2495–2502 CrossRef CAS.
- F. Kargar, Z. Barani, R. Salgado, B. Debnath, J. S. Lewis, E. Aytan, R. K. Lake and A. A. Balandin, Thermal Percolation Threshold and Thermal Properties of Composites with High Loading of Graphene and Boron Nitride Fillers, ACS Appl. Mater. Interfaces, 2018, 10, 37555–37565 CrossRef CAS PubMed.
- H. S. Kim, J. Jang, H. Lee, S. Y. Kim, S. H. Kim, J. Kim, Y. C. Jung and B. J. Yang, Thermal Management in Polymer Composites: A Review of Physical and Structural Parameters, Adv. Eng. Mater., 2018, 20, 1–12 Search PubMed.
- A. Plyushch, P. Lamberti, G. Spinelli, J. Macutkevič and P. Kuzhir, Numerical simulation of the percolation threshold in non-overlapping ellipsoid composites: Toward bottom-up approach for carbon based electromagnetic components realization, Appl. Sci., 2018, 8, 882 CrossRef.
- N. Shenogina, S. Shenogin, L. Xue and P. Keblinski, On the lack of thermal percolation in carbon nanotube composites, Appl. Phys. Lett., 2005, 87, 1–3 CrossRef.
- Y. Su, J. J. Li and G. J. Weng, Theory of thermal conductivity of graphene-polymer nanocomposites with interfacial Kapitza resistance and graphene-graphene contact resistance, Carbon, 2018, 137, 222–233 CrossRef CAS.
- X. Shen, Z. Wang, Y. Wu, X. Liu, Y. B. He and J. K. Kim, Multilayer Graphene Enables Higher Efficiency in Improving Thermal Conductivities of Graphene/Epoxy Composites, Nano Lett., 2016, 16, 3585–3593 CrossRef CAS PubMed.
- D. Konatham and A. Striolo, Molecular design of stable graphene nanosheets dispersions, Nano Lett., 2008, 8, 4630–4641 CrossRef CAS PubMed.
- A. Liang, X. Jiang, X. Hong, Y. Jiang, Z. Shao and D. Zhu, Recent Developments Concerning the Dispersion Methods and Mechanisms of Graphene, Coatings, 2018, 8, 33 CrossRef.
- S. Ghosh, W. Bao, D. L. Nika, S. Subrina, E. P. Pokatilov, C. N. Lau and A. A. Balandin, Dimensional crossover of thermal transport in few-layer graphene, Nat. Mater., 2010, 9, 555–558 CrossRef CAS PubMed.
- H. Y. Cao, Z. X. Guo, H. Xiang and X. G. Gong, Layer and size dependence of thermal conductivity in multilayer graphene nanoribbons, Phys. Lett., Sect. A: Gen., At. Solid State Phys., 2012, 376, 525–528 CrossRef CAS.
- J. H. Seol, I. Jo, A. L. Moore, L. Lindsay, Z. H. Aitken, M. T. Pettes, X. Li, Z. Yao, R. Huang, D. Broido, N. Mingo, S. R. Ruoff and L. Shi, Two-Dimensional Phonon Transport, Science, 2010, 328, 213–216 CrossRef CAS PubMed.
- J. Chen, G. Zhang and B. Li, Substrate coupling suppresses size dependence of thermal conductivity in supported graphene, Nanoscale, 2013, 5, 532–536 RSC.
- D. Konatham, K. N. D. Bui, D. V. Papavassiliou and A. Striolo, Simulation insights into thermally conductive graphene-based nanocomposites, Mol. Phys., 2011, 109, 97–111 CrossRef CAS.
- Q. Li, Y. Guo, W. Li, S. Qiu, C. Zhu, X. Wei, M. Chen, C. Liu, S. Liao, Y. Gong, A. K. Mishra and L. Liu, Ultrahigh thermal conductivity of assembled aligned multilayer graphene/epoxy composite, Chem. Mater., 2014, 26, 4459–4465 CrossRef CAS.
- Y. J. Chen, D. D. Nguyen, M. Y. Shen, M. C. Yip and N. H. Tai, Thermal characterizations of the graphite nanosheets reinforced paraffin phase-change composites, Composites, Part A, 2013, 44, 40–46 CrossRef CAS.
- H. Babaei, P. Keblinski and J. M. Khodadadi, Improvement in thermal conductivity of paraffin by adding high aspect-ratio carbon-based nano-fillers, Phys. Lett. A, 2013, 377, 1358–1361 CrossRef CAS.
- H. Babaei, P. Keblinski and J. M. Khodadadi, Thermal conductivity enhancement of paraffins by increasing the alignment of molecules through adding CNT/graphene, Int. J. Heat Mass Transfer, 2013, 58, 209–216 CrossRef CAS.
- H. Tafrishi, S. Sadeghzadeh, R. Ahmadi, F. Molaei, F. Yousefi and H. Hassanloo, Investigation of tetracosane thermal transport in presence of graphene and carbon nanotube fillers–A molecular dynamics study, J. Energy Storage, 2020, 29, 101321 CrossRef.
- H. Tafrishi, S. Sadeghzadeh, F. Molaei and H. Siavoshi, Investigating the effects of adding hybrid nanoparticles, graphene and boron nitride nanosheets, to octadecane on its thermal properties, RSC Adv., 2020, 10, 14785–14793 RSC.
- H. Matsubara, G. Kikugawa, M. Ishikiriyama, S. Yamashita and T. Ohara, Equivalence of the EMD- and NEMD-based decomposition of thermal conductivity into microscopic building blocks, J. Chem. Phys., 2017, 147, 114104 CrossRef PubMed.
- G. V. Paolini and G. Ciccotti, Cross thermotransport in liquid mixtures by nonequilibrium molecular dynamics, Phys. Rev. A: At., Mol., Opt. Phys., 1987, 35, 5156–5166 CrossRef CAS PubMed.
- K. Fujiwara, M. Daimo, Y. Ueki, T. Ohara and M. Shibahara, Thermal conductivity of nanofluids: A comparison of EMD and NEMD calculations, Int. J. Heat Mass Transfer, 2019, 144, 118695 CrossRef CAS.
- J. Armstrong and F. Bresme, Thermal conductivity of highly asymmetric binary mixtures: how important are heat/mass coupling effects?, Phys. Chem. Chem. Phys., 2014, 16, 12307–12316 RSC.
- R. Zwanzig, Elementary Derivation of Time-Correlation Formulas for Transport Coefficients, J. Chem. Phys., 1964, 40, 2527–2533 CrossRef CAS.
- H. Matsubara, G. Kikugawa and T. Ohara, All- and one-particle distribution functions at nonequilibrium steady state under thermal gradient, Phys. Rev. E, 2019, 99, 52110 CrossRef CAS PubMed.
- S. K. Nath and R. Khare, New forcefield parameters for branched hydrocarbons, J. Chem. Phys., 2001, 115, 10837 CrossRef CAS.
- S. J. Stuart, A. B. Tutein and J. A. Harrison, A reactive potential for hydrocarbons with intermolecular interactions, J. Chem. Phys., 2000, 112, 6472–6486 CrossRef CAS.
- S. Plimpton, Fast Parallel Algorithms for Short-Range Molecular Dynamics, J. Comput. Phys., 1995, 117, 1–19 CrossRef CAS.
- G. J. Martyna, D. J. Tobias and M. L. Klein, Constant pressure molecular dynamics algorithms, J. Chem. Phys., 1994, 101, 4177–4189 CrossRef CAS.
- D. Torii, T. Nakano and T. Ohara, Contribution of inter- and intramolecular energy transfers to heat conduction in liquids, J. Chem. Phys., 2008, 128, 44504 CrossRef PubMed.
- H. Matsubara, G. Kikugawa, T. Bessho and T. Ohara, Evaluation of thermal conductivity and its structural dependence of a single nanodiamond using molecular dynamics simulation, Diamond Relat. Mater., 2020, 102, 107669 CrossRef CAS.
- D. Surblys, H. Matsubara, G. Kikugawa and T. Ohara, Application of atomic stress to compute heat flux via molecular dynamics for systems with many-body interactions, Phys. Rev. E, 2019, 99, 51301 CrossRef CAS PubMed.
- P. Boone, H. Babaei and C. E. Wilmer, Heat Flux for Many-Body Interactions: Corrections to LAMMPS, J. Chem. Theory Comput., 2019, 15, 5579–5587 CrossRef CAS PubMed.
- D. J. Evans and G. Morriss, Statistical mechanics of nonequilibrium liquids, Cambridge University Press, New York, 2nd edn, 2008 Search PubMed.
- P. Keblinski, S. R. Phillpot, S. U. S. Choi and J. A. Eastman, Mechanisms of heat flow in suspensions of nano-sized particles (nanofluids), Int. J. Heat Mass Transfer, 2002, 45, 855–863 CrossRef CAS.
- Z. Fan, L. F. C. Pereira, H.-Q. Wang, J.-C. Zheng, D. Donadio and A. Harju, Force and heat current formulas for many-body potentials in molecular dynamics simulations with applications to thermal conductivity calculations, Phys. Rev. B, 2015, 92, 94301 CrossRef.
- M. R. Wilson, Determination of order parameters in realistic atom-based models of liquid crystal systems, J. Mol. Liq., 1996, 68, 23–31 CrossRef CAS.
- H. Matsubara, G. Kikugawa, M. Ishikiriyama, S. Yamashita and T. Ohara, Microscopic picture of heat conduction in liquid ethylene glycol by molecular dynamics simulation: Difference from the monohydric case, Int. J. Heat Mass Transfer, 2018, 121, 1033–1038 CrossRef CAS.
- T. Ohara, T. Chia Yuan, D. Torii, G. Kikugawa and N. Kosugi, Heat conduction in chain polymer liquids: Molecular dynamics study on the contributions of inter- and intramolecular energy transfer, J. Chem. Phys., 2011, 135, 34507 CrossRef PubMed.
- H. Matsubara, G. Kikugawa, T. Bessho, S. Yamashita and T. Ohara, Effects of molecular structure on microscopic heat transport in chain polymer liquids, J. Chem. Phys., 2015, 142, 164509 CrossRef PubMed.
Footnote |
| † Electronic supplementary information (ESI) available. See DOI: 10.1039/d1cp00556a |
| This journal is © the Owner Societies 2021 |