
 Open Access Article
 This Open Access Article is licensed under a Creative Commons Attribution-Non Commercial 3.0 Unported Licence
Using computational chemistry to design pump–probe schemes for measuring nitrobenzene radical cation dynamics†
Hugo A.
López Peña
,
Derrick
Ampadu Boateng
,
Shane L.
McPherson
and
Katharine Moore
Tibbetts
 *
*
Department of Chemistry, Virginia Commonwealth University, Richmond, VA 23284, USA. E-mail: kmtibbetts@vcu.edu
First published on 31st May 2021
Abstract
The electronic potential energy surfaces of the nitrobenzene cation obtained from time-dependent density functional theory and coupled cluster calculations are used to predict the most efficient excitation wavelength for femtosecond time-resolved mass spectrometry measurements. Both levels of theory identify a strongly-coupled transition from the ground state of the nitrobenzene cation with a geometry-dependent oscillator strength, reaching a maximum at 90° C–C–N–O dihedral angle with a corresponding energy gap of ∼2 eV. These results are consistent with the experimental observation in the nitrobenzene cation of a coherent superposition of vibrational states: a vibrational wave packet. Time-resolved measurements using a probe wavelength of 650 nm, nearly resonant with the strong transition, result in enhanced ion yield oscillation amplitudes as compared to excitation with the nonresonant 800 nm wavelength. Analogous behavior is found for the closely related molecules 2- and 4-nitrotoluene. These results demonstrate that computational chemistry can predict the best choice of probe wavelength in time-resolved measurements of vibrational coherent states in molecular cations.
1 Introduction
Polyatomic radical cations are highly reactive species that contribute to many physical, chemical, and biological processes. For instance, radical cations and anions participate in shock initiation of detonated energetic materials used as explosives and propellants;1 generation of radical cations in DNA nucleobases and the sugar-phosphate backbone upon exposure to ionizing radiation induces DNA damage;2 and radical cations of polycyclic aromatic hydrocarbons (PAHs) undergo numerous reactions that form other complex molecules in the interstellar medium.3Intense femtosecond laser excitation coupled to mass spectrometry has been used for decades to study dissociation in radical cations because the short pulse duration induces rapid ionization prior to dissociative electronic excited state population, resulting in less molecular fragmentation.4 In particular, excitation with near-infrared wavelengths (∼1200–1600 nm) is widely observed to suppress fragmentation compared to excitation with the 800 nm Ti:Sapphire wavelength.5–11 The high yield of intact molecular ion is attributed to increased contribution of adiabatic electron tunneling to the ionization process, thereby enhancing population of the ground electronic state of the cation.6,9 However, extensive molecular fragmentation is still observed when the laser wavelength is resonant with an electronic transition between the ground electronic state and an excited state of the cation.7–15
Time-resolved pump–probe measurements are widely used to gain insight into how population of electronic excited states in radical cations induces dissociation.16–35 Many of these experiments have identified time-dependent oscillations in transient ion yields due to the preparation of a coherent superposition of vibrational states, i.e., a vibrational wave packet, by the pump pulse and its subsequent excitation by the time-delayed probe pulse.16–30 Complementary theoretical calculations of the participating electronic potential energy surfaces have uncovered mechanisms of dissociation via wave packet excitation. For instance, wave packet dynamics along the I–C–Br bending coordinate in CH2IBr+ create a dynamic resonance between the D0 and D3 electronic states that results in loss of neutral iodine to form CH2Br+.17,18 In acetophenone cation, wave packet dynamics along the torsional CH3CO–C6H5 twisting coordinate result in excitation from D0 to D2 at a dihedral angle of 90°, leading to loss of CH3 to form C6H5CO+.21,22
The known importance of electronic resonances to dissociation of radical cations has motivated the use of resonant probe wavelengths in time-resolved measurements,29–35 as is common practice in time-resolved studies of dynamics on neutral electronic excited states.36–41 Nevertheless, many time-resolved measurements on radical cations use the readily available 800 nm wavelength for probing cation dynamics.16–27 It would stand to reason that selecting the excitation wavelength to be resonant with electronic transitions in radical cations would enhance the amplitudes of the coherent oscillations resulting from vibrational wave packet dynamics. Computations of electronic potential energy surfaces can efficiently predict geometry-dependent electronic transitions in radical cations,17,18,21,22 making computational chemistry a potentially powerful tool for designing pump–probe control schemes to measure coherent vibrational dynamics.
In this work, we use time-dependent density functional theory (TDDFT) calculations of the electronic potential energy surfaces of the nitrobenzene (NB) cation to predict the most efficient excitation wavelength and verify this prediction with coupled cluster calculations and time-resolved mass spectrometric measurements. As a common model for nitroaromatic explosives such as 2,4,6-trinitrotoluene (TNT),42,43 NB has been subject to mass spectrometry studies using strong-field femtosecond laser excitation,42–45 although no time-resolved studies on NB have been reported to the best of our knowledge. We found a strongly-coupled transition in nitrobenzene cation at a C–NO2 dihedral angle of 90° with a ∼2 eV energy gap, making the transition nearly resonant with 650 nm excitation. Efficient geometry-dependent excitation at 650 nm is confirmed in pump–probe measurements, where oscillations in ion yields were enhanced by a factor of ∼2–5 as compared to excitation at 800 nm. Similar enhancement of oscillation amplitudes with 650 nm excitation is also observed in the cations of the related molecules 2-nitrotoluene and 4-nitrotoluene (2-NT and 4-NT). These results suggest that using computational chemistry to determine the best probe wavelength for time-resolved experiments can enhance the measurement of prepared vibrational coherent states, which is advantageous for coherent control and quantum information applications.
2 Methods
2.1 Theory
Our density functional theory (DFT) calculations were conducted using Gaussian 16 software46 employing the restricted Kohn–Sham formalism for neutral species and the unrestricted formalism for cationic species. We used the BPW9147 functional, within the generalized gradient approximation (GGA), for preliminary geometry and ground-state energy calculations alongside with the 6-311G* and 6-311+G* basis sets.48 After these preliminary calculations, neutral and cation geometries were optimized with the hybrid GGA B3LYP,49,50 the hybrid meta-GGA M06,51 and the long-range-corrected hybrid GGA CAM-B3LYP52 and ωB97XD53 functionals in their different combinations with the 6-311+G*,48 CBSB7,54 AUG-cc-pVDZ,55 and Def2TZVPP56 basis sets. The convergence threshold for total energy was set to 10−8 eV while the force threshold was set to 10−3 eV Å−1.The calculated adiabatic and vertical ionization energies in units of eV, along with comparison to photoelectron spectroscopy experiments57,58 are given in Table 1. The numbers shown within parentheses are the signed errors of calculated values with respect to the corresponding experimental quantities, with negative numbers indicating underestimation and positive numbers indicating overestimation. Clearly, the BPW91 functional used for preliminary calculations performed poorly. Long-range-corrected hybrid GGA CAM-B3LYP and ωB97XD functionals overestimated adiabatic and vertical ionization energies in all cases with the combinations CAM-B3LYP/AUG-cc-pVDZ, ωB97XD/AUG-cc-pVDZ, and ωB97XD/Def2TZVPP giving deviations around 1 eV from the vertical experimental value. Estimations obtained with the M06 functional agree within 0.15 and 0.05 eV to the experimental adiabatic and vertical values respectively with the M06/Def2TZVPP level of theory giving the most accurate results. The agreement for B3LYP calculations falls within 0.09 and 0.04 eV for adiabatic and vertical quantities with the combinations with the CBSB7, AUG-cc-pVDZ, and Def2TZVPP basis sets performing accurate estimations of both experimental quantities. Particularly, the value obtained at the B3LYP/Def2TZVPP level of theory matches the vertical experimental measurement. Due to these reasons we decided to undergo further benchmarking considering the B3LYP and M06 functionals and their combination with the Def2TZVPP basis set.
| Method | IEad | IEvert |
|---|---|---|
| a Ref. 57. b Ref. 58. | ||
| B3LYP/6-311+G* | 9.69 (0.09) | 10.03 (0.04) |
| B3LYP/CBSB7 | 9.61 (0.01) | 9.96 (−0.03) |
| B3LYP/AUG-cc-pVDZ | 9.62 (0.02) | 9.97 (−0.02) |
| B3LYP/Def2TZVPP | 9.64 (0.04) | 9.99 (0.00) |
| M06/6-311+G* | 9.75 (0.15) | 10.04 (0.05) |
| M06/CBSB7 | 9.70 (0.10) | 10.01 (0.02) |
| M06/AUG-cc-pVDZ | 9.70 (0.10) | 9.98 (−0.01) |
| M06/Def2TZVPP | 9.64 (0.04) | 9.95 (−0.04) |
| CAM-B3LYP/6-311+G* | 9.89 (0.29) | 10.13 (0.14) |
| CAM-B3LYP/CBSB7 | 9.81 (0.21) | 10.07 (0.08) |
| CAM-B3LYP/AUG-cc-pVDZ | 9.81 (0.21) | 11.01 (1.02) |
| CAM-B3LYP/Def2TZVPP | 9.83 (0.23) | 10.09 (0.10) |
| ωB97XD/6-311+G* | 9.83 (0.23) | 10.09 (0.10) |
| ωB97XD/CBSB7 | 9.78 (0.18) | 10.06 (0.07) |
| ωB97XD/AUG-cc-pVDZ | 9.75 (0.15) | 10.95 (0.96) |
| ωB97XD/Def2TZVPP | 9.75 (0.15) | 10.95 (0.96) |
| BPW91/6-311G* | 9.26 (−0.34) | 9.61 (−0.38) |
| BPW91/6-311+G* | 9.36 (−0.25) | 9.70 (−0.29) |
| EOM-IP-CCSD/6-311+G* | 10.06 (0.07) | |
| Expt. | 9.6a | 9.99b |
Additionally, we calculated the vertical ionization energy at the equation-of-motion ionization-potential coupled-cluster singles and doubles (EOM-IP-CCSD)59 level in conjunction with the 6-311+G* basis set considering NB optimized geometry at the B3LYP/Def2TZVPP level using Q-Chem 5.3.60 The optimized geometries of neutral NB and NB cation obtained at the B3LYP/Def2TZVPP level of theory are given in the ESI,† Table S1.
The frequencies and intensities of the vibrational modes in both the neutral molecule and the cation were calculated via normal mode analysis. In neutral NB, the values of the harmonic vibrational frequencies depended on whether the B3LYP or the M06 functional was used but, given a certain functional, the frequencies and intensities did not depend strongly on the basis set chosen. Fig. 1 shows the comparison between the predicted infrared spectra for the neutral molecule at the B3LYP/Def2TZVPP (red) and M06/Def2TZVPP (blue) levels to the experimental gas-phase spectrum obtained from NIST.61 The calculated harmonic frequencies match the experimental peaks reasonably well in the range of ∼500–2000 cm−1, but it is evident that the B3LYP/Def2TZVPP level of theory offers the best estimation. This agreement indicates the effectiveness of the method and suggests that the computed cation frequencies should be reasonably accurate. Fig. S1 and S2 of the ESI† show the comparison between the experimental infrared spectrum and the calculated spectra using the B3LYP and M06 functionals in combination with all the basis sets explored in this study. Full tabulated results of the harmonic vibrational frequencies and their corresponding intensities for the neutral molecule and its cation are presented in the ESI,† Tables S3 through S6.
 | ||
| Fig. 1 Experimental (black) and computed infrared spectra at the B3LYP/Def2TZVPP (red) and M06/Def2TZVPP (blue) levels of theory for NB. | ||
To determine the excited-state energies of the neutral and cationic NB, we performed time-dependent DFT (TDDFT)62 calculations using Gaussian 16. We calculated the first 10 singlet–singlet (for neutral NB) and doublet–doublet (for NB cation) transitions with the B3LYP and M06 functionals in combination with the above-mentioned four basis sets. We found an analogous behavior to that of simulated IR spectra: the dependence on the functional was stronger than that of the basis set. Fig. 2 shows the comparison of the experimental spectra for NB dissolved in methanol and in chloroform with the calculated ones at the B3LYP/Def2TZVPP and M06/Def2TZVPP levels. Experimental spectra in two solvents (see Section 2.2) are shown to illustrate any solvatochromic effects due to solvent polarity and ensure a reasonable comparison between experimental and calculated spectra. The comparison of the experimental UV-vis spectrum of NB dissolved in methanol with the spectra calculated using B3LYP and M06 functionals in combination with all the basis sets considered in this work can be seen in Fig. S3 of the ESI.† Full tabulated results of the excitation energies and their corresponding oscillator strengths for neutral and cationic NB are presented in Tables S7 through S10 of the ESI.† The better agreement of the computation at the B3LYP/Def2TZVPP level with the experiment follows in line with the previous bench-marking criteria. Unfortunately, the good performance of the B3LYP/Def2TZVPP level of theory in predicting the excitation spectrum of neutral NB cannot be extrapolated to NB radical cation. In Section 3.1 we will present TDDFT excited-state calculations for NB radical cation at the B3LYP/Def2TZVPP level but those calculations will be further supported with selected calculations at the equation-of-motion excitation-energies coupled-cluster singles and doubles (EOM-EE-CCSD)59 level. These EOM calculations were performed using Q-Chem 5.3.
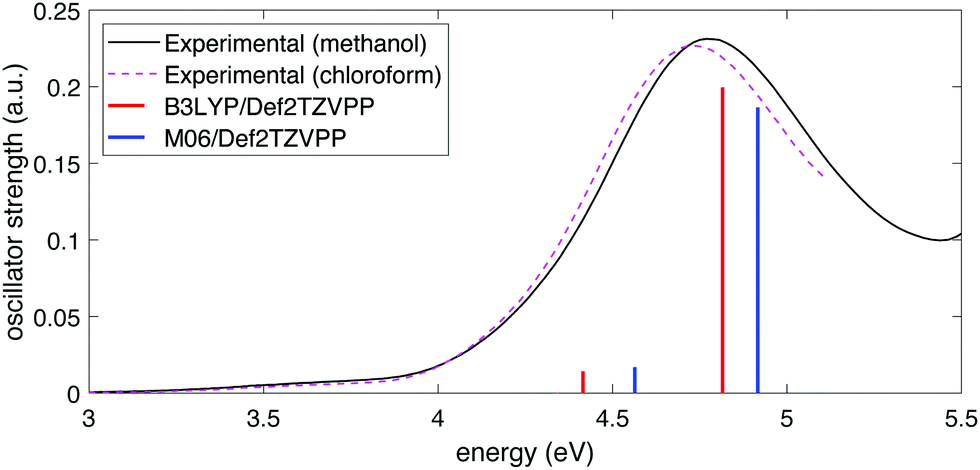 | ||
| Fig. 2 Experimental UV-vis spectra for NB in methanol (black) and chloroform (dashed magenta) and comparison with computed spectra at the B3LYP/Def2TZVPP (red) and M06/Def2TZVPP (blue) levels of theory. | ||
2.2 Experiment
The experimental setups have been described in detail in our previous work.23,29,63,64 Briefly, a commercial Ti:sapphire regenerative amplifier (Astrella, Coherent Inc.) with a center wavelength of 800 nm, energy of 2 mJ, and pulse duration of 30 fs was used to generate pump and probe beams. Appropriate beam blocks and laser safety goggles were used at all times to minimize hazards of laser beam exposure. The pump beam was taken from the output of a commercial optical parametric amplifier (OPA, TOPAS prime) with the wavelength set to 1300 nm. Two probe beamlines were used: (i) 800 nm, taken from a small portion of the laser output split with a beamsplitter before the OPA;23,63 and (ii) 650 nm, taken from a portion of the OPA output that was subsequently split with a beamsplitter and frequency-doubled in a β-barium borate (BBO) crystal.29 The time-delay between the pump and each probe pulse was scanned using independently controlled motorized translation stages (ThorLabs, Inc) on each probe beamline. The energy of each probe pulse was controlled with a variable neutral density filter. Pulse durations measured with frequency-resolved optical gating (FROG) in our previous work23,29 were 18 fs (1300 nm pump) and 25 fs (800 nm and 650 nm probes). The cross-correlation of pump and probe pulses, and therefore the temporal resolution of our experiment, was also measured in a previous work23 and shown to follow a Gaussian shape with FWHM of 26.1 ± 0.2 fs, consistent with the FROG measurements. For both setups, the pump and probe pulses were recombined on dichroic mirrors and directed colinearly through a 20 cm fused silica biconvex lens to focus into an ultrahigh vacuum chamber (base pressure 2 × 10⁻⁹ torr) equipped with a custom built linear time-of-flight mass spectrometer (TOF-MS) described in detail in our previous publications.63,64 Samples of nitrobenzene and 2-, 3-, and 4-nitrotoluene (Sigma Aldrich) were used as received and introduced into the vacuum chamber through a variable leak valve to reach working pressure in the range of 1–3 × 10⁻⁷ torr measured at the MCP detector. Mass spectra were recorded with a 1 GHz digital oscilloscope at a sampling rate of 20 giga samples per second (GS s−1) (LeCroy WaveRunner 610Zi). The reported mass spectra were averaged over 10![[thin space (1/6-em)]](https://www.rsc.org/images/entities/char_2009.gif) 000 laser shots and transient ion signals obtained by averaging 30 pump–probe scans taken in time steps of 10 fs with 1000 laser shots averaged at each time step. The UV-vis spectra of NB at an approximate concentration of 5 × 10⁻⁵ M in methanol and chloroform were measured using a commercial UV-vis spectrophotometer (Agilent 8453).
000 laser shots and transient ion signals obtained by averaging 30 pump–probe scans taken in time steps of 10 fs with 1000 laser shots averaged at each time step. The UV-vis spectra of NB at an approximate concentration of 5 × 10⁻⁵ M in methanol and chloroform were measured using a commercial UV-vis spectrophotometer (Agilent 8453).
3 Results
3.1 Computational results
The B3LYP/Def2TZVPP optimized geometry for neutral NB shifts from a 0° C–C–N–O dihedral angle to a 57.9° angle for the optimized cation, this being the most dramatic geometric change between both structures (Fig. 3). In order to confirm the previous assertion, we performed a quantitative measurement of geometric change between the two structures by means of what can be called modified root-mean-square distance (MRMSD) defined as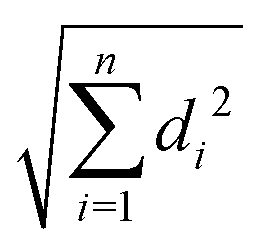 where the set of di values corresponds to the minimized distances between individual atoms in both structures. Using this definition, the MRMSD is 2.62 Å for oxygen atoms and 2.65 Å for all the atoms meaning that most of the geometric changes when going from the neutral to the cationic structure can be accounted for by the movement of the oxygen atoms. For a full list of MRMSD values see Table S2 of the ESI.† Hence, motion along the C–NO2 torsional coordinate is expected to dominate the nuclear dynamics of NB following ionization. This result also suggests that the C–NO2 torsional mode may be coherently excited upon ionization to produce a vibrational wave packet in the C–NO2 torsional mode. The frequency of this mode calculated using the B3LYP functional ranges from 31.8 to 67.6 cm−1, depending on the basis set used, with a value of 53.9 cm−1 for the B3LYP/Def2TZVPP level of theory (ESI,† Table S5). These computationally obtained values are in reasonable agreement with the experimental ion signal oscillations at 80 cm−1 (see Section 3.3). The error between computed and experimental frequencies follows in line with that found in a previous work for same torsional mode in 4-nitrotoluene cation for which computed and experimental frequencies of 46.1 and 85 cm−1 respectively were found.23
 | ||
| Fig. 3 Geometrical structures for neutral and cationic NB optimized at the B3LYP/Def2TZVPP level of theory. Bond lengths are in Å and torsional angles in degrees. | ||
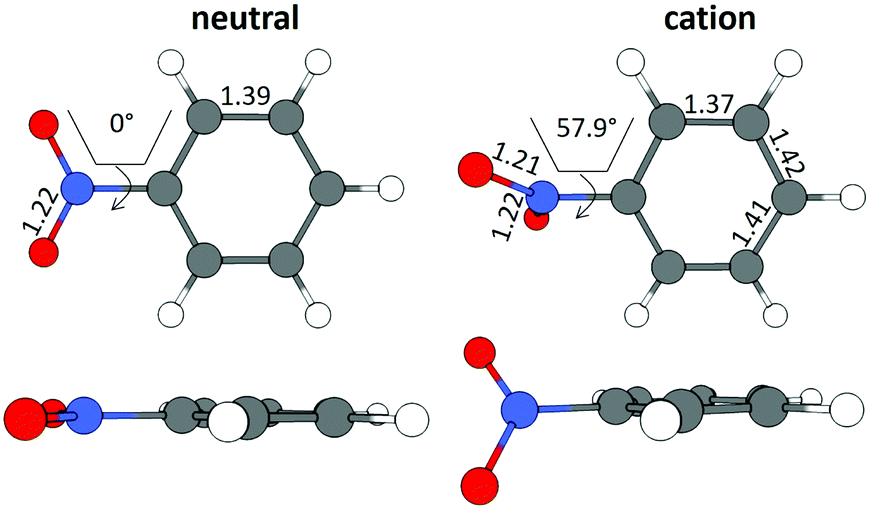
Previous femtosecond mass spectrometry measurements on NB have identified the most prominent ion signal as the C6H5+ fragment, obtained by NO2 loss from the parent NB+ ion.42–45 To determine the energy needed for C6H5+ generation, we performed a relaxed potential energy surface scan for the C–N bond in NB+ using the ModRedundant keyword in Gaussian at the B3LYP/Def2TZVPP level of theory (Fig. 4). The depth of the well obtained from this surface is around 1.58 eV. We estimated the zero point energy (ZPE) by adding the ZPE of the vibrational modes that heavily involve C–N bond stretching (modes 5, 10, 12, 21, 25, 27, 29, and 31, whose corresponding frequencies can be found in Table S5 of the ESI†). The result of this estimation was 0.55 eV (dashed black line in Fig. 4), which is reasonable since the total ZPE calculated by Gaussian, adding the ZPE for the 36 vibrational modes of NB, is 2.72 eV. Taking the ZPE into account it can be estimated that the minimum energy necessary for breaking the C6H5–NO2 bond is 1.03 eV (1.58–0.55 eV), less than the energy corresponding to 800 nm photons (1.55 eV) and very close to the energy of 1300 nm photons (0.95 eV) as can be seen in Fig. 4.
 | ||
| Fig. 4 Potential energy surface corresponding to the C6H5–NO2 bond stretching in NB cation calculated at the B3LYP/Def2TZVPP level of theory. Charges on each fragment are indicated at C–N distances of 1.45 Å and 6.50 Å. The estimation of the ZPE is shown as a dashed black line. The energies for 1300, 800, and 650 nm photons, relative to the ZPE, are shown as dark red, magenta, and orange dashed lines respectively. | ||
The ground and lowest 10 excited electronic potential energy surfaces (PESs) of NB cation along the C–NO2 torsional coordinate were computed to determine potential electronic excitation pathways in NB following ionization (Fig. 5). As seen in Fig. 5a, these PESs are distributed within two groups: the first comprised by D0 to D4 and the second by D5 to D10. It is evident that the D2 through D4 surfaces in the first group have a marked dependence on the dihedral angle, reaching their maximum energy value at 90°, whereas the surfaces within the second group have a less pronounced dependence on the dihedral angle. Fig. 5a also shows the energies corresponding to 1300, 800, and 650 nm photons for comparison (0.95, 1.55, and 1.91 eV respectively). Only the 650 nm photon energy is enough to promote the D0 → Dn, n = 1,…,4 transitions by means of single photon processes at any geometry. Moreover, 650 nm is nearly resonant with the D0 → D4 transition at a dihedral angle of 90°. For 800 nm photons, the D4 surface is out of reach from D0 at most geometries, the D3 surface is accessible at some geometries, and the D2 surface is reachable at any geometry. 1300 nm photons can only reach the D2 through D4 surfaces from D0 at dihedral angles near 0°, i.e., near the neutral NB geometry.
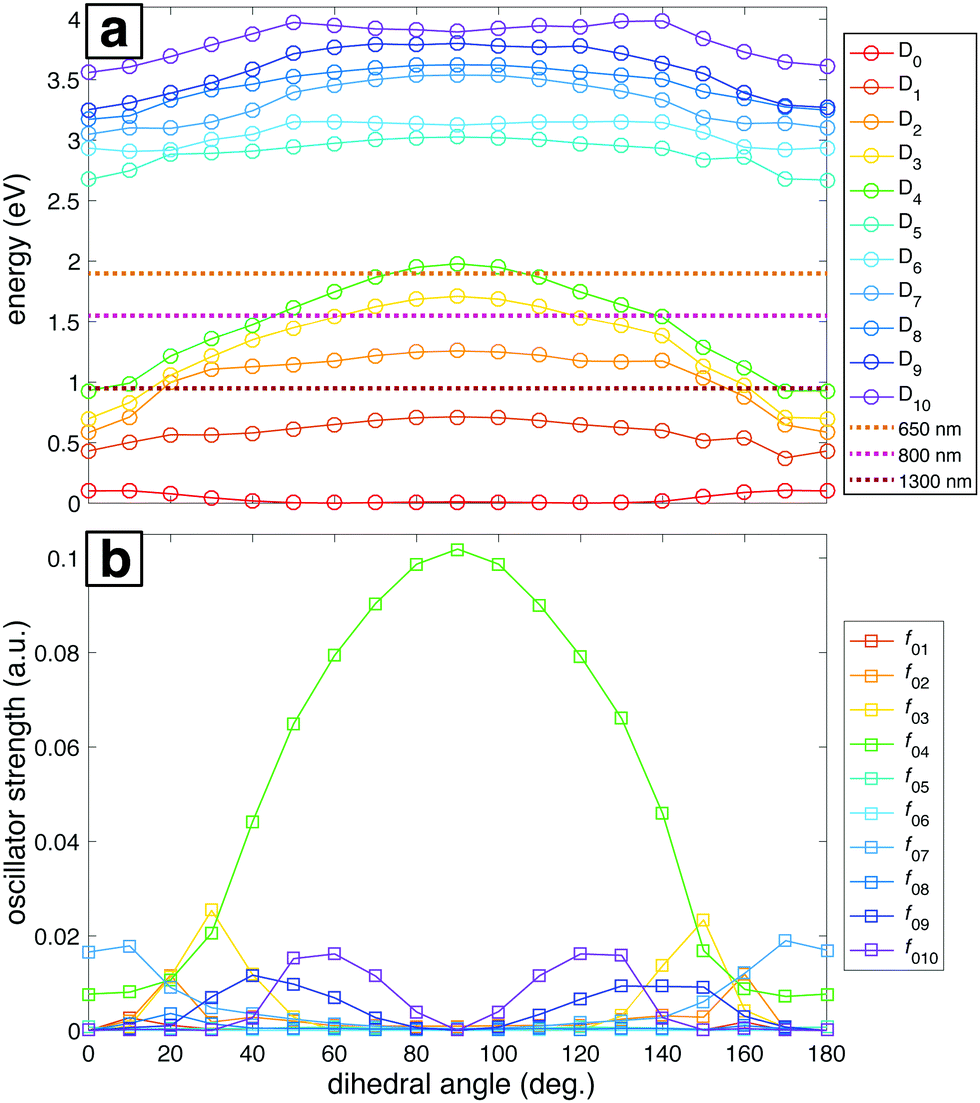 | ||
| Fig. 5 (a) Potential energy surfaces for the ground ionic state D0 and the first ten excited states D1 through D10 as a function of the C–C–N–O dihedral angle. Energies corresponding to 1300, 800 and 650 nm photons are shown for comparison. (b) Oscillator strengths between the ground ionic state D0 and the excited states D1 through D10 as a function of the C–C–N–O dihedral angle. All the calculations were done at the B3LYP/Def2TZVPP level of theory. | ||
The importance of the dihedral angle for excitation probability is captured in the dependence of the oscillator strength on the dihedral angle (Fig. 5b). Some of the oscillator strengths are very close to zero for all values of the dihedral angle, but f02, f03, f04, f07, f09, and f010 have non-negligible values at different geometries. It is noteworthy that the oscillator strength for the D0 → D4 transition (f04) is particularly high and dependent on the geometry, reaching its maximum value at 90°. Moreover, this transition is the only one that has a substantial oscillator strength at 90° (Table 2). In order to benchmark our TDDFT calculations we also performed some computations using EOM-EE-CCSD in combination with the 6-311+G* basis set. The geometries considered were the ones obtained after optimization at the B3LYP/Def2TZVPP level. Table 2 contains the results of these calculations for NB cation with 90° C–NO2 torsional angle. Analogous EOM calculations for the optimized neutral and cation geometries are shown in Table S11 of ESI.† Comparison of results in Table 2 shows that EOM calculations confirm the presence of an excited state with a substantial oscillator strength at 90° dihedral angle and with excitation energy around 2 eV, in line with the TDDFT calculations, and very importantly, with the experimental results to be discussed in the following sections. However, the ordering of the excited states is not in agreement since EOM results point to D3 as the bright state while TDDFT computations point to D4. This situation will be briefly discussed in Section 4.
| Transition | B3LYP/Def2TZVPP | EOM-EE-CCSD/6-311+G* | ||
|---|---|---|---|---|
| EE (eV) | f (a.u.) | EE (eV) | f (a.u.) | |
| D0 → D1 | 0.73 | 0.0000 | 0.81 | 0.0000 |
| D0 → D2 | 1.23 | 0.0010 | 2.00 | 0.0013 |
| D0 → D3 | 1.70 | 0.0000 | 2.34 | 0.1156 |
| D0 → D4 | 1.99 | 0.1039 | 2.49 | 0.0001 |
| D0 → D5 | 3.03 | 0.0000 | 3.70 | 0.0013 |
| D0 → D6 | 3.12 | 0.0000 | ||
| D0 → D7 | 3.54 | 0.0004 | ||
| D0 → D8 | 3.62 | 0.0002 | ||
| D0 → D9 | 3.80 | 0.0000 | ||
| D0 → D10 | 3.89 | 0.0000 | ||
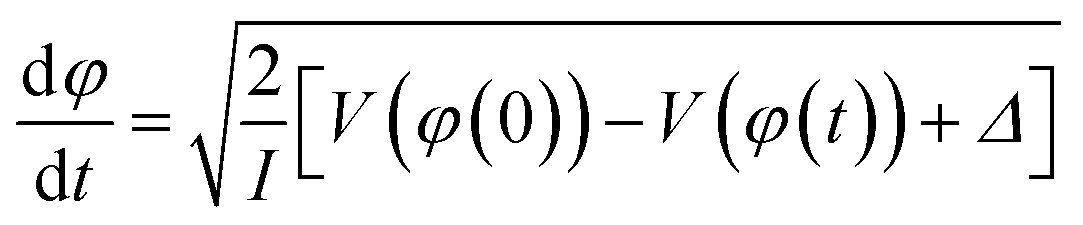
Having a substantial oscillator strength for a transition from D0 to a specific bright state (D3 or D4) at 90° implies that, as the vibrational wave packet propagates along the D0 surface, it will have the highest probability of a one-photon excitation to the excited state surface at that particular dihedral angle. Hence, we can expect that pump–probe measurements using nearly resonant probe photons will most efficiently transfer ground-state NB+ to the bright state surface at pump–probe delays corresponding to the time needed for the wave packet to reach a 90° dihedral angle. To estimate this time we performed classical wave packet trajectory calculations21,65 using the D0 surface computed in fine increments of 2° (red dots, Fig. 6) and fit to a smoothing spline (solid red line, Fig. 6). The evolution of the dihedral angle of the wave packet centroid is determined by the equation of motion65
 | (1) |
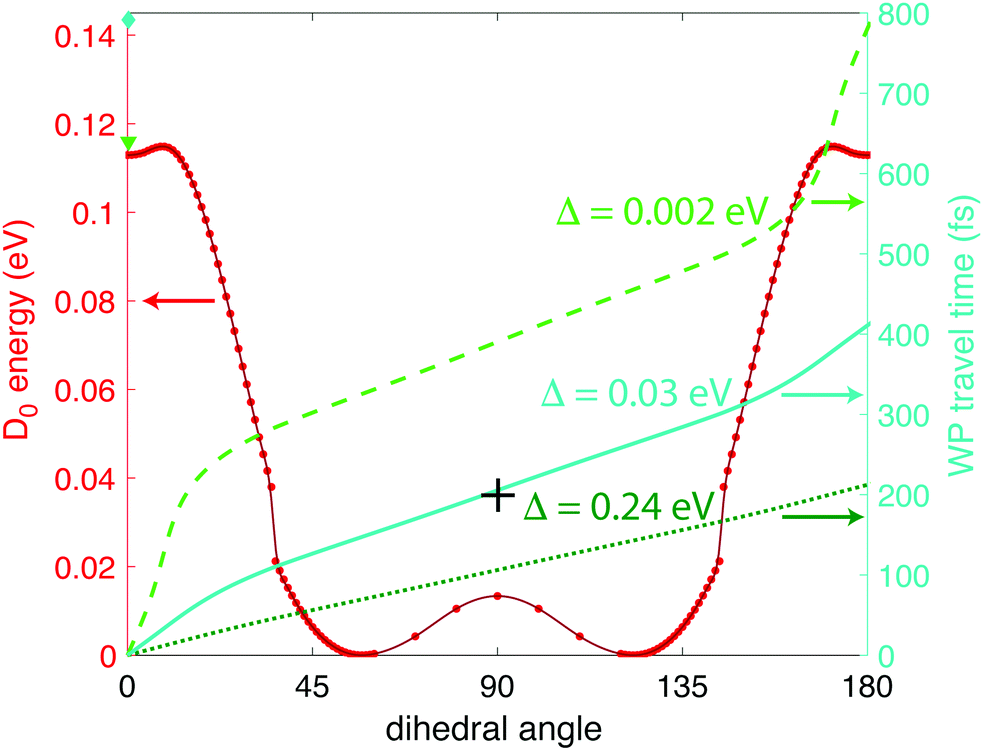 | ||
| Fig. 6 Calculated wave packet trajectories over the D0 PES (red dots and line) using 0 (bright green dashed line), 0.03 (turquoise solid line), and 0.24 eV (dark green dotted line) of excess energy. | ||
From Fig. 6 we can see a local minimum in the D0 surface at 0° dihedral angle; if we consider this surface as periodic, that local minimum constitutes a potential well. Hence, the wave packet will need at least Δ ≥ 0.002 eV excess energy to surpass the barrier at ∼9° dihedral angle. It is reasonable to assume that the source of that energy is some fraction of the excess energy after ionization, i.e., the difference between vertical and adiabatic ionization energies. At the B3LYP/Def2TZVPP level, this excess energy is 0.35 eV (Table 1), giving an upper limit of Δ = 0.24 eV in eqn (1). Fig. 6 shows the wave packet trajectories along the D0 PES (red line) obtained with Δ = 0.002 eV (light green dashed line), Δ = 0.03 eV (turquoise solid line), and Δ = 0.24 eV (dark green dotted line). As expected, the time taken for the wave packet to reach a 90° dihedral angle changes with the value of Δ, with times around 400, 200, and 100 fs for Δ = 0, 0.03, and 0.24 eV, respectively. As will be shown in Section 3.2 below, the pump–probe measurements indicate that the wave packet reaches the 90° torsional angle in ∼200 fs, suggesting a physically plausible value of Δ = 0.03 eV, or 9% of the available relaxation energy, to “kick-start” the wave packet.
3.2 Pump–probe measurements
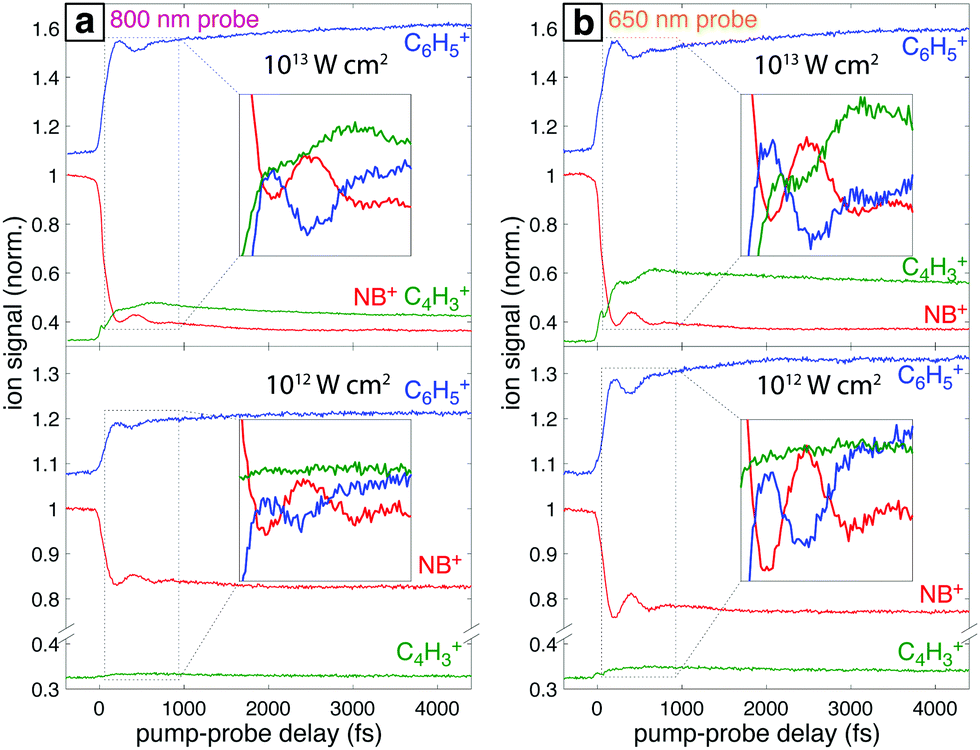
Fig. 7a shows the mass spectra of NB taken with 7 × 10¹³ W cm−2, 1300 nm pump pulses and 1 × 10¹³ W cm−2 probe pulses at 800 nm and 650 nm, with the delay τ between pump and probe pulses set to 4 ps. The bottom spectrum (dark red) obtained using only the 1300 nm ionizing pump pulse exhibits significant yields of parent molecular ion NB+ (m/z 123) and C6H5+ (m/z 77) with little additional fragmentation. Notably, the similar intensity of the parent NB+ and C6H5+ peaks stands in stark contrast to earlier measurements on NB using 800 nm fs excitation for ionization, where the C6H5+ signal was at least an order of magnitude more intense than the NB+ signal.42–44 This result is expected on the basis of the computed PES along the C–N bond coordinate (Fig. 4), which shows that 800 nm photons substantially exceed the energy needed for NO2 loss, whereas 1300 nm photons barely provide sufficient energy. When an 800 nm (middle spectrum, magenta) or 650 nm (top spectrum, orange) probe pulse is present at a 4 ps delay, the relative yield of the parent NB+ ion decreases by ∼60%, while the yields of the C6H5+ and C4H3+ (m/z 51) fragments increase. These changes are further magnified in the difference spectra shown in Fig. 7b. Whereas parent depletion and C6H5+ enhancement are similar for both 800 nm and 650 nm probe photons, the enhancement of C4H3+ is significantly higher using 650 nm photons. While the C6H5+ fragment is clearly the NO2 loss product from the parent ion, the origin of the C4H3+ fragment has not been completely elucidated. Threshold photoelectron–photoion coincidence (TPEPICO) spectroscopy experiments suggest that the C4H3+ fragment can be formed from secondary dissociation of C6H5+.66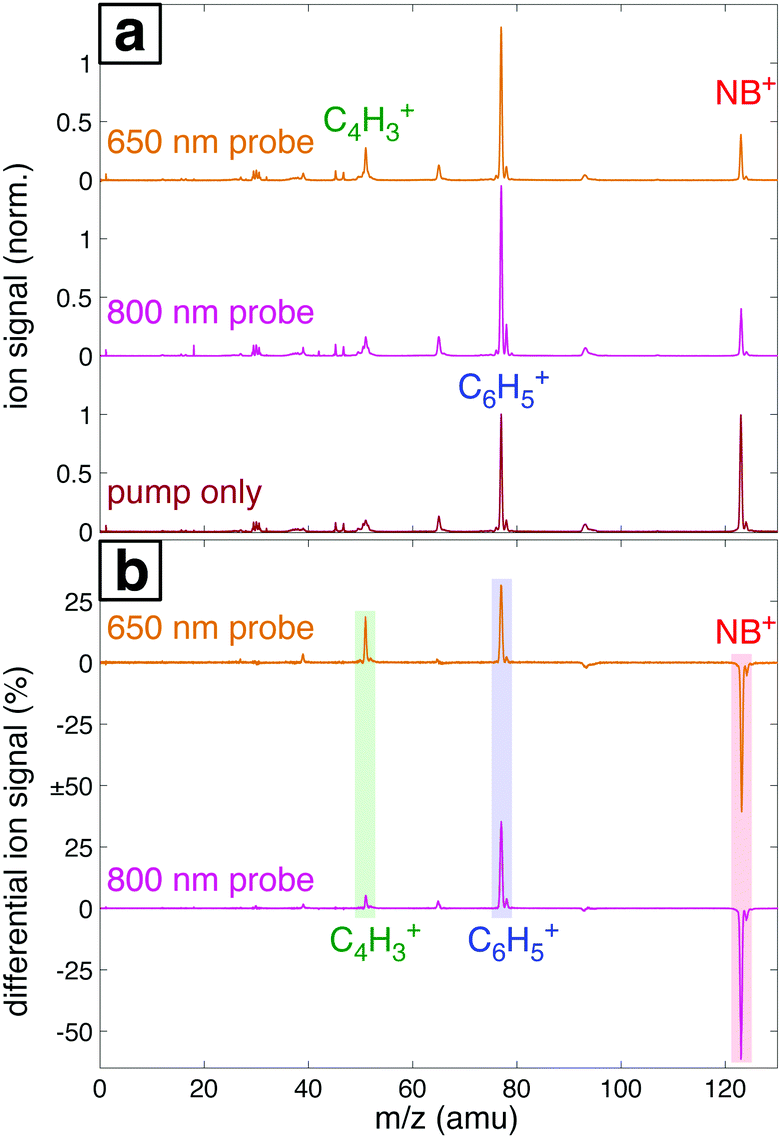 | ||
| Fig. 7 (a) Mass spectra of NB taken with 1300 nm pump only (dark red, bottom), 800 nm probe (magenta, middle), and 650 nm probe (orange, top) at 4 ps delay. (b) Difference mass spectra between the 800 nm and 650 nm probe spectra and pump-only spectrum in (a). The signals for parent ion NB+ (red), C6H5+ (blue), and C4H3+ (green) are highlighted. | ||
Fig. 8 shows the transient signals of the ions highlighted in Fig. 7 as a function of pump–probe delay (τ) using 800 nm (a) and 650 nm (b) probe pulses at intensities 1013 W cm−2 (top) and 1012 W cm−2 (bottom). All transients are normalized to the yield of NB+ at τ < 0. Depletion in NB+ (red) and increase in C6H5+ (blue) signals at τ > 0 are observed under all conditions, with greater magnitude changes for high probe intensity (top panels) due to increased excitation probability. The yield of C4H3+ increases significantly for τ > 0 only at 1013 W cm−2, with greater enhancement for the 650 nm wavelength. The antiphase oscillations in the yields of NB+ and C6H5+ (inset in each panel of Fig. 8), with similar frequency to related aromatic molecules,19–23,29 indicate that electronic excitation of the NB+ vibrational wave packet along the C–NO2 torsional mode (Fig. 3 and 5) results in C6H5+ formation. The greater oscillation amplitude using the 650 nm wavelength, particularly at lower intensity (bottom panels), is consistent with the prediction based on the computed PESs in Fig. 5 that 650 nm photons are more efficient at exciting the NB+ vibrational wave packet.
 | ||
| Fig. 8 Transient ion signals from NB+ obtained with (a) 800 nm and (b) 650 nm probe pulses. Probe intensity is 1013 W cm−2 (top panels) and 1012 W cm−2 (bottom panels). Insets magnify the 70–830 fs range to show the oscillations, curves within the inset have been shifted vertically to show oscillatory behavior more clearly. | ||
3.3 Quantitative analysis of oscillatory dynamics
To quantify the enhancement of oscillation amplitudes observed in the transient signals in Fig. 8 using the 650 nm probe wavelength, nonlinear least squares curve fitting21–26,29 was applied to the signals. The fit equation used for the transient ion signals in Fig. 8 is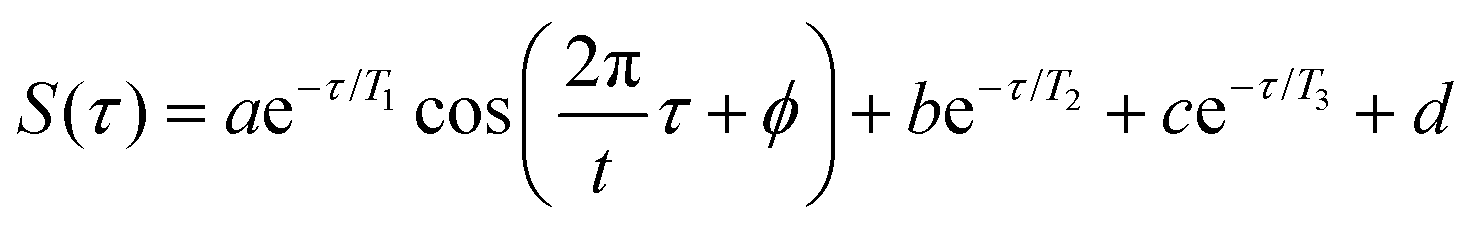 | (2) |
Under all conditions, the parent NB+ ion was fit to the complete eqn (2), C6H5+ fit to eqn (2) without the T3 component, and C4H3+ fit to the complete eqn (2) for 650 nm excitation at 1013 W cm−2 or without the oscillatory T1 component otherwise (ESI,† Tables S12–S15). To compare the oscillatory dynamics observed under the four experimental conditions in Fig. 8, the tabulated a, T1, t, and ϕ coefficients for the parent NB+ ion extracted from curve fitting are reported in Table 3. For all four conditions, the coherence lifetime T1, oscillation period t, and phase ϕ agree to within the reported errors (95% confidence intervals from curve fitting). This result confirms that the same initial wave packet was prepared by the ionizing pump pulse because the parameters T1, t, and ϕ are intrinsic to the wave packet dynamics. In contrast, the a coefficients associated with the oscillation amplitude are greater for 650 nm as compared to 800 nm excitation: the a value of 0.11 ± 0.02 obtained with 650 nm is twice the 0.05 ± 0.01 value obtained with 800 nm at the modest intensity of 1012 W cm−2. This result is consistent with the more prominent oscillations visible in Fig. 8b as compared to Fig. 8a. Greater values of a coefficients for the C6H5+ fragment are also observed with 650 nm probe as compared to 800 nm probe (ESI,† Tables S12–S15).
| Eqn (2) | a | T 1 (fs) | t (fs) | ϕ (rad) |
|---|---|---|---|---|
| 650 nm, I = 1013 | 0.14 ± 0.02 | 239 ± 15 | 430 ± 9 | −0.08 ± 0.09 |
| 650 nm, I = 1012 | 0.11 ± 0.02 | 242 ± 15 | 426 ± 10 | −0.04 ± 0.08 |
| 800 nm, I = 1013 | 0.08 ± 0.01 | 244 ± 24 | 439 ± 15 | −0.13 ± 0.19 |
| 800 nm, I = 1012 | 0.05 ± 0.01 | 225 ± 41 | 426 ± 10 | −0.05 ± 0.21 |
To further illustrate the enhancement of the oscillatory ion signals using 650 nm excitation, the residual oscillatory ion signals obtained after subtraction of the incoherent components (T2 and T3 terms) from eqn (2) are plotted in Fig. 9, left panel. This plot clearly shows the antiphase behavior of the oscillations in NB+ (red) and C6H5+ (blue), as indicated by the dotted lines at the minima of NB+ yield (200 and 630 fs). For 650 nm excitation at 1013 W cm−2, the C4H3+ (green) fragment also exhibits antiphase oscillations with respect to NB+. At both intensities, the larger-amplitude oscillations using 650 nm are apparent in the increased amplitude of the corresponding Fast Fourier Transform (FFT) peak at 80 cm−1 (dashed line) taken from the residual ion signals over the pump–probe delay range of 70–3000 fs (Fig. 9, right panel). In particular, the 80 cm−1 peak intensity for NB+ at 1012 W cm−2 is approximately five times higher for 650 nm as compared to 800 nm excitation. Hence, quantification of the oscillations indicate an amplitude enhancement by a factor of ∼2–5 using 650 nm for excitation as compared to 800 nm, consistent with the theoretical predictions from Fig. 5.
 | ||
| Fig. 9 Residual ion signals (left) and FFT power spectra (right). | ||
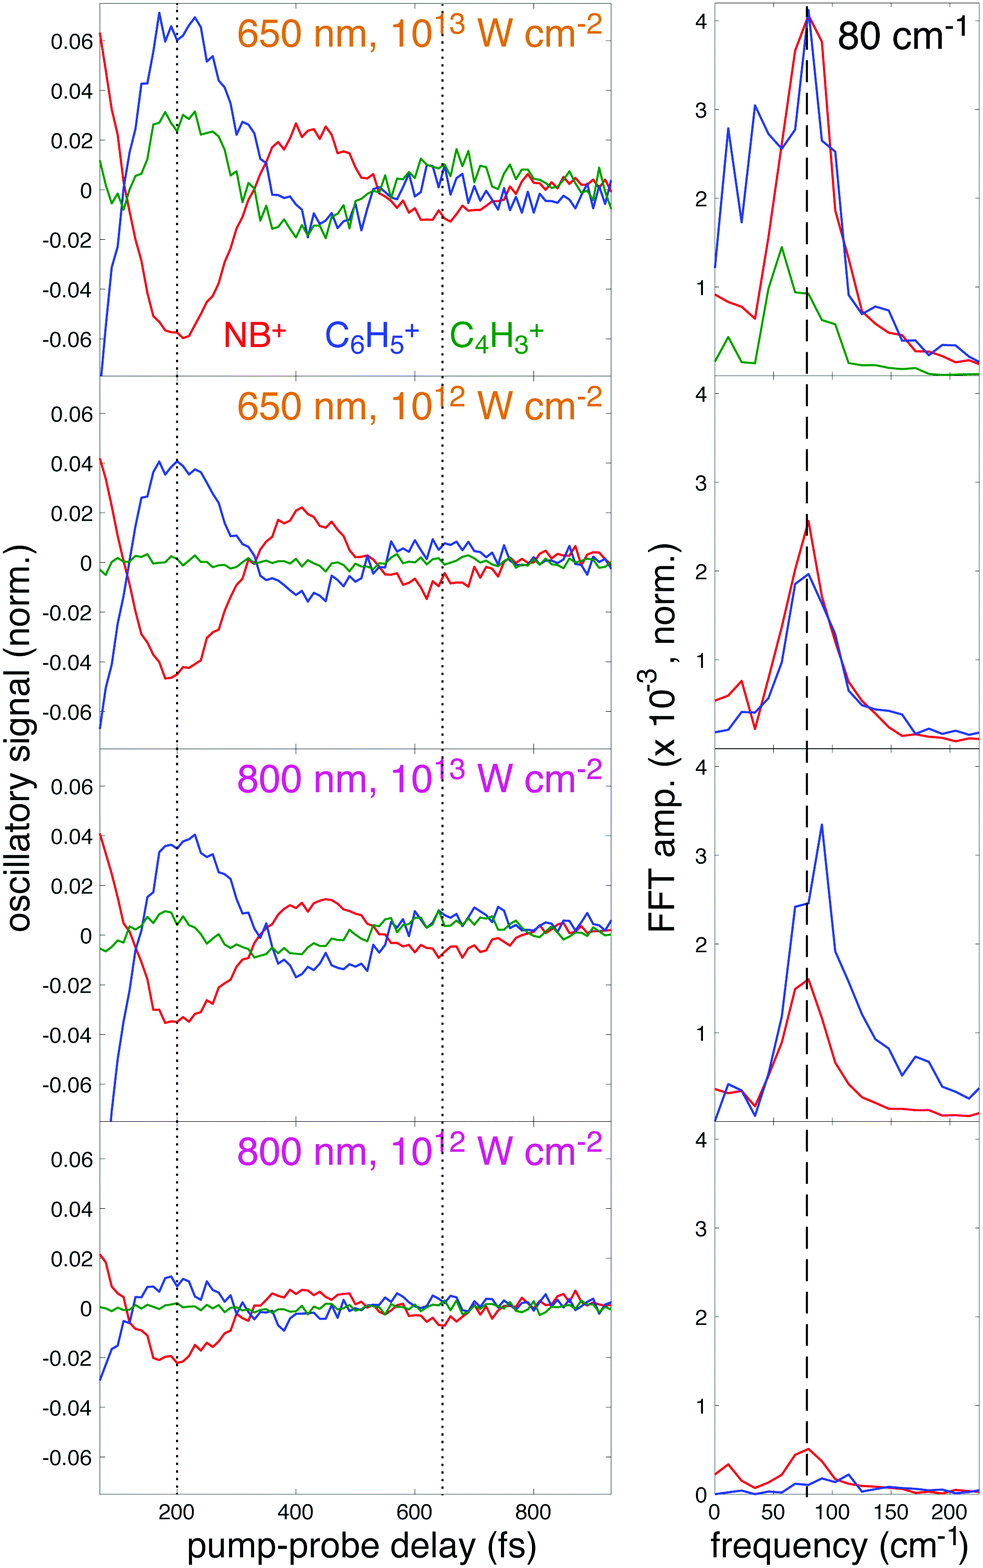
3.4 Comparison of nitrobenzene and nitrotoluenes
In order to further explore the effect of the probe excitation wavelength in the study of radical cation dynamics, we briefly discuss the occurrence of analogous behaviors in the closely related nitrotoluenes (NTs). Fig. 10 shows the transient ion signals for the parent ions M+ and the NO2 loss products for 4-NT, 3-NT, and 2-NT as well as nitrobenzene for comparison. Measurements were taken with 7 × 10¹³ W cm−2, 1300 nm pump pulses and 1 × 10¹² W cm−2 probe pulses at 800 nm and 650 nm for all the molecules except for 3-NT, for which probe pulses of 6 × 10¹² W cm−2 were used. Among these four molecules, NB stands out in that the [M–NO2]+ fragment has a higher yield than the parent ion M+ at negative delay, which is attributed to NB having the lowest C–N bond dissociation energy (BDE) as indicated in Fig. 10. Although the BDE in 2-NT is similar (1.56 eV in NB vs. 1.58 eV in 2-NT), the 2-NT can undergo additional fragmentation pathways that compete with C–N cleavage,29 as shown in the mass spectra in the ESI,† Fig. S5. Nevertheless, all these systems with the exception of 3-NT show a similar enhancement of the oscillatory dynamics with 650 nm excitation as compared with 800 nm. We note that the lack of enhanced [M–NO2]+ yield in 2-NT can also be attributed to competition with other fragmentation pathways. Our previous finding that the optimized 2-NT cation has an excited state nearly resonant with 650 nm using TDDFT calculations at the ωB97XD/CBSB7 and CAM-B3LYP/CBSB7 levels29 further supports the main hypothesis explored in this work that computations can predict the best excitation wavelength. On the basis of these results, we can predict the existence of a resonant transition at 650 nm for 4-NT and the absence of such a resonance for 3-NT, which may be expected because 3-NT does not undergo torsional wave packet motion upon ionization.23 We note that the common behavior of NB, 2-NT, and 4-NT cations with regards to torsional wave packet motion and accessible electronic transitions is similar to previous studies of acetophenone21,22 and its methyl-substituted derivatives:19,20 acetophenone, 2-methylacetophenone, and 4-methylacetophenone undergo torsional wave packet motion that can be excited with an 800 nm probe, whereas 3-methylacetophenone does not. | ||
| Fig. 10 Transient ion signals of parent ions M+ (red and orange) and [M–NO2]+ (dark and light blue) for NB (a), 4-NT (b), 2-NT (c), and 3-NT (d). Bond dissociation energies (BDE) of the C–N bond calculated at the B3LYP/Def2TZVPP level for these four radical cations are also shown. | ||
4 Discussion
It is common practice in time-resolved studies of radical cations to probe with the readily available 800 nm wavelength.16–27 In this work we want to address whether theoretical computations can predict a more suitable wavelength for probing vibrational wave packet dynamics in radical cations. Indeed, the enhancement of wave packet oscillation amplitudes in NB cation at modest probe pulse intensity (1012 W cm−2) using 650 nm as compared to 800 nm for excitation validates the computational results showing a geometry-dependent excitation probability from the D0 to D4 surface and resonance of the 650 nm excitation wavelength. These results will be further discussed in this section.Both the 650 and 800 nm excitation wavelengths are capable of increasing the C6H5+ signal at the expense of the parent ion signal (Fig. 7), even though only the 650 nm probe is capable of promoting the D0 → D4 transition for any geometry according to our TDDFT calculations (Fig. 5a). This result is consistent with previous mass spectrometry studies using only one 800 nm pulse for ionization that show substantial C6H5+ ion signal and little parent ion,42–44 and suggests that ionization of NB at 800 nm can populate one or more electronic excited states of the cation. Because the 800 nm wavelength can access the D2 excited state at all geometries, excitation to D2 is likely sufficient to produce NO2 loss, at least at geometries where its energy is above the estimated dissociation threshold of 1.03 eV (Fig. 4). We cannot rule out the contribution of the D3 excited state to the dissociative event because 800 nm excitation is also able to promote the D0 → D3 transition for some geometries. The participation of the D0 → D1 transition can be excluded due to the negligible values of f01 (Fig. 5b) and more importantly because the energy of the D1 excited state at any geometry lies below the minimum energy to break the C–N bond. Hence, the key difference between 800 nm and 650 nm excitation is that only 650 nm gives full accessibility to the D4 surface, for which the coupling strength to D0 has a strong geometric dependence. This circumstance explains the enhanced oscillatory behavior for 650 nm excitation (Fig. 8 and 9).
The observation that the 650 nm excitation is more efficient at generating the C4H3+ fragment as compared to the 800 nm excitation (Fig. 7b) suggests that the excited state(s) involved should be at the reach of the 650 nm wavelength to a greater extent than for 800 nm. In addition, the finding of substantially enhanced C4H3+ yield at high probe intensity (1013 W cm−2, top panels of Fig. 8) as compared to modest probe intensity (1012 W cm−2, bottom panels of Fig. 8) supports the idea that the excited state(s) responsible for C4H3+ formation can only be reached by means of a two-photon process. These facts suggest that the two photon process(es) involved in the C4H3+ fragment production are more efficient for the 650 nm probe as compared to the 800 nm. Moreover, we can postulate the existence of a two-photon resonant process achievable only with the 650 nm excitation. After eliminating the incoherent part from the C4H3+ transient, the oscillatory nature of the transient is only observed with 650 nm probe, whereas the transient for the 800 nm probe only shows a feeble oscillatory behavior (Fig. 9). Because the D5 and D6 PESs do not depend on the dihedral angle while the D7 to D10 PESs show a modest dependence (Fig. 5a), we can postulate that the excited state(s) involved in the two photon process generating C4H3+ lie(s) between D7 and D10. These states span an excitation energy range from 3.54 to 3.89 eV (Table 2), which can be reached with two 650 nm photons (3.82 eV). The dependence on geometry for the D7 to D10 PESs could be associated with the oscillatory behavior observed for the 650 nm probe. On the other hand, the energy corresponding to two 800 nm photons (3.10 eV) cannot reach the D7 and higher states. As a last observation we want to point out that the residual ion signal for C4H3+ shows antiphase coupling between NB+ and C4H3+ (Fig. 9), suggesting that the C4H3+ fragment originates from the D0 surface of the parent ion. This result suggests that two-photon excitation of NB+ provides sufficient energy to further fragment initially formed C6H5+ into C4H3+, as observed in TPEPICO studies.66
Collectively, the results of this work both illustrate how quantum chemical computations can predict the outcome of pump–probe measurements on radical cations and highlight similarities in the observed dynamics, and thereby the similar electronic structures, of homologous radical cations. Hence, this work builds on previous studies wherein computed electronic PESs of cations including bromoiodomethane,17,18 acetophenone,21,22 and azobenzene27 are used to explain transient oscillatory dynamics of ion signals observed in pump–probe measurements. Moreover, this work demonstrates that computations of electronic PESs, even using the inexpensive TDDFT method, provide sufficiently accurate results to predict the best probe excitation wavelength in pump–probe measurements of nitrobenzene and closely related nitroaromatic compounds to maximize the visibility of vibrational wave packet dynamics. However, as the comparison of TDDFT and EOM results in Table 2 showed, our inexpensive TDDFT approach is not free of problems: TDDFT appears to misidentify the bright state as D4 instead of D3 and predicts excitation energy lower by 0.35 eV. Previous works have pointed out deficiencies on the TDDFT description of low-lying singlet excited states of various classes of molecules including polyacenes,67,68 thiophene and short thienoacenes,69 fused heteroaromatic rings,70 and naphthol isomers.71 Further work should be carried out to fully elucidate the nature of the excited states of related nitroaromatic radical cations and to rationalize and possibly mitigate the drawbacks of their TDDFT description. It is important to emphasize that any extension of this TDDFT approach to different groups of molecules should be carefully evaluated with the aid of higher level methodologies.
Additionally, our results complement previous studies showing that selection of near-infrared wavelengths for the ionizing pump also enhances the visibility of oscillatory ion dynamics by more selectively populating the ground electronic state of the cation.21,25 Finally, our results provide further evidence that similar coherent vibrational dynamics in radical cations are to be expected for families of homologous molecules.17,20,26 In particular, the ortho/para directing nature of the nitro group is confirmed in our pump–probe measurements due to the completely different dynamics of 3-NT as compared to NB, 2-NT, and 4-NT (Fig. 10).
5 Conclusions
We have demonstrated that TDDFT computations of electronic potential energy surfaces in the nitrobenzene radical cation can be used to predict the best choice of the probe wavelength in femtosecond time-resolved mass spectrometry measurements. EOM-CCSD computations confirmed that a strongly coupled electronic transition out of D0 is both resonant with 650 nm excitation and has a geometry-dependent oscillator strength, with strongest coupling at a C–C–N–O dihedral angle of 90°. This result predicted the substantial enhancement by a factor of ∼2–5 in the ion yield oscillations observed in nitrobenzene cation as a function of pump–probe delay. The analogous behavior observed in the related molecules 2- and 4-nitrotoluene highlights that similar vibrational dynamics are to be expected in pump–probe measurements on homologous molecules. Collectively, our results point to the importance of rationally selecting the probe wavelength for time-resolved measurements of prepared vibrational coherent states on the basis of theoretical results. This knowledge can benefit design of coherent control schemes and quantum information applications.Conflicts of interest
There are no conflicts to declare.Acknowledgements
The authors acknowledge the support of the U.S. Army Research Office through Contract W911NF-19-1-0099. DAB acknowledges generous financial support from an Altria Graduate Research Fellowship. High Performance Computing resources provided by the High Performance Research Computing (HPRC) Core Facility at Virginia Commonwealth University (https://chipc.vcu.edu) were used for conducting portions of the research reported in this work.References
- E. J. Reed, J. Phys. Chem. C, 2012, 116, 2205–2211 CrossRef CAS.
- M. D. Sevilla, D. Becker, A. Kumar and A. Adhikary, Radiat. Phys. Chem., 2016, 128, 60–74 CrossRef CAS PubMed.
- T. P. Snow, V. Le Page, Y. Keheyan and V. M. Bierbaum, Nature, 1998, 391, 259–260 CrossRef CAS PubMed.
- K. Ledingham and R. Singhal, Int. J. Mass Spectrom. Ion Processes, 1997, 163, 149–168 CrossRef CAS.
- M. Lezius, V. Blanchet, D. M. Rayner, D. M. Villeneuve, A. Stolow and M. Y. Ivanov, Phys. Rev. Lett., 2001, 86, 51–54 CrossRef CAS PubMed.
- M. Lezius, V. Blanchet, M. Y. Ivanov and A. Stolow, J. Chem. Phys., 2002, 117, 1575–1588 CrossRef CAS.
- T. Yatsuhashi and N. Nakashima, J. Phys. Chem. A, 2005, 109, 9414–9418 CrossRef CAS PubMed.
- T. Bohinski, K. M. Tibbetts, M. Tarazkar, D. Romanov, S. Matsika and R. J. Levis, J. Phys. Chem. Lett., 2013, 4, 1587–1591 CrossRef CAS PubMed.
- T. Bohinski, K. M. Tibbetts, M. Tarazkar, D. Romanov, S. Matsika and R. Levis, J. Phys. Chem. A, 2013, 117, 12374–12381 CrossRef CAS PubMed.
- T. Bohinski, K. M. Tibbetts, K. Munkerup, M. Tarazkar, D. A. Romanov, S. Matsika and R. J. Levis, Chem. Phys., 2014, 442, 81–85 CrossRef CAS.
- K. M. Tibbetts, T. Bohinski, K. Munkerup, M. Tarazkar and R. Levis, J. Phys. Chem. A, 2014, 118, 8170–8176 CrossRef CAS PubMed.
- R. Itakura, J. Watanabe, A. Hishikawa and K. Yamanouchi, J. Chem. Phys., 2001, 114, 5598–5606 CrossRef CAS.
- H. Harada, S. Shimizu, T. Yatsuhashi, S. Sakabe, Y. Izawa and N. Nakashima, Chem. Phys. Lett., 2001, 342, 563–570 CrossRef CAS.
- S. A. Trushin, W. Fuß and W. E. Schmid, J. Phys. B: At. Opt. Mol. Phys., 2004, 37, 3987–4011 CrossRef CAS.
- D. Wu, Q. Wang, X. Cheng, M. Jin, X. Li, Z. Hu and D. Ding, J. Phys. Chem. A, 2007, 111, 9494–9498 CrossRef CAS PubMed.
- B. Pearson, S. Nichols and T. Weinacht, J. Chem. Phys., 2007, 127, 131101 CrossRef PubMed.
- S. Nichols, T. Weinacht, T. Rozgonyi and B. Pearson, Phys. Rev. A: At., Mol., Opt. Phys., 2009, 79, 043407 CrossRef.
- J. Gonzalez-Vazquez, L. Gonzalez, S. R. Nichols, T. C. Weinacht and T. Rozgonyi, Phys. Chem. Chem. Phys., 2010, 12, 14203–14216 RSC.
- X. Zhu, V. V. Lozovoy, J. D. Shah and M. Dantus, J. Phys. Chem. A, 2011, 115, 1305–1312 CrossRef CAS PubMed.
- A. Konar, Y. Shu, V. V. Lozovoy, J. E. Jackson, B. G. Levine and M. Dantus, J. Phys. Chem. A, 2014, 118, 11433–11450 CrossRef CAS PubMed.
- T. Bohinski, K. M. Tibbetts, M. Tarazkar, D. A. Romanov, S. Matsika and R. J. Levis, J. Phys. Chem. Lett., 2014, 5, 4305–4309 CrossRef CAS PubMed.
- K. M. Tibbetts, M. Tarazkar, T. Bohinski, D. A. Romanov, S. Matsika and R. J. Levis, J. Phys. B: At. Opt. Mol. Phys., 2015, 48, 164002 CrossRef.
- D. Ampadu Boateng, G. L. Gutsev, P. Jena and K. M. Tibbetts, J. Chem. Phys., 2018, 148, 134305 CrossRef PubMed.
- K. M. Tibbetts, Chem. – Eur. J., 2019, 25, 8431–8439 CrossRef PubMed.
- D. Ampadu Boateng, G. L. Gutsev, P. Jena and K. M. Tibbetts, Phys. Chem. Chem. Phys., 2018, 20, 4636–4640 RSC.
- D. Ampadu Boateng, M. D. Word and K. M. Tibbetts, Molecules, 2019, 24, 509 CrossRef PubMed.
- K. Munkerup, D. Romanov, T. Bohinski, A. B. Stephansen, R. J. Levis and T. I. Sølling, J. Phys. Chem. A, 2017, 121, 8642–8651 CrossRef CAS PubMed.
- J.-W. Ho, W.-K. Chen and P.-Y. Cheng, J. Chem. Phys., 2009, 131, 134308 CrossRef PubMed.
- D. Ampadu Boateng, M. D. Word, L. G. Gutsev, P. Jena and K. M. Tibbetts, J. Phys. Chem. A, 2019, 123, 1140–1152 CrossRef CAS PubMed.
- R. Y. Brogaard, K. B. Møller and T. I. Sølling, J. Phys. Chem. A, 2011, 115, 12120–12125 CrossRef CAS PubMed.
- W. Zuo, H. Yin, X. Liu, H. Lv, L. Zhao, Y. Shi, B. Yan, M. Jin, D. Ding and H. Xu, Chem. Phys. Lett., 2016, 654, 18–22 CrossRef CAS.
- L. Zhou, Y. Liu, T. Sun, S. Feng, H. Lv and H. Xu, J. Phys. Chem. A, 2019, 123, 8365–8369 CrossRef CAS PubMed.
- C.-C. Shen, T.-T. Tsai, J.-W. Ho, Y.-W. Chen and P.-Y. Cheng, J. Chem. Phys., 2014, 141, 171103 CrossRef PubMed.
- C.-C. Shen, T.-T. Tsai, J.-Y. Wu, J.-W. Ho, Y.-W. Chen and P.-Y. Cheng, J. Chem. Phys., 2017, 147, 164302 CrossRef PubMed.
- J.-Y. Wu and P.-Y. Cheng, J. Phys. Chem. A, 2019, 123, 10700–10713 CrossRef CAS PubMed.
- H. Studzinski, S. Zhang, Y. Wang and F. Temps, J. Chem. Phys., 2008, 128, 164314 CrossRef PubMed.
- S. Trushin, K. Kosma, W. Fuß and W. Schmid, Chem. Phys., 2008, 347, 309–323 CrossRef CAS.
- K. Kosma, S. A. Trushin, W. Fuß, W. E. Schmid and B. M. R. Schneider, Phys. Chem. Chem. Phys., 2010, 12, 13197–13214 RSC.
- R. Montero, Á. P. Conde, V. Ovejas, M. Fernández-Fernández, F. Castaño and A. Longarte, J. Phys. Chem. A, 2012, 116, 10752–10758 CrossRef CAS PubMed.
- R. Montero, Á. Peralta Conde, V. Ovejas, M. Fernández-Fernández, F. Castaño, J. R. Vázquez de Aldana and A. Longarte, J. Chem. Phys., 2012, 137, 064317 CrossRef PubMed.
- J. A. Green, D. V. Makhov, N. C. Cole-Filipiak, C. Symonds, V. G. Stavros and D. V. Shalashilin, Phys. Chem. Chem. Phys., 2019, 21, 3832–3841 RSC.
- A. D. Tasker, L. Robson, K. W. D. Ledingham, T. McCanny, S. M. Hankin, P. McKenna, C. Kosmidis, D. A. Jaroszynski and D. R. Jones, J. Phys. Chem. A, 2002, 106, 4005–4013 CrossRef CAS.
- C. Mullen, M. J. Coggiola and H. Oser, J. Am. Soc. Mass Spectrom., 2009, 20, 419–429 CrossRef CAS PubMed.
- T. D. Scarborough, C. J. McAcy, J. Beck and C. J. G. J. Uiterwaal, Phys. Chem. Chem. Phys., 2019, 21, 6553–6558 RSC.
- C. Kosmidis, K. W. D. Ledingham, H. S. Kilic, T. McCanny, R. P. Singhal, A. J. Langley and W. Shaikh, J. Phys. Chem. A, 1997, 101, 2264–2270 CrossRef CAS.
- M. J. Frisch, G. W. Trucks, H. B. Schlegel, G. E. Scuseria, M. A. Robb, J. R. Cheeseman, G. Scalmani, V. Barone, G. A. Petersson, H. Nakatsuji, X. Li, M. Caricato, A. V. Marenich, J. Bloino, B. G. Janesko, R. Gomperts, B. Mennucci, H. P. Hratchian, J. V. Ortiz, A. F. Izmaylov, J. L. Sonnenberg, D. Williams-Young, F. Ding, F. Lipparini, F. Egidi, J. Goings, B. Peng, A. Petrone, T. Henderson, D. Ranasinghe, V. G. Zakrzewski, J. Gao, N. Rega, G. Zheng, W. Liang, M. Hada, M. Ehara, K. Toyota, R. Fukuda, J. Hasegawa, M. Ishida, T. Nakajima, Y. Honda, O. Kitao, H. Nakai, T. Vreven, K. Throssell, J. A. Montgomery, Jr., J. E. Peralta, F. Ogliaro, M. J. Bearpark, J. J. Heyd, E. N. Brothers, K. N. Kudin, V. N. Staroverov, T. A. Keith, R. Kobayashi, J. Normand, K. Raghavachari, A. P. Rendell, J. C. Burant, S. S. Iyengar, J. Tomasi, M. Cossi, J. M. Millam, M. Klene, C. Adamo, R. Cammi, J. W. Ochterski, R. L. Martin, K. Morokuma, O. Farkas, J. B. Foresman and D. J. Fox, Gaussian 16 Revision C.01, Gaussian Inc., Wallingford, CT, 2016 Search PubMed.
- K. Burke, J. P. Perdew and Y. Wang, Electronic Density Functional Theory: Recent Progress and New Directions, Springer, US, New York, 1998, pp. 81–111 Search PubMed.
- R. Krishnan, J. S. Binkley, R. Seeger and J. A. Pople, J. Chem. Phys., 1980, 72, 650–654 CrossRef CAS.
- A. D. Becke, J. Chem. Phys., 1993, 98, 5648–5652 CrossRef CAS.
- C. Lee, W. Yang and R. G. Parr, Phys. Rev. B: Condens. Matter Mater. Phys., 1988, 37, 785–789 CrossRef CAS PubMed.
- Y. Zhao, Y. Zhao, D. G. Truhlar and D. G. Truhlar, Theor. Chem. Acc., 2008, 120, 215–241 Search PubMed.
- T. Yanai, D. P. Tew and N. C. Handy, Chem. Phys. Lett., 2004, 393, 51–57 CrossRef CAS.
- J.-D. Chai and M. Head-Gordon, Phys. Chem. Chem. Phys., 2008, 10, 6615–6620 RSC.
- J. A. Montgomery, M. J. Frisch, J. W. Ochterski and G. A. Petersson, J. Chem. Phys., 1999, 110, 2822–2827 CrossRef CAS.
- T. H. Dunning, J. Chem. Phys., 1989, 90, 1007–1023 CrossRef CAS.
- F. Weigend and R. Ahlrichs, Phys. Chem. Chem. Phys., 2005, 7, 3297–3305 RSC.
- F. W. McLafferty, P. F. Bente, R. Kornfeld, S.-C. Tsai and I. Howe, J. Am. Chem. Soc., 1973, 95, 2120–2129 CrossRef CAS.
- J. W. Rabalais, J. Chem. Phys., 1972, 57, 960–967 CrossRef CAS.
- A. I. Krylov, Annu. Rev. Phys. Chem., 2008, 59, 433–462 CrossRef CAS PubMed.
- Y. Shao, Z. Gan, E. Epifanovsky, A. T. Gilbert, M. Wormit, J. Kussmann, A. W. Lange, A. Behn, J. Deng, X. Feng, D. Ghosh, M. Goldey, P. R. Horn, L. D. Jacobson, I. Kaliman, R. Z. Khaliullin, T. Kuś, A. Landau, J. Liu, E. I. Proynov, Y. M. Rhee, R. M. Richard, M. A. Rohrdanz, R. P. Steele, E. J. Sundstrom, H. L. W. III, P. M. Zimmerman, D. Zuev, B. Albrecht, E. Alguire, B. Austin, G. J. O. Beran, Y. A. Bernard, E. Berquist, K. Brandhorst, K. B. Bravaya, S. T. Brown, D. Casanova, C.-M. Chang, Y. Chen, S. H. Chien, K. D. Closser, D. L. Crittenden, M. Diedenhofen, R. A. D. Jr., H. Do, A. D. Dutoi, R. G. Edgar, S. Fatehi, L. Fusti-Molnar, A. Ghysels, A. Golubeva-Zadorozhnaya, J. Gomes, M. W. Hanson-Heine, P. H. Harbach, A. W. Hauser, E. G. Hohenstein, Z. C. Holden, T.-C. Jagau, H. Ji, B. Kaduk, K. Khistyaev, J. Kim, J. Kim, R. A. King, P. Klunzinger, D. Kosenkov, T. Kowalczyk, C. M. Krauter, K. U. Lao, A. D. Laurent, K. V. Lawler, S. V. Levchenko, C. Y. Lin, F. Liu, E. Livshits, R. C. Lochan, A. Luenser, P. Manohar, S. F. Manzer, S.-P. Mao, N. Mardirossian, A. V. Marenich, S. A. Maurer, N. J. Mayhall, E. Neuscamman, C. M. Oana, R. Olivares-Amaya, D. P. O'Neill, J. A. Parkhill, T. M. Perrine, R. Peverati, A. Prociuk, D. R. Rehn, E. Rosta, N. J. Russ, S. M. Sharada, S. Sharma, D. W. Small, A. Sodt, T. Stein, D. Stück, Y.-C. Su, A. J. Thom, T. Tsuchimochi, V. Vanovschi, L. Vogt, O. Vydrov, T. Wang, M. A. Watson, J. Wenzel, A. White, C. F. Williams, J. Yang, S. Yeganeh, S. R. Yost, Z.-Q. You, I. Y. Zhang, X. Zhang, Y. Zhao, B. R. Brooks, G. K. Chan, D. M. Chipman, C. J. Cramer, W. A. G. III, M. S. Gordon, W. J. Hehre, A. Klamt, H. F. S. III, M. W. Schmidt, C. D. Sherrill, D. G. Truhlar, A. Warshel, X. Xu, A. Aspuru-Guzik, R. Baer, A. T. Bell, N. A. Besley, J.-D. Chai, A. Dreuw, B. D. Dunietz, T. R. Furlani, S. R. Gwaltney, C.-P. Hsu, Y. Jung, J. Kong, D. S. Lambrecht, W. Liang, C. Ochsenfeld, V. A. Rassolov, L. V. Slipchenko, J. E. Subotnik, T. V. Voorhis, J. M. Herbert, A. I. Krylov, P. M. Gill and M. Head-Gordon, Mol. Phys., 2015, 113, 184–215 CrossRef CAS.
- http://webbook.nist.gov/chemistry/, last checked 7/17/20.
- R. Bauernschmitt and R. Ahlrichs, Chem. Phys. Lett., 1996, 256, 454–464 CrossRef CAS.
- D. Ampadu Boateng and K. M. Tibbetts, JoVE, 2018, 138, e58263 Search PubMed.
- G. L. Gutsev, D. Ampadu Boateng, P. Jena and K. M. Tibbetts, J. Phys. Chem. A, 2017, 121, 8414–8424 CrossRef CAS PubMed.
- T. S. Rose, M. J. Rosker and A. H. Zewail, J. Chem. Phys., 1989, 91, 7415–7436 CrossRef CAS.
- T. Nishimura, P. R. Das and G. G. Meisels, J. Chem. Phys., 1986, 84, 6190–6199 CrossRef CAS.
- S. Grimme and M. Parac, ChemPhysChem, 2003, 4, 292–295 CrossRef CAS PubMed.
- K. Lopata, R. Reslan, M. Kowalska, D. Neuhauser, N. Govind and K. Kowalski, J. Chem. Theory Comput., 2011, 7, 3686–3693 CrossRef CAS PubMed.
- A. Prlj, B. F. E. Curchod, A. Fabrizio, L. Floryan and C. Corminboeuf, J. Phys. Chem. Lett., 2015, 6, 13–21 CrossRef CAS PubMed.
- A. Prlj, M. E. Sandoval-Salinas, D. Casanova, D. Jacquemin and C. Corminboeuf, J. Chem. Theory Comput., 2016, 12, 2652–2660 CrossRef CAS PubMed.
- A. Acharya, S. Chaudhuri and V. S. Batista, J. Chem. Theory Comput., 2018, 14, 867–876 CrossRef CAS PubMed.
Footnote |
| † Electronic supplementary information (ESI) available: Supplemental figures of theory benchmarking and experimental curve fitting; tabulated theoretical results and curve fitting coefficients. See DOI: 10.1039/d1cp00360g |
| This journal is © the Owner Societies 2021 |