
 Open Access Article
 This Open Access Article is licensed under a
 Creative Commons Attribution 3.0 Unported Licence
Predicting OH stretching fundamental wavenumbers of alcohols for conformational assignment: different correction patterns for density functional and wave-function-based methods†
Robert
Medel
 * and
Martin A.
Suhm
* and
Martin A.
Suhm
Institute of Physical Chemistry, University of Goettingen, Tammannstr. 6, 37077 Goettingen, Germany. E-mail: rmedel@gwdg.de; msuhm@gwdg.de
First published on 25th February 2021
Abstract
A model is presented for the prediction of OH stretching fundamental wavenumbers of alcohol conformers in the gas phase by application of a small set of empirical anharmonicity corrections to calculations in the harmonic approximation. In contrast to the popular application of a uniform scaling factor, the local chemical structure of the alcohol is taken into account to greatly improve accuracy. Interestingly, different correction patterns emerge for results of hybrid density functional (B3LYP-D3 and PBE0-D3) and wave-function-based methods (SCS-LMP2, LCCSD(T*)-F12a and CCSD(T)-F12a 1D). This raises questions about electronic structure deficiencies in these methods and differences in anharmonicity between alcohols. After its initial construction on the basis of literature assignments the model is tested with Raman jet spectroscopy of propargyl alcohol, cyclohexanol, borneol, isopinocampheol and 2-methylbutan-2-ol. For propargyl alcohol a spectral splitting attributed to tunneling is resolved. PBE0-D3 is identified as a well performing and broadly affordable electronic structure method for this model. A mean absolute error of 1.3 cm−1 and a maximum absolute error of 3 cm−1 result for 46 conformers of 24 alcohols in a 60 cm−1 range, when a single parameter is adjusted separately for each alcohol substitution class (methanol, primary, secondary, tertiary).
1 Introduction
Alcohols, compounds with a hydroxy group –OH bound to a saturated carbon atom R3C–,1 are among the most common classes of organic compounds. By torsion around the C–O-bond,2 and possibly other bonds in the molecular frame,3 most alcohols can adopt different conformations. To comprehend the details of alcohol aggregation4–6 and reactivity7,8 it is essential to understand conformational isomerism. Such an understanding profits from isolated molecules at low temperatures, as they are accessible in supersonic jet expansions. This helps to identify the most stable conformers, reduces spectral complexity and facilitates comparison with quantum chemical predictions. The hydroxy group is a chromophore for vibrational spectroscopy, as the OH stretching fundamental usually carries substantial infrared and Raman activity. Furthermore its frequency is sensitive to the local environment of the hydroxy group and can thus be used as a probe for the constitution and conformation of the alcohol as well as for possible inter- or intramolecular hydrogen bonding. In this work we use Raman spectroscopy as our method of choice, because it typically leads to narrow and intense rovibrational band maxima and reveals the collisional cooling along the jet expansion with a narrow laser focus.Rotational structure, accessible by rotational9,10 or high resolution electronic11,12 spectroscopy, is also very powerful in obtaining conformational information, but the global character of rotational constants makes it increasingly difficult to determine the position of the light hydroxy hydrogen, when the molecules increase in size.13,14 In such situations, the synergy between different methods is most powerful to reach unambiguous assignments.13,15
Another valuable assignment synergy is provided by the comparison with quantum chemical predictions, typically carried out in the computationally efficient double-harmonic approximation (linear restoring force and linear dipole change for Cartesian displacements). Deficiencies in the electronic structure method, basis set incompleteness and especially the neglect of anharmonicity, however, lead to a mismatch between experimental and predicted values, for rotational and vibrational spectroscopy. Even if the predicted rotational constants are close or the vibrational pattern is accurate, comparison to experiment can still lead to wrong assignments. In vibrational spectroscopy, large intensity differences between conformers or spectral overlap between different monomer bands as well as with dimer signals are typical obstacles.
An example for this challenge is the initial assignment of two predicted conformers for phenylmethanol to two observed bands,16,17 which was later corrected to one monomer and one dimer with the help of a scaling factor obtained from 2-phenylethanol.13 Another challenging case is found in the monoterpene alcohols menthol and neomenthol. A single intense band was observed for each of the two constitutional isomers in the monomer region and theoretical methods differed in their prediction of the respective most stable conformation responsible for these signals.18 A predicted close harmonic frequency match for two conformers across the two species helped, because it mirrored the experimental finding. The resulting assignment for menthol was later confirmed by rotational spectroscopy,10 for neomenthol it is still pending.
These examples demonstrate that the prediction of accurate absolute values for experimental OH stretching fundamentals is desirable and that they might be obtained from inexpensive calculations when an empirical correction from observed transitions of other alcohols is applied. This was attempted already 35 years ago using infrared spectra of vapors at room or elevated temperature and a reparameterized MM2/CNDO force field approach.19 Subsequent tests of the model on further alcohols, however, revealed double-digit cm−1 deviations,20,21 which is of limited use in the light of conformers often differing only in the single-digit range. More encouraging is a 2008 study22 on the prediction of (among others) free and weakly hydrogen-bonded OH stretching wavenumbers of biomolecules under jet conditions. With scaling of harmonic B3LYP/6-311++G** results a mean absolute error (MAE) of 2.8 cm−1 and a maximum absolute error (MAX) of 12 cm−1 for the correlation with experiment was achieved.
An alternative to empirical or systematic23 corrections to harmonic normal modes is the local mode approach, which includes diagonal anharmonicity (deviation from a parabolic potential) by construction.24 The reduced dimensionality allows to employ a higher-level electronic structure method when only a single mode with limited couplings to other modes is of interest, such as the often highly localized OH stretching. In 2003, a 1D investigation25 on the B3LYP/6-311++G(3df,3pd) level reached MAE = 3.0 cm−1 and MAX = 9 cm−1 for 11 conformers of 5 alcohols, calculated relative to the experimental data set used in the present article. Comparison with experimental overtone data revealed that this good agreement without any a posteriori adjustment is due to a favorable error compensation between the underestimation of both the harmonic and diagonal anharmonic contributions and the neglect of off-diagonal anharmonicity (coupling with other modes).
A recent 1D local mode approach26 on the CCSD(T)-F12a/VDZ-F12 level for the same eleven conformers yielded MAE = 11 cm−1 and MAX = 13 cm−1 with very uniform overestimations between 9 and 13 cm−1. This might indicate the possibility of an empirical correction to close the remaining gap from neglected normal mode off-diagonal anharmonicity. Recovering parts of it by adding the couplings with the CO stretching and the COH bending mode (3D local mode model)26 removes the general overestimation, but the spread of the deviations becomes larger with values between −6 and +4 cm−1, resulting in MAE = 2.6 cm−1 and MAX = 6 cm−1. The CCSD(T) 1D and 3D models are currently computationally affordable for alcohols with up to about six carbon atoms.27 One main disadvantage is the rather complicated manual procedure not easily conducted by the non-specialist, especially for the 3D version.
To explore possible low-cost alternatives with routine normal mode calculations in the harmonic approximation, we compare in this article the correlation between results of five quantum chemical methods and a training set of 35 alcohol conformers collated from literature supersonic jet assignments. The devised model for each method is then tested with Raman jet spectra of additional alcohols.
2 Methods
2.1 Computational techniques
Density functional computations were carried out with the Gaussian 09 Rev. E.01 program package.28 The B3LYP29–32 and PBE033 functionals together with Grimmes D3 dispersion correction with two-body terms and Becke–Johnson damping34 were employed. The minimally augmented may-cc-pVTZ basis set,35 the ultrafine integration grid, verytight convergence criteria and no density fitting were used.Wavefunction-based methods were carried out with the Molpro 2020.1 program package.36 Møller–Plesset perturbation theory in second order (MP2) was used in its local variant (L) with spin-component-scaling (SCS),37 the fully augmented aug-cc-pVTZ basis set and the program's default fitting basis sets for density fitting. Local coupled-cluster38,39 with full singles and doubles as well as scaled40 non-iterate perturbative triples was used with explicit correlation in the F12a variant with the Molpro default geminal exponent40 of 1.0 and the VDZ-F12 basis set41,42 together with density fitting, which we will abbreviate as LCCSD(T*). For both wavefunction-based-methods symmetry was disabled, diffuse contributions from domains were deleted and tightened convergence criteria were used. For full details see sample inputs in the ESI.†
For the simulation of spectra calculated Raman activities and depolarization ratios were converted to scattering cross sections. Accounted for are the laser wavelength and the polarization dependent sensitivity of monochromator and camera. This is detailed in the ESI.† Relative populations are based on the assumption that the conformational cooling stops at about 100 K and that vibrational and rotational partition functions for the conformers are similar enough to justify the use of zero-point corrected relative energies instead of Gibbs energies, given the uncertainty and variability of the effective conformational temperature. The value of 100 K corresponds to an estimate at a detection distance from the nozzle of 1 mm,43 using the accurately known conformational energy difference of ethanol.44 Whether such simulations are successful also depends on the ability of the respective electronic structure methods and nuclear motion models of the jet-prepared alcohols to predict effective energy differences. As the examples will show, this appears to be the case to a reasonable extent.
2.2 Experimental techniques
Gas mixtures were prepared by enriching 1.6 bar helium with the vapor pressure of the respective liquid or solid compound at a set temperature. Propargyl alcohol (1 °C, 99%, abcr GmbH), cyclohexanol (25 °C, 99%, Sigma Aldrich), (−)-borneol (24 °C, 98.9%, Acros Organics), (−)-isopinocampheol (24 °C, 98%, Sigma Aldrich) and 2-methyl-2-butanol (0 °C, 96%, Fluka) were used as supplied. The respective gas mixture was expanded continuously at room temperature from a pressure between 0.7–1.2 bar through a (4 × 0.15) mm2 slit nozzle into an evacuated chamber. In the Raman jet setup45 the expansion was probed at different distances from the nozzle by a Spectra Physics Millenia eV laser (532 nm, cw, 24 W). The scattered light was collected perpendicular to the propagation directions of both laser and jet with a camera lens and focused onto a one meter monochromator (McPherson). Photons from Stokes Raman scattering were co-added by a LN2-cooled CCD-camera (Princeton, PyLoN 400) over several minutes and averaged over multiple repetitions. The combination of laser and monochromator results in a spectral resolution of about 1 cm−1. The spectra were calibrated with neon vacuum transitions, we assume band positions to be accurate up to ±1 cm−1. The spectra of cyclohexanol were recorded by B. Hartwig in 2018 as part of his unpublished master's thesis46 using the same setup. The spectrum of 2-methyl-2-butanol was already recorded in 2007 by Z. Xue as part of his unpublished diploma thesis47 using an older version of the setup with a Verdi V5 laser (532 nm, cw, 5 W) and a different LN2-cooled CCD-camera (Andor Technology, DV401-FI). This older spectrum, as well as others recorded with this setup before 2016, was erroneously calibrated with noble gas transition wavenumbers in air rather than in vacuum. To correct for this, the Stokes shift was divided by 1.000277 – the refractive index of dry air48 in the spectral region between laser wavelength and the detected Stokes scattering (OH: ≈660 nm, OD: ≈620 nm). This translates for the Stokes shift (OH: 3640–3690 cm−1, OD: 2680–2720 cm−1) to a correction of about −1 cm−1, which was also applied to all published values obtained with our setup before 2016 used in this study.3 Results
3.1 Experimental literature data
As a training set for our model we use assignments from the literature for OH stretching fundamentals of conformers of monohydric alcohols in supersonic jet expansions. We focus on free hydroxy groups not involved in an intramolecular hydrogen bond because harmonic predictions for accompanied wavenumber shifts are known to be unreliable. This might be blamed partly on deficits on the electronic structure level and partly on changes in anharmonicity.49,50 For this reason we exclude alcohols with further heteroatoms in general as well as conformers of unsaturated alcohols with clear indications for an OH⋯π hydrogen bond. Included in the training set are β,γ-unsaturated alcohols (e.g., phenylmethanol), as the classification of their very weak OH⋯π interaction is disputed.51–54 The derived model from and for transitions of non-hydrogen-bonded conformers is later tested for its performance for hydrogen-bonded species.Band positions in the training set were determined with Raman, FTIR and resonant UV-IR spectroscopy. For conformers subject to investigations with multiple techniques reported band positions agree mostly within 2 cm−1, with some outliers. This can be taken as an estimate for the uncertainity of the used values. Where available, we use values from Raman spectroscopy.
A special case is methanol, whose OH stretching fundamental band is strongly perturbed by a tunneling motion and residual rotational structure. Literature values range from 3681.555 to 3686 cm−1.56 We settle here for a value of 3684 cm−1 from localization models explicitly derived for comparison with results of theoretical methods which do not take into account the dynamics of the molecule.57
All literature assignments were carefully checked by also calculating other possible conformers. Two values were excluded, for 1-octanol58,59 and 2,3,3-trimethylbutan-2-ol,58 because there are doubts about the conformational assignment, this is elaborated in the ESI.†
An overview of the experimental literature data is presented in Fig. 1. The training set consists of 35 conformers of 21 alcohols, including methanol, 17 conformers of 8 primary, 15 conformers of 10 secondary and 2 conformers of 2 tertiary alcohols. Well known is the tendency of the OH stretching fundamental wavenumber to decrease with increasing carbon for hydrogen substitution at the alpha carbon atom.60,61 This is confirmed in the present data set when looking at the averages (Fig. 1), but there are also substantial overlaps between the classes.
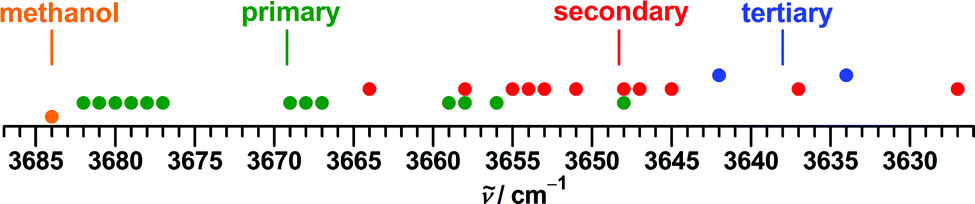 | ||
| Fig. 1 Overview of the training set collated from the literature for experimental fundamental transitions of monohydric non-hydrogen-bonded alcohol conformers determined in supersonic jet expansions. The vertical lines represent the respective average for each class of alcohol. For a detailed list with references see the ESI.† | ||
3.2 Model building
The common equation used to describe the vibrational term value G of a polyatomic molecule in dependence on the vibrational quantum numbers vi of its n non-degenerate vibrations with anharmonicity considered up to quadratic terms is given in eqn (1).62 | (1) |
Herein ωi is the harmonic wavenumber of vibration i, xi,i is its diagonal anharmonicity constant and xi,j are the off-diagonal anharmonicity constants representing the couplings to the n − 1 other modes j. The wavenumber for the fundamental transition ![[small nu, Greek, tilde]](https://www.rsc.org/images/entities/i_char_e0e1.gif) i for a one-quantum excitation of mode i from the vibrational ground state is then given by eqn (2).
i for a one-quantum excitation of mode i from the vibrational ground state is then given by eqn (2).
 | (2) |
For the mode i = OH stretching of alcohols it is found that the diagonal term 2xOH,OH is strongly negative, while the off-diagonal contribution  is minor, due to xOH,j values of small size and varying sign.57 The experimental fundamental wavenumber is thus smaller than the harmonic wavenumber. To estimate values of the former by quantum-chemical calculation of the latter, most commonly an empirical multiplicative scaling factor λ according to eqn (3) is derived by linear regression from a training set.
| i = λ·ωi | (3) |
Here i is no longer restricted to the vibrations of a single molecule, but runs over all vibrations in the training set. A universal value for λ was often derived from transitions over the full fundamental region ( ≈ 0–4200 cm−1),63,64 but this universality comes at the expense of accuracy, with a MAE not better than 20 cm−1.64,65 More refined models optimize separate values for low and high wavenumber modes,63,66–68 introduce a quadratic term65,69 or target modes of specific functional groups.22,70,71 Multiplicative scaling according to eqn (3) corresponds to the assumption that the to be corrected sum of anharmonic contributions to eqn (2) is proportional to the harmonic wavenumber. While this treatment proved to be a reasonable basis for universal correlation models, we use here instead for our narrow OH-targeted ( = 3627–3684 cm−1) analysis a mathematically equally simple but physically more readily interpretable relationship: additive shifting according to eqn (4).
| i = ωi + κ | (4) |
By comparing with eqn (2) the shift parameter κ can be identified as the (assumed to be constant) anharmonic contribution to the fundamental transitions. In practice κ or λ also correct for errors of the employed method in ω.
The correlation between observed fundamental OH stretching wavenumbers in the training set and calculated harmonic wavenumbers at B3LYP-D3 level is shown in Fig. 2. Unexpected by us there is a separation of the data in dependence of the degree of substitution at the alpha carbon atom. This suggests to correct the alcohol classes with different values of κ which increase in size with H → C substitution. Treating primary and secondary alcohols separately allows to substantially decrease the MAE to 1.7 cm−1 for primary and 1.9 cm−1 for secondary alcohols, down from 3.2 cm−1 for a joint linear regression for the two classes. Similarly the MAX improves to 4 cm−1 for each of the classes, from 7 cm−1 for the joint treatment. Alternative regressions of the data with the multiplicative scaling model lead to slightly worse results, especially for joint treatments. The required size of the correction increases with the substitution of the alcohol while at the same time the average wavenumber decreases, quite opposite to the implication for a multiplicative scaling.
 | ||
| Fig. 2 Correlation between observed OH stretch fundamental wavenumbers and calculated harmonic wavenumbers ω for alcohols at B3LYP-D3 level. Separate for each alcohol class a linear regression = ω + κ was performed with a fixed slope of unity and an optimized intercept κ with standard error in parentheses. | ||
In an attempt to separate electronic structure and anharmonicity contributions to the substitution trend for κ, we repeated the calculations with the ‘parameter-free’ PBE0 functional33 in combination with the (not parameter-free) D3 correction, the correlation is shown in the left part of Fig. 3. Again the same pattern is observed, with somewhat smaller but still significant differences in κ between methanol, primary and secondary alcohols. Compared to B3LYP-D3 the quality of the regression is improved noticeably for primary alcohols with MAE = 1.0 cm−1 and MAX = 3 cm−1, and slightly for secondary alcohols with MAE = 1.7 cm−1 and MAX = 3 cm−1.
 | ||
| Fig. 3 Correlation between observed OH stretch fundamental wavenumbers and calculated harmonic wavenumbers ω for alcohols at PBE0-D3 (left) and SCS-LMP2 (right) level. Separate for selected alcohol classes a linear regression = ω + κ was performed with a fixed slope of unity and an optimized intercept κ with standard error in parentheses. | ||
For both B3LYP-D3 and PBE0-D3 the respective value of κ is very similar for secondary and tertiary alcohols and changes in roughly equal (but method dependent) steps when moving to primary alcohols and subsequently methanol. One might exploit this regularity to reduce the formal number of parameters from four to two in the regression model without losing much accuracy. This possibility is elaborated in the ESI.† The set of four substitution-specific independently derived values is used hereafter.
To compare with the results of a (empirically refined) medium-cost wave-function-based method we employ SCS-LMP2 with the aug-cc-pVTZ basis set. In contrast to the DFT methods a very different pattern emerges with SCS-LMP2 in the correlation (right part of Fig. 3). The observed further fragmentation in the graph is related to the isomerism of primary and secondary alcohols regarding the torsion around the C–O bond. Using the qualitative arrangement of the HOCαCβ (for primary alcohols) or HOCαH (for secondary alcohols) dihedral the conformers can be classified as trans (≈180°) or gauche (≈±60°). When comparing harmonic predictions to anharmonic experiment, SCS-LMP2 strongly underestimates the wavenumber differences between these two kinds of conformers. For the most basic example of ethanol the observed difference2,72 of 18 cm−1 is well predicted with B3LYP-D3 (17 cm−1), PBE0-D3 (18 cm−1) and also other hybrid functionals such as M06-2X, ωB97X-D and APF-D,73 but not with SCS-LMP2 and canonical MP274 (both 10 cm−1 with aug-cc-pVTZ). The failure of any uniform correction to harmonic SCS-LMP2 predictions is most evident in the spectral difference between the respective Gt and Gghet conformers of the structurally closely related alcohols 1-propanol,3 cyclohexylmethanol75 and isopropylmethanol.75 While experimentally differences of 12–13 cm−1 were found, again close to the B3LYP-D3 and PBE0-D3 predictions, the harmonic SCS-LMP2 results instead suggest almost coinciding, in part even sequence-inverted, transitions. If SCS-LMP2 should be used for the prediction of fundamental transitions of alcohols we therefore propose an even more differentiated set of corrections with six parameters, as shown in the right part of Fig. 3. Using these, MAE = 1.1 cm−1 and MAX = 3 cm−1 are reached for both primary and secondary alcohols (g and t combined, respectively).
At SCS-LMP2 level about the same value is needed for the correction of the harmonic values for methanol and tertiary alcohols. In contrast the analogous difference in κ amounts to about 15 cm−1 for B3LYP-D3 and about 9 cm−1 for PBE0-D3. While the shift from this triple H → C substitution is well predicted with SCS-LMP2 (when no or only a small change in anharmonicity is assumed), there is still the need for at least three different correction values without a plausible connection for the whole data set. B3LYP-D3 and PBE0-D3 also predict only two single substitutions adequately (from secondary g and t to tertiary), but the discrepancies cancel for conformational differences, which are usually of interest.
To explore also the impact of higher-order electron-correlation we employ LCCSD(T*)-F12a/VDZ-F12, which was used before as the best (still barely affordable) estimate for normal mode calculation of some alcohols and their complexes.49,50,57 Due to the high computational cost we limit its use to alcohols with a maximum of four carbon atoms. The pattern in the obtained correlation (left part of Fig. 4) is very similar to one of SCS-LMP2, but with the differences in κ about halved. For primary alcohols MAE = 0.9 cm−1 and MAX = 2 cm−1 is reached, not directly comparable to the other methods due to the smaller number of data points.
 | ||
| Fig. 4 Correlation between observed OH stretch fundamental wavenumbers and calculated harmonic wavenumbers ω for alcohols at LCCSD(T*) normal mode (left) and CCSD(T) 1D local mode26 (right) level. Included are conformers of methanol, ethanol, 1-propanol, 2-propanol, tert-butyl alcohol and, for LCCSD(T*) only, isopropylmethanol. For all alcohols as well as separate for selected alcohol classes a linear regression = ω + κ was performed with a fixed slope of unity and an optimized intercept κ with standard error in parentheses. | ||
To compare with results of a second high-level method, we also extracted harmonic wavenumbers from the anharmonic CCSD(T)-F12a/VDT-F12 1D local mode model26 discussed in the introduction. For this the reported fundamental and first overtone transition wavenumbers are inserted in eqn (5), which can be derived for xi,j = 0 from eqn (1).
| ω = 3·(1 ← 0) − (2 ← 0) | (5) |
To validate the approximation of truncating eqn (1) after the quadratic term (equivalent to the Morse oscillator expression), we also recalculated the harmonic wavenumbers after adding the cubic term, using the fundamental as well as the first and second overtone transition wavenumbers. It is found that this raises the harmonic wavenumbers only negligibly by 0.1–0.3 cm−1. Used equations and obtained values are detailed in the ESI.†
For the 11 reported alcohol conformers the extracted values from CCSD(T) local modes agree within ±3 cm−1 (better than ±0.1%) with the ones of the LCCSD(T*) normal modes, with the latter being on average 1 cm−1 lower. Closer inspection of this superficial good agreement reveals a systematic difference: all calculated differences between g and t conformers of ethanol, 1-propanol and 2-propanol are larger at harmonic CCSD(T) 1D level, further approaching (but not yet meeting) the experimental differences in the fundamental transitions. This is detailed for some selected differences in Table 1 and leads to a visiblely improved accuracy of a global single parameter regression for harmonic CCSD(T) 1D in the right part of Fig. 4 compared to for LCCSD(T*) in the left part.
| Method | Ethanol | 1-Propanol | 2-Propanol | M − T |
|---|---|---|---|---|
| t − g | Gt − Gg het | g − t | ||
| Experiment anh. | 18 | 13 | 21 | 42 |
| B3LYP-D3 | 17 | 10 | 21 | 27 |
| PBE0-D3 | 18 | 15 | 22 | 33 |
| SCS-LMP2 | 10 | 1 | 15 | 42 |
| LCCSD(T*) | 14 | 5 | 19 | 43 |
| CCSD(T) 1D26 h. | 16 | 10 | 20 | 41 |
The correlations between results of the different methods and experimental OD stretching fundamentals of deuterated alcohols were analyzed as well and analogous patterns were found. Correlation graphs and suggested corrections for deuterated alcohols as well as for the anharmonic CCSD(T) 1D and 3D models are available in the ESI.†
A hint for which assessment might be more likely may be found in data for the diagonal anharmonicity contribution, as it can be calculated through eqn (6).
| 2xOH,OH = (2 ← 0) − 2·(1 ← 0) | (6) |
Experimental results are listed in the left part of Table 2. According to this data there is at most a small increase from methanol to tert-butyl alcohol, in contrast to the expectation from the harmonic DFT results. A somewhat more robust increase is indicated between trans and gauche ethanol – within reported experimental uncertainties possibly large enough to close the gap between the observed difference and the ones calculated at the LCCSD(T*) and CCSD(T) levels. For 1-propanol, however, no clear trend in diagonal anharmonicity between t and g conformers is obvious. The decrease from the t to the g conformer of 2-propanol, which is suggested by the harmonic SCS-LMP2 results, is not supported by experiment.
| Alcohol | Conformer | Jet3,72 | Stationary GP76 | B3LYP 1D25 | CCSD(T)-F12a 1D26 |
|---|---|---|---|---|---|
| Methanol | −172(2) | −172.0(28) | −159.8 | −170.2 | |
| Ethanol | t | −172.6(4) | −170.0(8) | −159.2 | −169.4 |
| Ethanol | g | −176(2) | −172.0(24) | −160.2 | −170.2 |
| 1-Propanol | Tt | −174 | −172(1) | −159.6 | −169.7 |
| 1-Propanol | Gt | −175 | −172(1) | −159.4 | −169.4 |
| 1-Propanol | Gg het | −175 | −172(3) | −159.6 | −169.0 |
| 1-Propanol | Tg | −174 | −172.0(18) | −160.2 | −170.3 |
| 1-Propanol | Gg hom | −177 | −172.0(18) | −160.4 | −170.3 |
| 2-Propanol | t | — | −170.0(24) | −159.8 | −170.3 |
| 2-Propanol | g | — | −172(2) | −160.0 | −169.7 |
| tert-Butyl alcohol | −174.0(4) | −172.0(16) | −160.0 | −169.9 |
Available theoretical investigations indicate as well only small and non-systematic changes between alcohols. With VPT2 calculations only slight changes of less than 1 cm−1 between methanol and gauche ethanol were predicted, differing in sign between the employed methods (MP2, B3LYP-D3 and B2PLYP-D3 with the 6-311+G(2d,p) basis).72 1D calculations at the B3LYP/6-311++G(3df,3pd)25 and CCSD(T)-F12a/VDZ-F1226 levels for different alcohols (right part of Table 2) yield very similar (but method dependent) values within about 1 cm−1 with no clear dependence on conformation or degree of substitution. Apart from a method-dependent correction the harmonic and 1D-anharmonic models thus appear largely equivalent, but we prefer the harmonic model, because it is more easily generalizable to more complex IR chromophores. Including the cubic term in eqn (1) does not change this picture: the absolute values of 2xOH,OH from CCSD(T) 1D increase by mere 0.1–0.3 cm−1, counterbalancing the changes in the harmonic wavenumber, with insignificant cubic contributions to the fundamental  in the range of 0.01–0.03 cm−1.
How the off-diagonal contribution  might change between alcohols appears to be widely unexplored. As the number and character of modes the OH stretching might couple to changes with substitution, some effect is conceivable. For molecules as large as alcohols a direct experimental test is only feasible for individual terms, but not for the complete sum. For the latter n − 1 combination or hot bands of often very low intensity would need to be assigned, in addition to all fundamentals, with uncertainties adding up.
This puts the ball in theory's court. The very uniform deviations from experiment for the results of the CCSD(T) 1D model,26 which covers diagonal anharmonicity, indirectly support similar off-diagonal contributions for alcohols. VPT2 calculations at B3LYP-D3, B2PLYP-D3 and MP2 level (all cc-pVTZ basis) suggest a total off-diagonal contribution to the fundamental in the range of −(10 to 12) cm−1 for methanol.57 The experimental fundamental can be reproduced when this result is combined with the experimental or calculated diagonal term and the harmonic wavenumber obtained at LCCSD(T*) or CCSD(T) 1D level. The latter is also in good agreement with a value from an empirically adjusted CCSD(T)/cc-pVTZ PES,77 which is used as part of the HFREQ2014 benchmark set,78 and other calculations with larger basis sets with F12a or without explicit correlation. Results reported with the F12b or F12c (aka (F12*)) variants, the VQZ-F12 basis and with and without triples scaling are somewhat larger (Table 3).78
| Method | Basis set | ω/cm−1 |
|---|---|---|
| LCCSD(T*)-F12a49 | VDZ-F12 | 3862 |
| LCCSD(T*)-F12a49 | VTZ-F12 | 3863 |
| CCSD(T)-F12a 1D26 | VDZ-F12 | 3863 |
| CCSD(T) adjusted PES77 | VTZ | 3861 |
| CCSD(T)-F12a78 | VTZ-F12 | 3864 |
| CCSD(T*)-F12a78 | VTZ-F12 | 3861 |
| CCSD(T) canonical78 | aV(Q+d)Z | 3864 |
| CCSD(T)-F12b78 | VQZ-F12 | 3868 |
| CCSD(T*)-F12b78 | VQZ-F12 | 3867 |
| CCSD(T)-F12c78 | VQZ-F12 | 3870 |
| CCSD(T*)-F12c78 | VQZ-F12 | 3869 |
| SCS-LMP2 | aVTZ | 3852 |
| SCS-LMP2 | aVQZ | 3871 |
| SCS-LMP2 | aV5Z | 3876 |
| B3LYP-D3 | mayVTZ | 3835 |
| PBE0-D3 | mayVTZ | 3897 |
Exploratory calculations for selected alcohols with larger basis sets (aug-cc-pVQZ for B3LYP-D3 and PBE0-D3; VTZ-F12 for LCCSD(T*)) indicate only negligible changes (in a range of about 1 cm−1) for harmonic OH stretching wavenumbers and consequently their differences. In contrast, the wavenumber of methanol obtained at SCS-LMP2 level increases from 3852 to 3871 to 3876 cm−1 when moving from triple- to quadruple- to quintuple-zeta quality. Very similar increases are found for both conformers of ethanol, so that for this method as well wavenumber differences appear to be largely unaffected by remaining basis set incompleteness.
Compared to the harmonic LCCSD(T*) and CCSD(T)-F12a 1D references, B3LYP-D3 results are far too soft, while the predictions from PBE0-D3 are far too stiff, with the extent depending on the degree of substitution. SCS-LMP2 results tend to be too stiff when large basis set sizes are used.
Whether this overall satisfying picture for methanol, where combined results from high-level harmonic, diagonal and off-diagonal calculations meet the experimental transition, can also be achieved for larger alcohols is an open question. This invites further research on how the diagonal and especially the off-diagonal anharmonicity of the OH oscillator might change with constitution and conformation, but also on why the SCS-LMP2, and likely also the LCCSD(T*) method (awaiting further theoretical testing), underestimate harmonic conformational shifts. The data collated in the present work (see the ESI,† for all details) can be employed as a benchmark, although anharmonic hydrogen tunneling contributions must be kept in mind as potential spoilers for suitable systems (one example is discussed in the next section). On the experimental side this could be supported with jet assignments for additional small-sized alcohols, with a focus on secondary alcohols which are yet underrepresented in this category.
Independent of the extent to which the gap between harmonic predictions and experiment is founded in deficits of the electronic structure methods or in the neglect of vibrational anharmonicity, as long as it is systematic it can be empirically corrected by our model. In the following section it is tested whether the proposed set of still simple (but more complicated than anticipated) corrections can successfully predict fundamental wavenumbers of further alcohol conformers.
3.3 Model testing
 | ||
| Fig. 5 Predicted conformers of propargyl alcohol with respective harmonically zero-point-corrected relative energy, uncorrected harmonic OH stretching wavenumber and Raman activity obtained at PBE0-D3 level. For results of the other methods see the ESI.† The g conformer has two enantiomeric forms. | ||
In the experimental spectrum (Fig. 6) two bands are observed at 3662 and 3658 cm−1, with the latter one having a higher relative intensity in warmer parts of the expansion closer to the nozzle. This can be compared to an assigned band center at 3663 cm−1 in an IR study for the vapor at 100 °C.79
 | ||
| Fig. 6 Raman jet spectra of propargyl alcohol at different detection distances from the nozzle scaled to similar intensities of the 3662 cm−1 signal, in comparison with a simulated spectrum. For the simulation the PBE0-D3 harmonic wavenumbers are corrected as proposed by our model and a Lorentzian broadening of FWHM = 1.5 cm−1 is applied. A Boltzmann distribution at 100 K is assumed. | ||
In line with its predicted very high relative energy no evidence for the t conformer could be detected neither at room temperature with rotational spectroscopy80 nor at 100 °C with infrared spectroscopy.79 The observation of two bands with Raman jet spectroscopy at the expected low conformational temperature of a jet expansion regarding the rotation about a C–O bond2 therefore asks for a different explanation. An anharmonic effect not coverable by empirical scaling/shifting of harmonic predictions (and also not by systematic local anharmonic corrections, such as VPT223) is a tunneling interaction between (almost) isoenergetic conformations. This leads to a splitting of the localized degenerate gauche-eigenstates into a symmetric (s) and antisymmetric (as) delocalized combination. This energetic splitting only results in a resolvable spectral splitting if it is significantly affected by the vibrational excitation, otherwise the Franck–Condon-allowed transitions between the tunneling states with preserved symmetry coincide. The latter seems to be the case within our spectral resolution (about 1 cm−1) for gauche ethanol2 and tert-butyl alcohol,81 even though ground state splittings of hc 3.2 cm−1 and hc 3.8 cm−1, respectively, were detected for these alcohols with rotational spectroscopy.82,83 Propargyl alcohol is the alcohol with the largest known ground state tunneling splitting (hc 21.8 cm−1),80 which leads to a higher absolute sensitivity to small changes in the torsional potential or in the moment of inertia upon OH stretching excitation. Based on the temperature dependence the band at 3662 cm−1 is thus assigned to the transition between the respective lower energy symmetric and the other at 3658 cm−1 to the transition between the respective higher energy antisymmetric states. This assignment corresponds to a lowering of the tunneling splitting by about hc 4 cm−1 upon OH stretching excitation. Transitions between states of different torsional symmetry,84 with expected wavenumbers of about 3680 and 3640 cm−1, are not detected. This can be compared to the lowering of the tunneling splitting for methanol from hc 9.1 cm−1 to hc 6.3 cm−1,85 the resulting spectral splitting of about 3 cm−1 was resolved as well with Raman jet spectroscopy.86 Using the known ground state splitting Eas − Es = hc 21.8 cm−1 for propargyl alcohol, integrated band intensity ratios Is/Ias and the assumption of equal Raman cross sections σas = σs, Boltzmann tunneling temperatures Tt can be estimated through eqn (7).
 | (7) |
The obtained values decrease from 47 K at a detection distance from the nozzle of 0.5 mm to 18 K at 3 mm, indicating very strong relaxation. Similar tunneling temperatures were estimated for malonaldehyde,87 which has coincidentally a ground state tunneling splitting of almost the same size, supporting the assignment. The hypothetical localized transition for comparison with our predictions is the averaged value of 3660 cm−1, slightly higher than anticipated with our model (Table 4).
| Conf. | Method |
/cm−1 |
(ω + κ − exp)/cm−1 |
|---|---|---|---|
| g | Experiment | 3662 (s), 3658 (as) | |
| g | B3LYP-D3 | 3657 | −3 |
| g | PBE0-D3 | 3657 | −3 |
| g | SCS-LMP2 | 3654 | −6 |
| g | LCCSD(T*) | 3658 | −2 |
| t | Experiment | Not observed | |
| t | B3LYP-D3 | 3662 | |
| t | PBE0-D3 | 3666 | |
| t | SCS-LMP2 | 3667 | |
| t | LCCSD(T*) | 3668 | |
In spectra of propargyl alcohol embedded in different cryogenic matrices no spectral splitting was observed and the single band is also downshifted compared to the gas phase position.88 Both effects can be attributed to the interaction with the matrix.
In addition four weak downshifted bands at 3581, 3562, 3532 and 3507 cm−1 are observed in our work, which likely originate from two dimer structures previously assigned in a matrix study.89 In these dimers both hydroxy groups donate a hydrogen bond each and their OH stretching transitions are thus shifted out of the monomer spectral region. The spectrum in the full monochromator range (3720–3270 cm−1) is available in the ESI.†
Another intense transition at 3332 cm−1 is assigned to the acetylenic CH-stretch of the monomer. No splitting is resolved in this case, in line with the expectation that the C–O-torsion is less perturbed by the spatially more distant vibrational excitation. Similar to malonaldehyde,87 it might be of interest to explore the full fundamental range to investigate whether the excitation of any other mode has substantial influence on the tunneling splitting. The small molecular size of propargyl alcohol makes it attractive for high-level theoretical investigation.
 | ||
| Fig. 7 Structural formula and predicted conformers of (−)-borneol with respective harmonically zero-point-corrected relative energy, uncorrected harmonic OH stretching wavenumber and Raman activity obtained at PBE0-D3 level. For B3LYP-D3 and SCS-LMP2 results see the ESI.† | ||
In previous FTIR jet studies59,73,90 a single band at 3653 cm−1 was observed in the monomer region, which was assigned to the most stable conformer g−![[thin space (1/6-em)]](https://www.rsc.org/images/entities/char_2009.gif) 73 (part of the training set). This band is confirmed as the most intense with Raman detection, with additional signals now revealed at 3670 and 3646 cm−1 (Fig. 8). Another band at 3656 cm−1 is assigned to a water impurity.91 When probing a colder part of the expansion at a distance of 2 mm to the nozzle the signal at 3670 cm−1 (assigned to g+) loses in intensity relative to the signal at 3653 cm−1 (assigned to g−), in agreement with the predicted energy sequence of the conformers. The very weak band at 3646 cm−1, assigned to t, is only detected in the warm and dense part of the expansion close to the nozzle. The model based on PBE0-D3 successfully predicts all three band positions within ±2 cm−1, while B3LYP-D3 and especially SCS-LMP2 show larger maximum absolute deviations of 4 respectively 8 cm−1 (Table 5).
73 (part of the training set). This band is confirmed as the most intense with Raman detection, with additional signals now revealed at 3670 and 3646 cm−1 (Fig. 8). Another band at 3656 cm−1 is assigned to a water impurity.91 When probing a colder part of the expansion at a distance of 2 mm to the nozzle the signal at 3670 cm−1 (assigned to g+) loses in intensity relative to the signal at 3653 cm−1 (assigned to g−), in agreement with the predicted energy sequence of the conformers. The very weak band at 3646 cm−1, assigned to t, is only detected in the warm and dense part of the expansion close to the nozzle. The model based on PBE0-D3 successfully predicts all three band positions within ±2 cm−1, while B3LYP-D3 and especially SCS-LMP2 show larger maximum absolute deviations of 4 respectively 8 cm−1 (Table 5).
 | ||
| Fig. 8 Raman jet spectra of (−)-borneol at two detection distances from the nozzle scaled to similar intensities of the 3653 cm−1 signal, in comparison with a simulated spectrum. For the simulation the PBE0-D3 harmonic wavenumbers are corrected as proposed by our model and a Lorentzian broadening of FWHM = 1.5 cm−1 is applied. A Boltzmann distribution at 100 K is assumed. | ||
| Conformer | Method |
/cm−1 |
(ω + κ − exp)/cm−1 |
|---|---|---|---|
| g+ | Experiment | 3670 | |
| g+ | B3LYP-D3 | 3670 | 0 |
| g+ | PBE0-D3 | 3672 | 2 |
| g+ | SCS-LMP2 | 3665 | −5 |
| g− | Experiment | 3653 | |
| g− | B3LYP-D3 | 3654 | 1 |
| g− | PBE0-D3 | 3654 | 1 |
| g− | SCS-LMP2 | 3656 | 3 |
| t | Experiment | 3646 | |
| t | B3LYP-D3 | 3650 | 4 |
| t | PBE0-D3 | 3644 | −2 |
| t | SCS-LMP2 | 3654 | 8 |
Also taking its lower predicted Raman activity into account, the spectra establish g− as the predominant conformer. This is in good agreement with the substantial energy advantage over g+ calculated at the B3LYP-D3 (0.9 kJ mol−1) and PBE0-D3 (1.0 kJ mol−1) levels, but less so with the negligible difference at SCS-LMP2 level (0.1 kJ mol−1). The t conformer is at the edge of the detection limit, as expected from its high calculated relative energy of at least 1.5 kJ mol−1 with the applied methods. This result contrasts to a photoelectron circular dichroism study of a jet expansion of borneol which concluded a roughly equal population of all three conformers.92
Due to the very low vapor pressure of borneol at room temperature (about 3 Pa),93 none of the cluster signals are detected which were observed before with a heated setup for FTIR jet spectroscopy.59
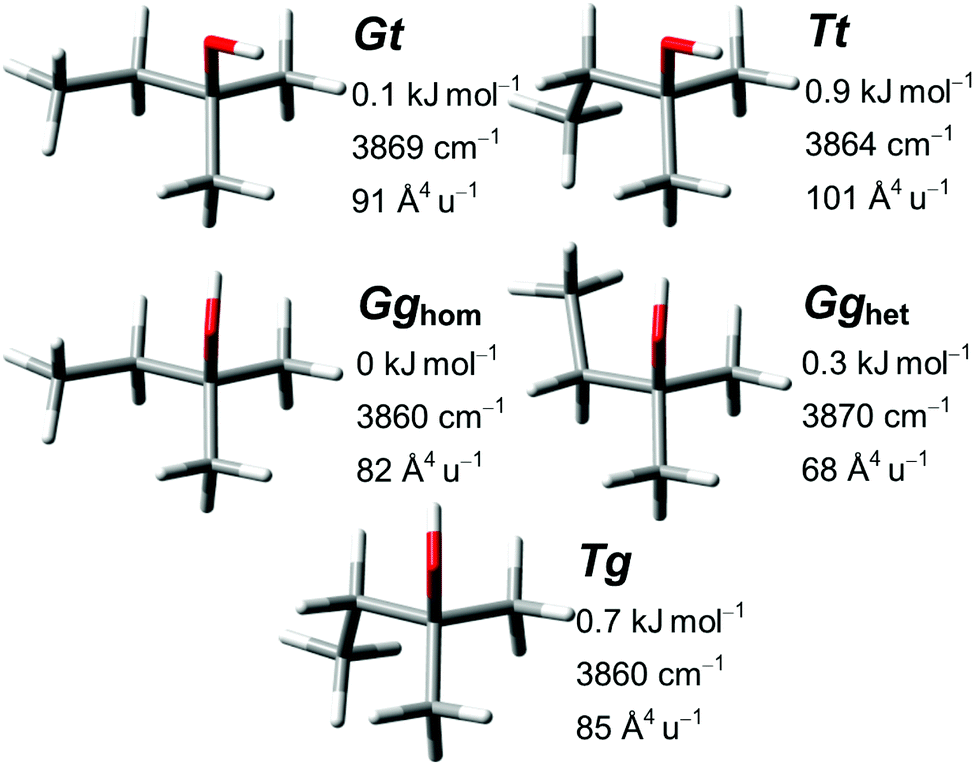 | ||
| Fig. 9 Predicted conformers of 2-methyl-2-butanol with respective harmonically zero-point-corrected relative energy, uncorrected harmonic OH stretching wavenumber and Raman activity obtained at PBE0-D3 level. For results of the other methods see the ESI.† All shown conformers except Tt have an enantiomer with all dihedrals reversed in sign. | ||
For the five conformers the predicted sequences of OH stretching wavenumber and energy are very similar between all four methods. Minor changes are a spectral switch between Tg and Gghom at SCS-LMP2 and LCCSD(T*) level (within 1.5 cm−1 for all methods) and an energetic switch from Gghom to Gt as the global minimum at SCS-LMP2 level (within 0.2 kJ mol−1 for all methods). The good agreement between simulation and observation (Fig. 10) makes the assignments (Table 6) relatively straightforward.
 | ||
| Fig. 10 Raman jet spectrum of 2-methyl-2-butanol in comparison with a simulation. For the latter the PBE0-D3 harmonic wavenumbers are corrected as proposed by our model and a Lorentzian broadening of FWHM = 1.5 cm−1 is applied. A Boltzmann distribution at 100 K is assumed. | ||
| Conformer | Method |
/cm−1 |
(ω + κ − exp)/cm−1 |
|---|---|---|---|
| Gg het | Experiment | 3648 | |
| Gg het | B3LYP-D3 | 3652 | 4 |
| Gg het | PBE0-D3 | 3648 | 0 |
| Gg het | SCS-LMP2 | 3653 | 5 |
| Gg het | LCCSD(T*) | 3652 | 4 |
| Gt | Experiment | 3646 | |
| Gt | B3LYP-D3 | 3647 | 1 |
| Gt | PBE0-D3 | 3647 | 1 |
| Gt | SCS-LMP2 | 3644 | −2 |
| Gt | LCCSD(T*) | 3644 | −2 |
| Tt | Experiment | 3642 | |
| Tt | B3LYP-D3 | 3642 | 0 |
| Tt | PBE0-D3 | 3642 | 0 |
| Tt | SCS-LMP2 | 3641 | −1 |
| Tt | LCCSD(T*) | 3641 | −1 |
| Gg hom | Experiment | 3637 | |
| Gg hom | B3LYP-D3 | 3639 | 2 |
| Gg hom | PBE0-D3 | 3638 | 1 |
| Gg hom | SCS-LMP2 | 3638 | 1 |
| Gg hom | LCCSD(T*) | 3637 | 0 |
| Tg | Experiment | Not assigned | |
| Tg | B3LYP-D3 | 3639 | |
| Tg | PBE0-D3 | 3638 | |
| Tg | SCS-LMP2 | 3639 | |
| Tg | LCCSD(T*) | 3639 | |
With the transitions of Tg and Gghom predicted by all four methods within 1.5 cm−1, a spectral overlap in the intense band at 3637 cm−1 would be plausible. Clusters are observed between 3506 and 3487 cm−1, and are likely also responsible for some spectral intensity in the 3535–3525 cm−1 region. Because we cannot exclude an alternative assignment of Tg to one of these features, we conservatively allocate only the lower energetic Gghom to the signal at 3637 cm−1. The full monochromator range (3830–3390 cm−1) is available in the ESI.†
In an FTIR study21 of the vapor at 100 °C a broad band with two maxima at 3645 and 3641 cm−1 was observed. To the former the Gt and Gghet and to the latter the other three conformers were assigned. This is in reasonable agreement with our results, considering the spectral overlap and thermal effects at these conditions.
Confirming its good performance for the training set, plausible predictions are made by the model based on PBE0-D3 for the spectral positions of all 11 newly assigned conformers in the test set with a maximum error of 3 cm−1. Deviations for B3LYP-D3 tend to be slightly larger up to 4 cm−1, also similar to the training set. Despite using a larger set of corrections, the predictive quality of SCS-LMP2 is found to be lower than anticipated with errors up to 8 cm−1. Due to the high computational costs LCCSD(T*) could only be tested on conformers of propargyl alcohol and 2-methyl-2-butanol with deviations up to 4 cm−1.
By merging the training and test set and reevaluating the corrections the model can be improved for future predictions. Updated values of κ differ from the initial ones at most by 1 cm−1, except for SCS-LMP2 in case of trans conformers of secondary alcohols, whose spectral positions in the test set were all overestimated by the initial correction. Correlation graphs, corrections as well as sample inputs for further use of the model are available in the ESI.† In Table 7 the mean and maximum absolute deviations for the whole updated data set and the different evaluated variants of the model are listed. Comparison with the results of alternative single parameter joint regressions show the gain in accuracy from partitioning of the data set according to chemical properties as suggested by us. Also listed are the performances of local mode models discussed in the introduction. For the CCSDT(T) 1D model the empirical correction of calculated fundamentals is only marginally superior to the correction of calculated harmonic wavenumbers, reflecting the very uniform diagonal anharmonicity.
| Method | n P | n C | MAE/cm−1 | MAX/cm−1 |
|---|---|---|---|---|
| B3LYP-D3 | 4 | 46 | 1.7 | 4 |
| PBE0-D3 | 4 | 46 | 1.3 | 3 |
| SCS-LMP2 | 6 | 46 | 1.5 | 6 |
| LCCSD(T*) | 6 | 19 | 1.0 | 4 |
| B3LYP-D3 | 2 | 46 | 1.8 | 4 |
| PBE0-D3 | 2 | 46 | 1.3 | 3 |
| B3LYP-D3 | 1 | 46 | 3.9 | 14 |
| PBE0-D3 | 1 | 46 | 2.6 | 8 |
| SCS-LMP2 | 1 | 46 | 4.6 | 14 |
| LCCSD(T*) | 1 | 19 | 2.8 | 5 |
| CCSD(T) 1D26 h. | 1 | 11 | 1.2 | 2 |
| CCSD(T) 1D26 anh. | 1 | 11 | 1.1 | 2 |
| B3LYP 1D25 anh. | 0 | 11 | 3.0 | 9 |
| CCSD(T) 1D26 anh. | 0 | 11 | 10.5 | 13 |
| CCSD(T) 3D26 anh. | 0 | 11 | 2.6 | 6 |
In the future, the search for further alcohols with large discriminatory power between the theoretical models can be intensified. For this purpose two bulky alcohols, 2,3,3-trimethylbutan-2-ol and tri-tert-butylcarbinol, for which the methods in our model make conflicting predictions, have been identified. This is elaborated in the ESI.†
3.4 Limitations of the model
The model was trained and tested with transitions observed under jet conditions. Applying it to predict band maxima of alcohols in stationary gas phase at room or elevated temperature is possible, but deviations are expected to increase due to thermal excitation of rotational and low-lying vibrational modes. No predictive quality is expected for OH stretching wavenumbers of alcohols in solution or matrices as they are known to strongly downshift due to environmental effects, with the additional possibility of site splittings in matrices. Empirical prediction of shifts from gas to solution phase was, however, attempted.94How tunneling splittings can lead to deviations from the predictions of this model was already covered in Section 3.3.1 for the example of propargyl alcohol. For this case and for methanol the cause could be readily identified because only a single (energetically relevant) diastereomeric conformer was expected and large ground state splittings were already characterized beforehand with high-resolution spectroscopy. For less well-investigated alcohols with multiple conformers spectral tunneling splittings can seriously complicate assignments of vibrational spectra. We will discuss an especially puzzling example in future work. Ab initio predictions for the size of tunneling splittings are mathematically complex and computationally demanding because a large part of the potential energy surface needs to be considered at a high level of theory. In future work another semi-empirical model will be presented to estimate the size of tunneling splittings, again making use of fast routine calculations and similarities between alcohols.
Another major challenge for theory is the prediction of the downshift induced in the OH stretching fundamental when a hydrogen bond is formed. Both the diagonal anharmonicity72,95,96 as well as the coupling with other modes, including the intermolecular modes in complexes,50,97,98 have been found to depend on the acceptor type. After initial explorative calculations we decided to exclude intramolecular cases from the data set. The presented model derived from and for non-hydrogen-bonded conformers is tested in the ESI,† for a selection of hydrogen-bonded structures reported in the literature with π, N, O, F and Cl acceptors. Briefly, the performance of the model for hydrogen-bonded conformers is very dependent on the acceptor type and the used underlying method. It seems to profit in some cases from error cancellation and a rough estimation of the spectral position can be expected, but it is far less reliable than for non-hydrogen-bonded conformers. It will thus be challenging, but also rewarding, to develop similarly accurate models for hydrogen-bonded alcohols98–100 and other hydrogen bond donors.70,98,101
4 Conclusions
In this article we investigated the possibility of predicting experimental absolute OH stretching fundamental wavenumbers for gas phase alcohols by empirical correction of those calculated in the harmonic approximation. In the correlation between these two quantities we identified different patterns for hybrid density functional (B3LYP-D3 and PBE0-D3) and wave-function based methods (SCS-LMP2, LCCSD(T*) and CCSD(T) 1D). Only harmonically approximated CCSD(T) 1D predicts the spectral shifts from selective H → C substitution at the alpha carbon with good accuracy in all tested cases. Available experimental and theoretical data indicate that this is likely for the right reason due to almost uniform anharmonicities for the considered alcohols, but further confirmation is needed. The concept of the presented model is to exploit the observed error regularities of the more affordable methods in predicting spectral shifts between alcohols with different H/C substitution patterns, including conformational differences for SCS-LMP2 and to a lesser extent LCCSD(T*). Interestingly, shifts from substitution and conformational changes in β-position are predicted more robustly by all tested methods, leading to small sets of empirical correction parameters. Using these, the predictive accuracy of broadly affordable methods can be greatly improved in comparison to conventional uniform scaling. With the best performing method for this purpose, PBE0-D3 combined with a reasonably saturated but still economic basis set, a mean absolute error of 1.3 cm−1 and a maximum absolute error of 3 cm−1 is achieved for 46 conformers of 24 alcohols in a 60 cm−1 range. This facilitates identification of the most stable conformers with a combination of Raman jet spectroscopy and computationally inexpensive routine calculations, as demonstrated for a number of alcohols. The superior performance of the PBE0-D3 based model should, however, not be interpreted as a superior description of the OH stretching potential by this functional. Indeed, it fails in predicting substitution shifts between methanol, primary and secondary alcohols and, as comparison with high-level calculations shows, its harmonic spring constant is far too stiff. However, it provides the best base for empirical correction, which may be related to its minimal empirical content in the first place. The performance of the model is found to deteriorate for spectral positions of alcohol conformers with intramolecular hydrogen bonds, whose anharmonicity is far more multifaceted. Still, we see the success and insight from such simple models for alcohols as an essential prerequisite for any more ambitious modeling attempts in more complex environments.Our analysis also rationalizes the empirical success and popularity of density functionals, notably B3LYP(-D3), in the OH vibrational assignment of alcohol conformations (not necessarily their energy difference), which was often found to be superior to that of affordable wavefunction methods.13,47,74,102,103 Within a given chemical constitution, the DFT deficiency does not interfere with the assignment purpose.
Conflicts of interest
There are no conflicts to declare.Acknowledgements
An earlier version of the model, based on B3LYP-D3 calculations only, has already been published in German language as part of the doctoral thesis of R. Medel.73 The evaluation of the other methods and the experimental data of the test set are published in the present article for the first time. This project was partly funded by the Deutsche Forschungsgemeinschaft (DFG, German Research Foundation) – 271107160/SPP1807. Computational resources from the GWDG and the Faculty of Chemistry (DFG – 405832858/INST 186/1294-1 FUGG) are acknowledged. The benchmarking aspect has profited from the environment provided by the local research training group BENCh (DFG – 389479699/GRK2455). We thank J. R. Springborn for help with measuring the spectra of propargyl alcohol, borneol and isopinocampheol and C. Stelbrink for calculations on borneol and isopinocampheol in the context of their undergraduate research participations. We are in debt to B. Hartwig and Z. Xue for providing the spectra of cyclohexanol46 respectively 2-methyl-2-butanol47 and their preliminary analysis. We also thank the workshops of the institute for their valuable support. For the CCSD(T) 1D local mode model H. G. Kjaergaard kindly provided calculated transition wavenumbers with an additional digit compared to those reported in ref. 26 to reduce round-off errors, they are tabulated in the ESI,† of this work.Notes and references
- G. P. Moss, P. A. S. Smith and D. Tavernier, Pure Appl. Chem., 1995, 67, 1307–1375 Search PubMed.
- T. N. Wassermann and M. A. Suhm, J. Phys. Chem. A, 2010, 114, 8223–8233 CrossRef CAS PubMed.
- T. N. Wassermann, M. A. Suhm, P. Roubin and S. Coussan, J. Mol. Struct., 2012, 1025, 20–32 CrossRef CAS.
- M. A. Suhm, Adv. Chem. Phys., 2009, 142, 1–57 CAS.
- P.-G. Jönsson, Acta Crystallogr., Sect. B: Struct. Crystallogr. Cryst. Chem., 1976, 32, 232–235 CrossRef.
- M. Soutzidou, V.-A. Glezakou, K. Viras, M. Helliwell, A. J. Masters and M. A. Vincent, J. Phys. Chem. B, 2002, 106, 4405–4411 CrossRef CAS.
- D. Ferro-Costas, E. Martínez-Núñez, J. Rodríguez-Otero, E. Cabaleiro-Lago, C. M. Estévez, B. Fernández, A. Fernández-Ramos and S. A. Vázquez, J. Phys. Chem. A, 2018, 122, 4790–4800 CrossRef CAS PubMed.
- D. Troya, J. Phys. Chem. A, 2019, 123, 1044–1050 CrossRef CAS PubMed.
- Z. Kisiel, O. Dorosh, A. Maeda, I. R. Medvedev, F. C. De Lucia, E. Herbst, B. J. Drouin, J. C. Pearson and S. T. Shipman, Phys. Chem. Chem. Phys., 2010, 12, 8329–8339 RSC.
- D. Schmitz, V. A. Shubert, T. Betz and M. Schnell, Front. Chem., 2015, 3, 1–13 CAS.
- M. Wilke, C. Brand, J. Wilke and M. Schmitt, Phys. Chem. Chem. Phys., 2016, 18, 13538–13545 RSC.
- D. M. Miller, J. W. Young, P. J. Morgan and D. W. Pratt, J. Chem. Phys., 2010, 133, 124312 CrossRef PubMed.
- M. Mons, E. G. Robertson and J. P. Simons, J. Phys. Chem. A, 2000, 104, 1430–1437 CrossRef CAS.
- E. M. Neeman and T. R. Huet, Phys. Chem. Chem. Phys., 2018, 20, 24708–24715 RSC.
- M. Mons, E. G. Robertson, L. C. Snoek and J. P. Simons, Chem. Phys. Lett., 1999, 310, 423–432 CrossRef CAS.
- N. Guchhait, T. Ebata and N. Mikami, J. Chem. Phys., 1999, 111, 8438–8447 CrossRef CAS.
- N. Guchhait, T. Ebata and N. Mikami, J. Am. Chem. Soc., 1999, 121, 5705–5711 CrossRef CAS.
- M. Albrecht, J. Will and M. A. Suhm, Angew. Chem., Int. Ed., 2010, 49, 6203–6206 CrossRef CAS PubMed.
- J. Caballero and J. Van Der Maas, J. Mol. Struct., 1985, 127, 57–75 CrossRef CAS.
- J. Caballero and J. Van Der Maas, J. Mol. Struct., 1986, 147, 231–242 CrossRef CAS.
- J. Caballero, C. Bruynes and J. Van Der Maas, J. Mol. Struct., 1986, 147, 243–253 CrossRef CAS.
- Y. Bouteiller, J.-C. Gillet, G. Grégoire and J. P. Schermann, J. Phys. Chem. A, 2008, 112, 11656–11660 CrossRef CAS PubMed.
- V. Barone, J. Chem. Phys., 2005, 122, 014108 CrossRef PubMed.
- P. Jensen, Wiley Interdiscip. Rev.: Comput. Mol. Sci., 2012, 2, 494–512 CAS.
- K. Takahashi, M. Sugawara and S. Yabushita, J. Phys. Chem. A, 2003, 107, 11092–11101 CrossRef CAS.
- E. Vogt, P. Bertran Valls and H. G. Kjaergaard, J. Phys. Chem. A, 2020, 124, 932–942 CrossRef CAS PubMed.
- H. G. Kjaergaard, personal communication, 2020.
- M. J. Frisch, G. W. Trucks, H. B. Schlegel, G. E. Scuseria, M. A. Robb, J. R. Cheeseman, G. Scalmani, V. Barone, B. Mennucci, G. A. Petersson, H. Nakatsuji, M. Caricato, X. Li, H. P. Hratchian, A. F. Izmaylov, J. Bloino, G. Zheng, J. L. Sonnenberg, M. Hada, M. Ehara, K. Toyota, K. Fukuda, J. Hasegawa, M. Ishida, T. Nakajima, Y. Honda, O. Kitao, H. Nakai, T. Vreven, J. A. J. Montgomery, J. E. Peralta, F. Ogliaro, M. Bearpark, J. J. Heyd, E. Brothers, K. N. Kudin, V. N. Staroverov, R. Kobayashi, J. Normand, K. Raghavachari, A. Rendell, J. C. Burant, S. S. Iyengar, J. Tomasi, M. Cossi, N. Rega, J. M. Millam, M. Klene, J. E. Knox, J. B. Cross, V. Bakken, C. Adamo, J. Jaramillo, R. Gomperts, R. E. Stratmann, O. Yazyev, A. J. Austin, R. Cammi, C. Pomelli, J. W. Ochterski, R. L. Martin, K. Morokuma, V. G. Zakrzewski, G. A. Voth, P. Salvador, J. J. Dannenberg, S. Dapprich, A. D. Daniels, Ö. Farkas, J. B. Foresman, J. V. Ortiz, J. Cioslowski and D. J. Fox, Gaussian 09, Revision E.01, Gaussian, Inc., 2009 Search PubMed.
- A. D. Becke, Phys. Rev. A: At., Mol., Opt. Phys., 1988, 38, 3098–3100 CrossRef CAS PubMed.
- C. Lee, W. Yang and R. G. Parr, Phys. Rev. B: Condens. Matter Mater. Phys., 1988, 37, 785–789 CrossRef CAS PubMed.
- A. D. Becke, J. Chem. Phys., 1993, 98, 5648–5652 CrossRef CAS.
- P. J. Stephens, F. J. Devlin, C. F. Chabalowski and M. J. Frisch, J. Phys. Chem., 1994, 98, 11623–11627 CrossRef CAS.
- C. Adamo and V. Barone, J. Chem. Phys., 1999, 110, 6158–6170 CrossRef CAS.
- S. Grimme, S. Ehrlich and L. Goerigk, J. Comput. Chem., 2011, 32, 1456–1465 CrossRef CAS PubMed.
- E. Papajak, J. Zheng, X. Xu, H. R. Leverentz and D. G. Truhlar, J. Chem. Theory Comput., 2011, 7, 3027–3034 CrossRef CAS PubMed.
- H.-J. Werner, P. J. Knowles, G. Knizia, F. R. Manby, M. Schütz, P. Celani, W. Györffy, D. Kats, T. Korona, R. Lindh, A. Mitrushenkov, G. Rauhut, K. R. Shamasundar, T. B. Adler, R. D. Amos, S. J. Bennie, A. Bernhardsson, A. Berning, D. L. Cooper, M. J. O. Deegan, A. J. Dobbyn, F. Eckert, E. Goll, C. Hampel, A. Hesselmann, G. Hetzer, T. Hrenar, G. Jansen, C. Köppl, S. J. R. Lee, Y. Liu, A. W. Lloyd, Q. Ma, R. A. Mata, A. J. May, S. J. McNicholas, W. Meyer, T. F. Miller III, M. E. Mura, A. Nicklass, D. P. O'Neill, P. Palmieri, D. Peng, K. Pflüger, R. Pitzer, M. Reiher, T. Shiozaki, H. Stoll, A. J. Stone, R. Tarroni, T. Thorsteinsson, M. Wang and M. Welborn, MOLPRO, version 2020.1, a package of ab initio programs, 2020 Search PubMed.
- S. Grimme, J. Chem. Phys., 2003, 118, 9095–9102 CrossRef CAS.
- T. B. Adler, G. Knizia and H.-J. Werner, J. Chem. Phys., 2007, 127, 221106 CrossRef PubMed.
- T. B. Adler and H.-J. Werner, J. Chem. Phys., 2011, 135, 144117 CrossRef PubMed.
- G. Knizia, T. B. Adler and H.-J. Werner, J. Chem. Phys., 2009, 130, 054104 CrossRef PubMed.
- K. A. Peterson, T. B. Adler and H.-J. Werner, J. Chem. Phys., 2008, 128, 084102 CrossRef PubMed.
- K. E. Yousaf and K. A. Peterson, J. Chem. Phys., 2008, 129, 184108 CrossRef PubMed.
- S. Oswald, Weak Hydrogen Bonds to Molecular Nitrogen and Oxygen as Experimental Benchmarks for Quantum Chemistry, PhD dissertation, Georg-August-Universität Göttingen, 2019 Search PubMed.
- J. Pearson, K. Sastry, E. Herbst and F. C. De Lucia, J. Mol. Spectrosc., 1996, 175, 246–261 CrossRef CAS.
- T. Forsting and M. Suhm, Curry-Jet SETUP, 2019, DOI: 10.6084/m9.figshare.6395840.v1.
- B. Hartwig, Ramanspektroskopie zur Konformation und Aggregation von Cyclohexanderivaten, Master's thesis, Georg-August-Universität Göttingen, 2018 Search PubMed.
- Z. Xue, Einflüsse von Konstitution und Konformation auf die O–H-Streckschwingungen gesättigter einwertiger C5-Alkohole, Diploma thesis, Georg-August-Universität Göttingen, 2007 Search PubMed.
- P. E. Ciddor, Appl. Opt., 1996, 35, 1566 CrossRef CAS PubMed.
- M. Heger, M. A. Suhm and R. A. Mata, J. Chem. Phys., 2014, 141, 101105 CrossRef PubMed.
- M. Heger, R. A. Mata and M. A. Suhm, Chem. Sci., 2015, 6, 3738–3745 RSC.
- R. Glaser and G. R. Nichols, J. Org. Chem., 2000, 65, 755–766 CrossRef CAS.
- K. Utzat, A. A. Restrepo, R. K. Bohn and H. H. Michels, Int. J. Quantum Chem., 2004, 100, 964–972 CrossRef CAS.
- B. J. Miller, J. R. Lane and H. G. Kjaergaard, Phys. Chem. Chem. Phys., 2011, 13, 14183 RSC.
- J. Osío Barcina, I. Fernández and M. del Rosario Colorado Heras, Eur. J. Org. Chem., 2012, 940–947 CrossRef.
- H. B. Fu, Y. J. Hu and E. R. Bernstein, J. Chem. Phys., 2006, 124, 024302 CrossRef CAS PubMed.
- R. W. Larsen, P. Zielke and M. A. Suhm, J. Chem. Phys., 2007, 126, 194307 CrossRef PubMed.
- M. Heger, Diagonal and Off-Diagonal Anharmonicity in Hydrogen-Bonded Systems, PhD dissertation, Georg-August-Universität-Göttingen, 2016 Search PubMed.
- C. Cézard, C. A. Rice and M. A. Suhm, J. Phys. Chem. A, 2006, 110, 9839–9848 CrossRef PubMed.
- C. A. Rice, Jet-FTIR spectroscopy of biomolecular model systems, PhD dissertation, Georg-August-Universität Göttingen, 2007 Search PubMed.
- J. van der Maas and E. Lutz, Spectrochim. Acta, Part A, 1974, 30, 2005–2019 CrossRef.
- B. T. Lutz and J. H. van der Maas, J. Mol. Struct., 1997, 436–437, 213–231 CrossRef CAS.
- G. Herzberg, Infrared and Raman spectra of polyatomic molecules, Krieger, Malabar, Florida, Reprint ed. with corr edn, 1991 Search PubMed.
- A. P. Scott and L. Radom, J. Phys. Chem., 1996, 100, 16502–16513 CrossRef CAS.
- I. M. Alecu, J. Zheng, Y. Zhao and D. G. Truhlar, J. Chem. Theory Comput., 2010, 6, 2872–2887 CrossRef CAS PubMed.
- M. Sibaev and D. L. Crittenden, J. Phys. Chem. A, 2015, 119, 13107–13112 CrossRef CAS PubMed.
- P. Sinha, S. E. Boesch, C. Gu, R. A. Wheeler and A. K. Wilson, J. Phys. Chem. A, 2004, 108, 9213–9217 CrossRef CAS.
- M. P. Andersson and P. Uvdal, J. Phys. Chem. A, 2005, 109, 2937–2941 CrossRef CAS PubMed.
- J. P. Merrick, D. Moran and L. Radom, J. Phys. Chem. A, 2007, 111, 11683–11700 CrossRef CAS PubMed.
- H. Yoshida, A. Ehara and H. Matsuura, Chem. Phys. Lett., 2000, 325, 477–483 CrossRef CAS.
- J. Spanget-Larsen, B. K. Hansen and P. E. Hansen, Chem. Phys., 2011, 389, 107–115 CrossRef CAS.
- E. Kohls and M. Stein, Contrib. – Maced. Acad. Sci. Arts, Sect. Nat., Math. Biotech. Sci., 2017, 38, 43 CAS.
- F. Kollipost, K. Papendorf, Y.-F. Lee, Y.-P. Lee and M. A. Suhm, Phys. Chem. Chem. Phys., 2014, 16, 15948–15956 RSC.
- R. Medel, Schwingungsspektroskopische Untersuchungen zur Chiralitätserkennung und Torsionsdynamik bei Alkoholen, PhD dissertation, Georg-August-Universität Göttingen, 2020 Search PubMed.
- C. Emmeluth, V. Dyczmons, T. Kinzel, P. Botschwina, M. A. Suhm and M. Yáñez, Phys. Chem. Chem. Phys., 2005, 7, 991–997 RSC.
- J. Altnöder, S. Oswald and M. A. Suhm, J. Phys. Chem. A, 2014, 118, 3266–3279 CrossRef PubMed.
- H. L. Fang and D. A. C. Compton, J. Phys. Chem., 1988, 92, 6518–6527 CrossRef CAS.
- V. Hänninen and L. Halonen, Mol. Phys., 2003, 101, 2907–2916 CrossRef.
- J. M. L. Martin and M. K. Kesharwani, J. Chem. Theory Comput., 2014, 10, 2085–2090 CrossRef CAS PubMed.
- R. Nyquist, Spectrochim. Acta, Part A, 1971, 27, 2513–2523 CrossRef CAS.
- J. Pearson and B. Drouin, J. Mol. Spectrosc., 2005, 234, 149–156 CrossRef CAS.
- P. Zielke, Ramanstreuung am Überschallstrahl: Wasserstoffbrückendynamik aus neuer Perspektive, PhD dissertation, Georg-August-Universität Göttingen, 2007 Search PubMed.
- R. K. Kakar and C. R. Quade, J. Chem. Phys., 1980, 72, 4300–4307 CrossRef CAS.
- E. Cohen, B. Drouin, E. Valenzuela, R. Woods, W. Caminati, A. Maris and S. Melandri, J. Mol. Spectrosc., 2010, 260, 77–83 CrossRef CAS.
- J. Matthews, M. Martínez-Avilés, J. S. Francisco and A. Sinha, J. Chem. Phys., 2008, 129, 074316 CrossRef PubMed.
- R. Hunt, W. Shelton, F. A. Flaherty and W. Cook, J. Mol. Spectrosc., 1998, 192, 277–293 CrossRef CAS PubMed.
- P. Zielke and M. A. Suhm, Phys. Chem. Chem. Phys., 2006, 8, 2826–2830 RSC.
- N. O. Lüttschwager, T. N. Wassermann, S. Coussan and M. A. Suhm, Mol. Phys., 2013, 111, 2211–2227 CrossRef.
- K. Sundararajan, R. Gopi and N. Ramanathan, J. Mol. Struct., 2016, 1121, 26–34 CrossRef CAS.
- J. Saini and K. S. Viswanathan, J. Phys. Chem. A, 2017, 121, 1448–1459 CrossRef CAS PubMed.
- R. Medel, C. Stelbrink and M. A. Suhm, Angew. Chem., Int. Ed., 2019, 58, 8177–8181 CrossRef CAS PubMed.
- G. Avila, J. Fernández, G. Tejeda and S. Montero, J. Mol. Spectrosc., 2004, 228, 38–65 CrossRef CAS.
- G. A. Garcia, H. Soldi-Lose, L. Nahon and I. Powis, J. Phys. Chem. A, 2010, 114, 847–853 CrossRef CAS PubMed.
- V. Štejfa, M. Fulem, K. Ružička and C. Červinka, J. Chem. Thermodyn., 2014, 79, 272–279 CrossRef.
- J. Caballero and J. van der Maas, J. Mol. Struct., 1987, 159, 31–36 CrossRef CAS.
- T. Scharge, D. Luckhaus and M. A. Suhm, Chem. Phys., 2008, 346, 167–175 CrossRef CAS.
- M. A. Suhm and F. Kollipost, Phys. Chem. Chem. Phys., 2013, 15, 10702 RSC.
- K. Mackeprang, V. Hänninen, L. Halonen and H. G. Kjaergaard, J. Chem. Phys., 2015, 142, 094304 CrossRef PubMed.
- K. Mackeprang and H. G. Kjaergaard, J. Mol. Spectrosc., 2017, 334, 1–9 CrossRef CAS.
- J. R. Lane, A. S. Hansen, K. Mackeprang and H. G. Kjaergaard, J. Phys. Chem. A, 2017, 121, 3452–3460 CrossRef CAS PubMed.
- A. Poblotzki, Intermolecular energy scales based on aromatic ethers and alcohols, PhD dissertation, Georg-August-Universität Göttingen, 2019 Search PubMed.
- V. Brenner, E. Gloaguen and M. Mons, Phys. Chem. Chem. Phys., 2019, 21, 24601–24619 RSC.
- T. N. Wassermann, P. Zielke, J. J. Lee, C. Cézard and M. A. Suhm, J. Phys. Chem. A, 2007, 111, 7437–7448 CrossRef CAS PubMed.
- M. Heger, K. E. Otto, R. A. Mata and M. A. Suhm, Phys. Chem. Chem. Phys., 2015, 17, 9899–9909 RSC.
Footnote |
| † Electronic supplementary information (ESI) available: More test cases, updated correlation graphs and corrections, structures as well as experimental and calculated wavenumbers for all alcohols in the data set, sample inputs, tests for hydrogen-bonded conformers, extended range spectra and more. See DOI: 10.1039/d1cp00342a |
| This journal is © the Owner Societies 2021 |