 Open Access Article
Creative Commons Attribution 3.0 Unported Licence
Characterization of two photon excited fragment spectroscopy (TPEFS) for HNO3 detection in gas-phase kinetic experiments†
Damien
Amedro
,
Arne J. C.
Bunkan
,
Terry J.
Dillon
and
John N.
Crowley
 *
*
Division of Atmospheric Chemistry, Max Planck-Institut für Chemie, 55128, Mainz, Germany. E-mail: john.crowley@mpic.de
First published on 5th March 2021
Abstract
We have developed and tested two-photon excited fragment spectroscopy (TPEFS) for detecting HNO3 in pulsed laser photolysis kinetic experiments. Dispersed (220–330 nm) and time-dependent emission at (310 ± 5) nm following the 193 nm excitation of HNO3 in N2, air and He was recorded and analysed to characterise the OH(A2Σ) and NO(A2Σ+) electronic excited states involved. The limit of detection for HNO3 using TPEFS was ∼5 × 10⁹ molecule cm−3 (at 60 torr N2 and 180 μs integration time). Detection of HNO3 using the emission at (310 ± 5 nm) was orders of magnitude more sensitive than detection of NO and NO2, especially in the presence of O2 which quenches NO(A2Σ+) more efficiently than OH(A2Σ). While H2O2 (and possibly HO2) could also be detected by 193 nm TPEFS, the relative sensitivity (compared to HNO3) was very low. The viability of real-time TPEFS detection of HNO3 using emission at (310 ± 5) nm was demonstrated by monitoring HNO3 formation in the reaction of OH + NO2 and deriving the rate coefficient, k2. The value of k2 obtained at 293 K and pressures of 50–200 torr is entirely consistent with that obtained by simultaneously measuring the OH decay and is in very good agreement with the most recent literature values.
1. Introduction
HNO3 is an important atmospheric trace gas and its ultra-violet photo-dissociation has been the subject of numerous studies.1 The photo-dissociation of HNO3 can be divided into three channels, leading to formation of OH, O-atoms or H-atoms, the relative importance of which depends on the wavelength.| HNO3 + hν (I) → OH(X) + NO2(X2A1) | (R1a) |
| → OH(X) + NO2(12B2) | (R1b) |
| HNO3 + hν (II) → O(1D) + HONO(X1A′) | (R1c) |
| → O(3P) + HONO(a3A′′) | (R1d) |
| → O(3P) + HONO(X1A′) | (R1e) |
| HNO3 + hν (III) → H(2S) + NO3 | (R1f) |
At λ < 250 nm, HNO3 is excited to the 21A′ electronic excited through an π–π* transition. At 193 nm, channel II becomes the main photo-dissociation channel with quantum yields of ΦII193nm = 0.67 and ΦI193nm = 0.33.2–5 OH fragments formed in channel I are produced in their vibrational ground state with little rotational excitation,6–9 whereas the NO2 co-fragment is formed either in its ground state, or in its 12B2 electronically excited state (yield < 1.0%). The ground state NO2 thus formed is sufficiently energy rich to decompose to NO and O(3P). Experimental determinations of the yield of O(1D) in channel II vary between 0.54 and 0.28.2,5 At shorter wavelengths, λ < 155 nm, OH can be formed in an electronically excited state10,11 in a single photon process.
In a series of papers by Stuhl and co-workers studying the excitation of HNO3 at 193 nm,12–14 it was shown that electronically excited OH, OH(A), was produced in a sequential, two-photon process. From experimental observations, spin conservation and energy considerations the authors were able to demonstrate that OH(A) was not formed directly but via the photolysis of electronically excited HONO, probably in its metastable lower triplet state (a3A′′). They used these findings to develop a new method (laser-photolysis fragment-fluorescence, LPFF) for the measurement of HNO3 in the atmosphere.15,16 Recently, Winiberg et al.17 reported results from the multi-photon photolysis of HNO3 at 193 and 248 nm and reported dispersed OH and NO fluorescence spectra. They demonstrated that OH emission from a 2-photon excitation of HNO3 was not only observed upon excitation at 193 nm but also at 248 nm. In a previous study18 from our group (on the reaction between OH and HNO3), the TPEFS method was used to check for HNO3 concentration gradients across the reactor at low temperature (220 K < T < 250 K).
In this paper, we investigate the two-photon photodissociation of HNO3 at 193 nm and demonstrate the application of two-photon excited fragment spectroscopy (TPEFS) detection of HNO3 in real-time (flash photolysis) kinetic studies. For the latter we re-measured the well-known rate coefficient19,20 of the reaction between OH and NO2 (R2) by monitoring the HNO3 product by TPEFS and also by near-simultaneous detection of OH via Laser Induced Fluorescence (LIF):
| OH + NO2 + M → HNO3 + M | (R2a) |
| → HOONO + M | (R2b) |
2. Experimental
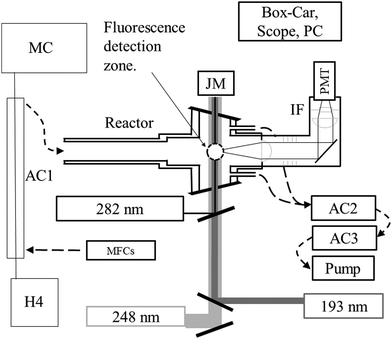
All measurements were performed at 293 K on the PLP-LIF apparatus shown in Fig. 1. Several features of the setup have been described in detail elsewhere.24 The main modifications to the present set-up are (1) the incorporation of a gated CCD camera for dispersed fluorescence measurement and (2) an additional (193 nm) excimer laser.2.1 Radical generation, fluorescence excitation and detection
Laser-light is coupled in/out of the thermostatted, multi-axis reaction cell (volume ∼500 cm3) via Brewster-angle quartz windows. Pulsed (∼20 ns) 248 nm light from a KrF-excimer laser (Coherent COMPex 205F) provided a source of OH radicals (e.g. via H2O2 photolysis, see later).HNO3 was detected following excitation/dissociation at 193 nm using an ArF excimer laser (Coherent COMPex Pro 201F). A focal lens (f = 50 cm) was used to mildly focus the laser in the middle of the reactor to enhance the HNO3 detection sensitivity. Typical photon fluxes at 193 nm varied from 30 to 50 mJ cm−2 (measured at the exit of the photolysis cell). OH was excited at 282 nm using a YAG-pumped Dye-Laser (Quantel Brilliant B/Lambda-Physik ScanMate II). All three lasers operated at 10 Hz. The PMT signal was accumulated using either a box-car integrator (Stanford Research Systems, SR 250) for kinetic measurements or a digital oscilloscope (Tektronix TDS 3014C, 100 MHz) for recording time-resolved fluorescence signals.
The fluorescing volume at the reactor centre was imaged via a 5 cm diameter quartz lens on the major axis of the cell onto a photomultiplier tube screened with a 280 nm long-pass filter (BG26) and a (310 ± 5) nm interference filter. A lens/optical fibre set up on an orthogonal axis transmitted fluorescence from the same volume to the entrance slit of a 0.5 m monochromator (Acton Research 500) equipped with a gated, intensified CCD camera (Roper Scientific, PMax) for measurement of dispersed fluorescence. Spectra were recorded using gratings with either 300 or 1200 lines mm−1 resulting in spectral ranges of ∼80 nm (at ∼1.2 nm resolution) or ∼20 nm (at ∼0.4 nm resolution), respectively. Spectral resolution determination and wavelength calibration was carried out using a low pressure Hg-lamp.
2.2 Reagent gas concentrations
The concentrations of reagent gases were monitored using three different, on-line optical absorption set-ups. Absorption by NO2 (400–450 nm) was measured in an absorption cell (l = 110 cm) using a halogen lamp as light source and a 0.5 m monochromator/diode array camera as detector. NO2 concentrations were derived by least-squares fitting to a literature reference spectrum degraded to the same resolution.25 The concentration of H2O2 was determined from its optical absorption at 213.86 nm (low pressure Zn-lamp, l = 34.8 cm) using an absorption cross-section of σ213.9(H2O2) = 3.3 × 10⁻¹⁹ cm2 molecule−1.26 The concentrations of HNO3 and H2O were determined from their optical absorption at 184.95 nm (low pressure Hg-lamp, l = 43.8 cm) using σ184.95(HNO3) = 1.63 × 10⁻¹⁷ cm2 molecule−1![[thin space (1/6-em)]](https://www.rsc.org/images/entities/char_2009.gif) 18,27,28 and σ184.95(H2O) = 7.14 × 10⁻²⁰ cm2 molecule−1.29 In the same set-up, the ozone concentration was measured at 253.65 nm using a cross-section of 1.1 × 10⁻¹⁷ cm2 molecule−1.23
18,27,28 and σ184.95(H2O) = 7.14 × 10⁻²⁰ cm2 molecule−1.29 In the same set-up, the ozone concentration was measured at 253.65 nm using a cross-section of 1.1 × 10⁻¹⁷ cm2 molecule−1.23
2.3 Chemicals
Bottled N2 (Westfalen, 5.0) was used without further purification. H2O2 (AppliChem, 50 wt%) was concentrated by vacuum distillation. NO2 was prepared by reacting ∼50 torr of NO with a large excess of O2 in a dried glass bulb. The NO2 was then condensed at liquid N2 temperature and excess O2 and NO were removed by pumping. The resulting NO2 was stored as a mixture of 5% NO2, 10% O2 and 85% N2. Anhydrous nitric acid was prepared by mixing KNO3 (Sigma Aldrich, 99%) and H2SO4 (Roth, 98%), and condensing the HNO3 vapour into a liquid nitrogen trap. Anhydrous nitric acid was kept at 252 K between experiments.3. Results and discussion
3.1 Fluorescence from HNO3 at (310 ± 5) nm in N2
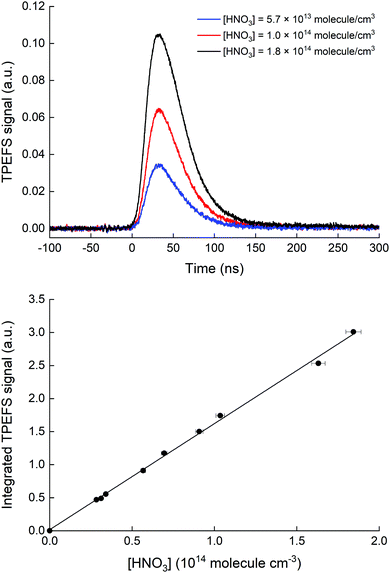
Our TPEFS measurement of HNO3 monitors a fluorescence signal that is transmitted through an interference filter (310 ± 5 nm) that biases detection to the strong OH (0,0) emission lines. Fig. 2 (upper panel) displays the averaged (500 laser pulses), time-resolved signal due to three different concentrations of HNO3 (in a flow of N2 at a total pressure of 100 torr) which were quantified by absorption at 184.95 nm. The integrated fluorescence signals are plotted against HNO3 concentration in the lower panel of Fig. 2 which indicates that, for [HNO3] up to 2 × 10¹⁴ molecule cm−3 and under these experimental settings (PMT voltage, focused 193 nm laser light), the fluorescence signal is proportional to [HNO3]. At 60 torr N2, we achieved a limit of detection for HNO3 of 5 × 10⁹ molecule cm−3 at 1σ for 2 min of signal accumulation, which results (at 10 Hz) in a total signal integration time of 180 μs.The dependence of the TPEFS signal on the 193 nm laser energy (E193nm, varied by changing the high-voltage of the excimer laser or placing fine metal mesh in the beam at the exit of the laser) is displayed in Fig. 3. The relative change in energy was measured by splitting part of the laser-beam to a photo-diode with a linear response in the range measured.
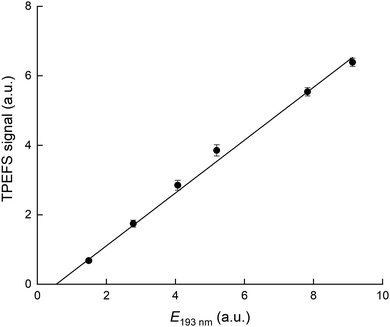 | ||
| Fig. 3 TPEFS signal as a function of 193 nm laser energy. The solid line is a linear regression. The experimental conditions were: 100 torr [N2] and [HNO3] = 1.1 × 10¹³ molecule cm−3. | ||
The signal does not follow the expected quadratic dependence on laser energy for a two-photon process, but varies linearly, with a negative offset. This is a result of saturation of the first electronic transition due to the focused 193 nm radiation and the large absorption cross-section of HNO3. The apparent, negative offset is a manifestation of non-linearity at low laser energy where the first transition is not yet saturated. Our energy dependence contrasts that reported by Winiberg et al.17 who observed a quadratic dependence on laser fluence. This difference is likely related to their use of much lower laser fluences (factor ∼15) and (potentially) a less focused laser beam.
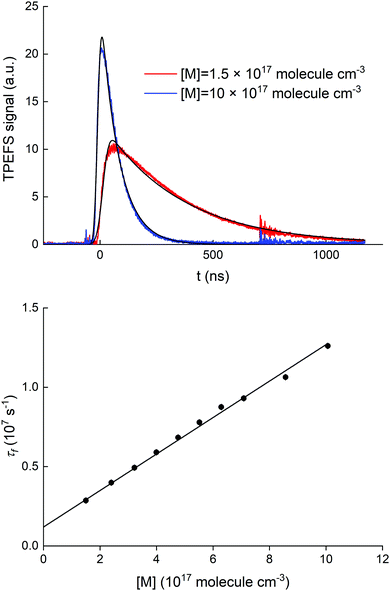
A series of auxiliary experiments was conducted to examine the quenching of the fluorescence by N2. The fluorescence signals, recorded for [HNO3] = 5.0 × 10¹² molecule cm−3, at N2 densities between 1.5 and 10 × 1017 molecule cm−3 (∼4 and ∼30 torr at 293 K), are displayed in the upper panel of Fig. 4.
Assuming that the fluorescence corresponds to the (0,0) transition from the OH(A) state we can write:
| d[OH(A)]/dt = kf + kq(N2)[N2] + kq(HNO3)[HNO3] | (1) |
 | (2) |
At an HNO3 concentration of 5 × 10¹² molecule cm−3 and using the quenching rate constant reported by Kenner et al.14 of kq(HNO3) = 5.9 × 10⁻¹⁰ cm3 molecule−1 s−1, we calculate kq(HNO3)[HNO3] ≈ 3000 s−1 which thus represents a negligible contribution (<1%) to the intercept of (1.2 ± 0.1) × 106 s−1. The inercept can thus be equated to kf and results in a radiative lifetime of about (840 ± 90) ns (errors are 2σ statistical). This value is somewhat larger than the natural fluorescence lifetime of (688 ± 21) ns34 for the A2Σ(v′ = 0) → X2Π(v′′= 0) transition, indicating that the nascent OH(A2Σ(v′ = 1,2)) formed from 193 nm, two-photo excitation of HNO3 undergoes vibrational energy transfer down to A2Σ(v′ = 0) on the same timescale as the fluorescence emission and the electronic quenching. This was confirmed by the observation of an increase in the signal intensity as the pressure was increased although [HNO3] was kept constant.
3.2 Dispersed fluorescence spectrum of HNO3
In Fig. 5 we display the emission spectrum (220 to 330 nm) obtained in the excitation of HNO3 at 193 nm in He bath gas at 90 torr. The individual spectra for each ∼20 nm wide spectral region are the average of 2000 single spectra (obtained at 10 Hz) with a gate width (i.e. CCD exposure time) of 1 μs and were recorded 45 ns after the 193 nm laser pulse. The features are assigned to emission from excited OH and NO. Note that the final spectrum is not corrected for the wavelength dependent sensitivity of the detector or wavelength dependent transmission of either the monochromator or the optical fibre used. This will result in a positive bias to longer wavelength fluorescence and thus features such as the NO emission lines between 225 and 280 nm are stronger (relative to the OH(A) lines) than depicted in this figure. Under these experimental conditions, we were able to observe the OH(0,0) emission centred at 310 nm and emissions of vibrationally excited OH at ∼282 nm OH(1,0), ∼287 nm OH(2,1) and ∼315 nm OH(1,1).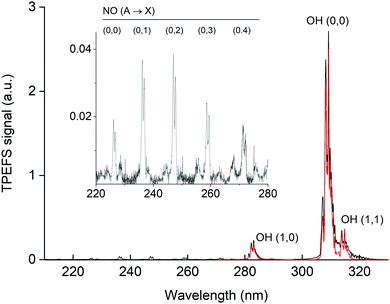 | ||
| Fig. 5 Fluorescence emission spectrum (black line) following excitation of 7 × 10¹³ molecule cm−3 HNO3 in 90 torr He at 193 nm. The inset has an expanded y-scale showing NO fluorescence emission lines from 220 to 280 nm. The red line is a simulation (LIFBASE35) of the relative line intensities for the OH A2Σ(v′ = 0,1,2) → X2Π(v′′= 0,1,2) transition using Tvib = 3200 K and Trot = 700 K. | ||
Using LIFBASE35 we could approximately reproduce the measured OH fluorescence spectra with a vibrational temperature (Tvib) of ∼3200 K and a rotational temperature (Trot) of ∼700 K. The former value is in qualitative agreement with Kenner et al.14 who also observed a high degree of vibrational excitation in OH and reported a vibrational temperature of 375 K.
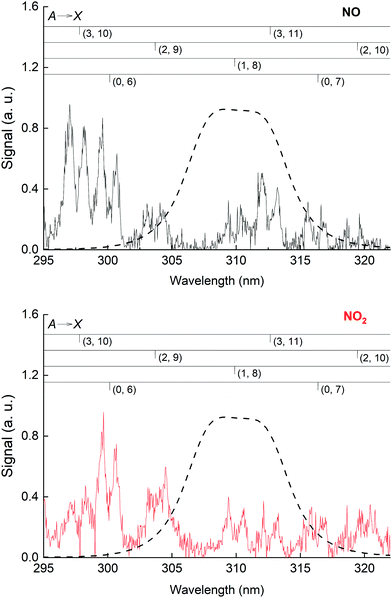
The NO emission lines have been observed previously in the 193 nm excitation of HNO3 and were thought to be the result of the excitation of NO2, which was present as an impurity in the experiments of Papenbrock et al.12 However, our measurement of the NO* fluorescence emission resulting from the excitation of NO2 at 193 nm (see Fig. 6) showed that the intensities of the NO emission lines are much smaller than those observed in the excitation of similar amounts of HNO3, which leads us to conclude that NO* is formed via 193 nm excitation of HNO3 and not from NO2 impurity.
Indeed, this additional channel, in which the co-product would be OH in its electronic ground state, is energetically feasible and has been proposed previously.36 Recent work by Winiberg et al.17 also showed that NO(A) was observed from the two photon photolysis of HNO3 at 248 nm.
3.3 TPEFS detection of selected NOX and HOX trace gases
In this section we discuss the relative detection sensitivity of TPEFS to HNO3, NO and NO2. The results are summarised in Table 1. As described above, the NO(A) emission lines seen when exciting HNO3 samples at 193 nm may arise from the presence of impurities such as NO or NO2. Here, we examine the relative detection sensitivity for NO and NO2, identify the origin of these lines and assess the potential interference of NO and NO2 whilst monitoring HNO3 as OH(A).| HNO3 | NO | NO2 | H2O2 | HO2 | |
|---|---|---|---|---|---|
| a σ is the single-photon absorption cross-section at 193 nm (units of 10−20 cm2 molecule−1). Detection sensitivity is relative to HNO3. Uncertainties are 2σ statistical only. | |||||
| σ | 110023 | <0.001 | 2937 | 6123 | 39038 |
| S (N2) | 10![[thin space (1/6-em)]](https://www.rsc.org/images/entities/char_2009.gif) 000 000 |
(30 ± 10) | (50 ± 20) | — | <(3 ± 1) |
| S (air) | 10![[thin space (1/6-em)]](https://www.rsc.org/images/entities/char_2009.gif) 000 000 |
(5 ± 1) | — | (0.6 ± 0.2) | |
| S (He) | 10![[thin space (1/6-em)]](https://www.rsc.org/images/entities/char_2009.gif) 000 000 |
<1 | — | — | |
For both NO and NO2, we performed a series of experiments in different bath gases (N2 and He) and with and without O2 in order to assess the excitation mechanism at the origin of emission around 310 nm. To minimize HNO3 interference from NO and NO2 excitation spectra, we coated the gas line leading to the reactor with NaHCO3. The removal of HNO3 was confirmed by the non-observation of OH emission lines.
In experiments designed to investigate the kinetics of HNO3 formation via the reaction between OH and NO2 (Section 3.4) we used H2O2 as the photolytic source of OH. In these experiments, HO2 was also formed and we therefore report the sensitivity (relative to HNO3) of TPEFS to both HO2 and H2O2.
The experiments on NO, NO2, HO2 and H2O2 are described in Sections 3.3.1–3.3.4, the results are summarized in Table 1.
Shibuya and Stuhl39 and Hack et al.40 measured the dispersed fluorescence from a few mTorr of pure NO upon excitation with an ArF laser and reported that the emission (in the 200 to 300 nm range) arose mainly from the B2Π(v′ = 7) state, but identified weaker features from the adjacent A(v′ = 3) and C(v′ = 0) states. Shibuya and Stuhl hypothesized that at 193 nm the absorption arose from the transition from high rotational states (R11, P11, Q11, R22 and P22) of the ground state (X2Π, v′′ = 0) to the B2 Π(v′ = 7) state.
Additionally, we measured the dependence of the NO fluorescence signal (as measured through the (310 ± 5) nm interference filter and PMT) as a function of the 193 nm laser energy, which is displayed in Fig. S2 (ESI†). There is a strictly proportional dependence of the NO fluorescence signal as a function of E193nm, which (given the weak absorption of NO at this wavelength) may indicate that the process leading to NO fluorescence involves one photon.
In Fig. S3 (ESI†), we display a series of spectra showing the effect of changing bath gas (He to N2) and of adding O2 on the distribution of the NO emission lines upon 193 nm excitation of either NO or NO2. All spectra were recorded at a total pressure of 65 torr with similar concentrations of either NO or NO2 ([NO] = 2.6 × 10¹⁵ molecule cm−3, [NO2] = 2.1 × 10¹⁵ molecule cm−3) and [O2] = 4.0 × 10¹⁶ molecule cm−3. In Fig. S3a (ESI†) (NO2 excitation) we observed that the fluorescence emission is ∼5 times more intense in He than in N2 for the A(v′ = 0) → X vibrational series. For NO (Fig. S3b, ESI†), we also observed a stronger quenching effect of He relative to N2 but observed that in He fluorescence was mainly from the A(v′ = 3) electronic state while in N2 it was from the A(v′ = 0) state.
The relative intensity of the emission lines indicates that 85% of the vibrational population was located in the A(v′ = 3) state. The replacement of He with N2 leads to the depopulation, through vibrational energy transfer, of the A(v′ = 3) electronic state to form A(v′ = 0, 1, 2). We did not observe any evidence of emission down from the B2Π(v′ = 7) state as reported previously39,40 however it appears that under our pressure and bath gas conditions that the B2Π(v′ = 7) is quenched down to the observed A2Σ(v′ = 3) state in agreement with Hack et al.40 We note that the quenching rate constants were reported to be larger for N2 (see Settersen et al.41 and references therein) than for He.42,43
In Fig. S3c to f (ESI†), we present spectra highlighting the strong O2 quenching effect on NO fluorescence from both NO2 and NO excitation.
We also examined the quenching of NO fluorescence (as measured by the PMT through the (310 ± 5) nm interference filter) by O2. As shown in Fig. 6, in this wavelength window, NO fluorescence arises from NO A(v′ = 0, 1, 2, 3) emission to the ground state. In Fig. S4 (ESI†) we show the relative change in fluorescence intensity while the concentration of O2 was varied from 0 to 4 × 10¹⁷ molecule cm−3 (in N2 bath gas at a total pressure of 60 torr). From this we derive a quenching rate constant for O2 of (1.5 ± 0.1) × 10−10 cm3 molecule−1 s−1, where the uncertainty is 2σ statistical only (more details in ESI†). This result is in excellent agreement with previous measurements which reported a quenching rate constant for O2 of 1.5 × 10⁻¹⁰ cm3 molecule−1 s−1 (see Nee et al.42 and references therein) for NO (A, v′ = 0). Quenching rate constants were reported as being only weakly dependent on the vibrational level of the A state, with values of kq within 30% for (A, v′ = 0, 1, 2, 3) for N2 and O2.42 Our experiments indicate that the numerous quenching rate constant determinations reported in the literature can reproduce our observations at 310 nm.
Excitation of NO2 at 193 nm (6.42 eV) leads to its photo-dissociation to vibrationally excited, electronic ground-state NO(X 2Π) and both O(1D) and O(3P)37,46 as well as N(4S) and O2.47 As shown in Fig. 6 (lower panel), upon excitation of NO2 at 193 nm, we observed fluorescence emission from NO(A2Σ+), as previously reported.48
The energy thresholds for the formation of NO A2Σ+ and NO B2Π are 8.60 and 8.75 eV respectively.49–51 Welge52 reported the formation of NO(A2Σ+ and B2Π) after exciting NO2 to Rydberg states at 116.5 nm (10.64 eV), 123.6 nm (10.03 eV) and 129.5 nm (9.57 eV) but not at 147 nm (8.43 eV). This indicates that single-photon processes at 193 nm cannot explain the formation of NO(A2Σ+). On the other hand, simultaneous absorption of two-photons at 193 nm (12.84 eV) appears unlikely to be the source of NO(A2Σ+) as the ionization energy threshold for the formation of NO+ is only 12.38 eV.51 We conclude that a sequential, two-photon absorption mechanism involving a sufficiently long-lived intermediate state (i.e. similar to the formation of excited OH in the 2-photon photolysis of HNO3) might be at the origin of the observed NO(A2Σ+) in NO2 photolysis at 193 nm.
In Fig. 7, we present calibration curves in which TPEFS signals are plotted as a function of NO, NO2 and HNO3 concentrations.
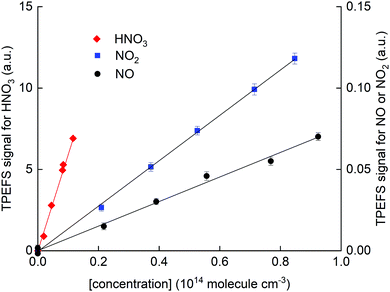 | ||
| Fig. 7 HNO3 TPEFS signal (left y-axis) and NO and NO2 TPEFS signal (right y-axis) as a function of concentration. These results were obtained in N2 (62 torr) and at room temperature (298 ± 2 K). | ||
Note that the right y-axis (for NO and NO2 detection) is scaled by a factor 0.01 compared to that for HNO3 (left y-axis). Concentrations of NO2 and HNO3 were obtained by in situ optical absorption (Section 2.2), whereas the concentration of NO was derived from the mixing ratio in the storage bulb, its dilution in bath gas and the total pressure. The solid-line fits to the data indicate a sensitivity for detection of NO relative to HNO3 of (3 ± 1) × 10−3 in N2. The values obtained in air and He were (5 ± 1) × 10−4 and <10−4, respectively.
The lower relative sensitivity in air compared to N2 is readily explained by the more efficient quenching of O2 on NO fluorescence than on OH fluorescence. It is also amplified by the very low quenching rate constant of NO fluorescence by N2.41
In He, the TPEFS sensitivity to HNO3 increased (compared to N2) much more than it did for NO or NO2. This forced us to reduce the PMT-voltage when monitoring HNO3 whereby usable signals from NO and NO2 were only obtained by adding much larger concentrations for which fluorescence self-quenching was an issue. In He we were thus unable to extend the dynamic range of the experiment to measure signals from HNO3 and NO or NO2 under the same conditions and we only report a lower limit of 10−4 to the relative sensivity.
In order to perform similar experiments on NO2, we initially used diluted NO2 samples. However, we found that a small but variable fraction (around 0.1–1%) of the NO2 was converted to HNO3 on the inlet and reactor surfaces. We therefore generated NO2in situ in a pre-reactor by reacting NO with O3. The latter, at a concentration of 1.0 × 10¹³ molecule cm−3, was generated by the photolysis of O2 at 185 nm using a Hg lamp.
The conversion of NO to NO2 was 92 to 95%. We thus obtained a relative detection efficiency (in N2) of NO2 compared to HNO3 of (5 ± 3) × 10−3.
Previous studies on the VUV photolysis of H2O253–56 indicate that OH, H and O-atoms are formed:
| H2O2 + hν → 2 OH(X2Π) | (R3a) |
| → OH(X2Π) + OH(X2 Π, v′′ > 0) | (R3b) |
| → H(2S) + HO2 | (R3c) |
| → H2O + O(3P) | (R3d) |
| → H2O + O(1D) | (R3e) |
| → H2O + O(1S) | (R3f) |
Formation of OH(A), has however been observed in the two-photon excitation of H2O2 at 193 nm58,59 which, via analysis of the state resolved internal distribution of OH(A), was demonstrated to originate from a resonant, 2-photon sequential absorption process.
| OH + H2O2 → HO2 + H2O | (R4) |
3.4 Rate coefficient for the OH + NO2 reaction
Rate coefficients for OH + NO2 were measured by both conventional pulsed laser photolytic formation of OH with its detection in real time by laser induced fluorescence (PLP-LIF, with 282 nm excitation of OH and PLP-TPEFS with 193 nm excitation for detection of the HNO3 product).OH radicals were generated either in the 248 nm photolysis of H2O2 (R5) or by the 248 nm photolysis of O3 in the presence of H2O (R6 and R7).
| H2O2 + hv→ 2 OH | (R5) |
| O3 + hv → O(1D) + O2 | (R6) |
| O(1D) + H2O → 2 OH | (R7) |
We observed that small amounts of NO2 (<0.1%) were converted into HNO3 on the surfaces of the reactor adding a background signal to the kinetics profile. The effect became more pronounced when water vapour was added to the reactor where as much as a few percent of NO2 were converted to HNO3. We note that the build-up of background HNO3 occurred on a longer time scale (∼2–3 hours) than the time necessary to gather the data necessary to derive a rate constant for one particular set of conditions. However, it did prevent conducting a long-time series of measurements (e.g. over the course of a day) as the background became too large and the reactor cell needed to be flushed with dry N2 for several hours to return to favourable conditions. The use of NaHCO3 to coat the surface was impractical in these experiments as its efficiency to remove HNO3 also changed over time.
In both schemes, OH is generated quasi-instantaneously compared to its loss rate and the time profiles for OH loss and HNO3/HOONO production in the cell are then given by:
[OH]t = [OH]0![[thin space (1/6-em)]](https://www.rsc.org/images/entities/char_2009.gif) exp(−[k2[NO2] + dOH]t) exp(−[k2[NO2] + dOH]t) | (3) |
| [HNO3]t = αC(exp(−dHNO3t) − exp(−[k2[NO2] + dOH]t)) | (4) |
| [HOONO]t = (1 − α)C(exp(−dHOONOt) − exp(−[k2[NO2] + dOH]t)) | (5) |
The pseudo-first-order loss rate coefficient for OH is:
| k2′ = k2[NO2] + dOH | (6) |
Fig. 8 shows time profiles for both OH decay (upper panel) and HNO3 production (lower panel) obtained for the same chemical system using H2O2 as a precursor. The HNO3 TPEFS signals displayed were accumulated for 40 scans (∼10 min) while OH LIF signal were accumulated for 25 scans (∼5 min). The profiles were obtained by computer-controlled variation of the delay-time between the 248 nm excimer laser pulse (generating OH at time zero) and either the 282 nm laser exciting OH or the 193 nm excimer-laser exciting HNO3.
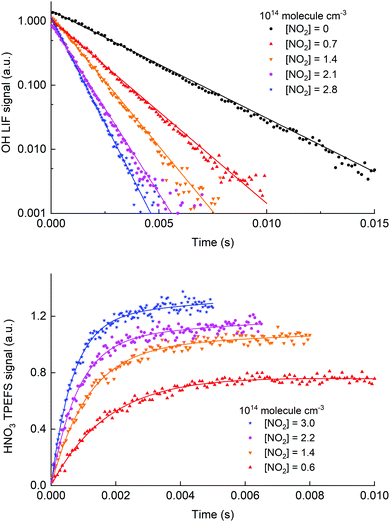 | ||
| Fig. 8 Time dependent signals from OH (upper panel, LIF) and HNO3 (lower panel, TPEFS) obtained in measurements at 100 torr of air using H2O2 as a OH precursor. The solid lines are fits to the OH (eqn (3)) and HNO3 signals (eqn (4)). The reaction time for the HNO3 formation datasets was adjusted (i.e. shorter at high [NO2]) to get sufficient datapoints in the early part of the profile. | ||
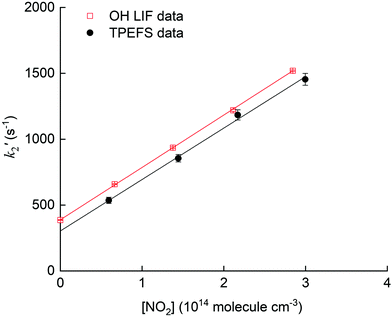
The pseudo first-order rate coefficients, k2′, were obtained by fitting the observed time profiles to eqn (3) and (4) for OH loss and HNO3 production, respectively. The bimolecular rate coefficients were then obtained by plotting k2′ against [NO2] as shown in Fig. 9, which displays data from an experiment at a total pressure of 100 torr of air whereby [NO2] was varied between 0.5 and 3 × 10¹⁴ molecule cm−3.
The values of k2 obtained from the slopes of least-squares fits to these datasets are (4.0 ± 0.1) and (3.9 ± 0.3) × 10−12 cm3 molecule−1 s−1, respectively.
Fig. 10 shows the measured rate coefficients as a function of pressure along with fall-off expression (see the ESI†) used to parameterize data recently measured in this laboratory.19,20
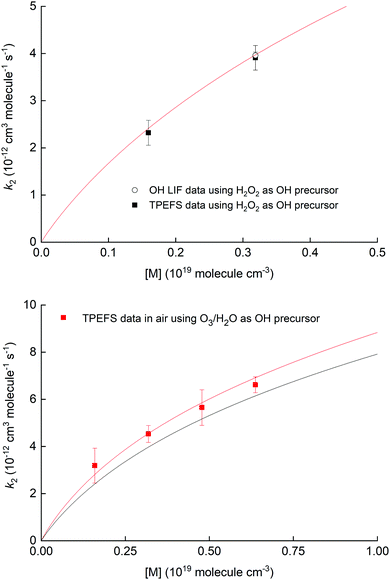 | ||
| Fig. 10 Upper panel: Measurement of k2 for the OH reaction with NO2 in air using 248 nm photolysis of H2O2 as a OH precursor and either TPEFS detection of HNO3 or conventional LIF detection of OH. The solid red line is a fall-off parameterisation (see ESI†). Lower panel: Measurement of k2 for the OH reaction with NO2 in air using 248 nm photolysis of O3–H2O to generate OH. The solid red line is a fall-off parameterization (see the ESI†) using a mixing ratio for H2O of 4.2% while the solid black line corresponds to the same parametrisation in dry air. | ||
The results displayed in the upper panel of Fig. 10 indicate that the rate coefficients obtained using detection of HNO3 using TPEFS are in excellent agreement (better than 10%) with that obtained using OH-LIF and also with the parameterisation presented in our previous, comprehensive study (using OH-LIF). The lower panel indicates that larger rate coefficients are obtained when using O3/H2O as OH-precursor. This observation is entirely consistent with the enhancement of k2 in the presence of H2O described in detail by Amedro et al.19 and the parameterisation of k2 presented by those authors (red line). Note that the overall aim of the kinetic investigations described in Section 3.4 was not to strengthen the database on the OH + NO2 reaction, but to show that time resolved detection of HNO3 by TPEFS can be used to derive accurate rate coefficients. For more details about the OH reaction with NO2 rate constants measurements, including an extended comparison with previous works and a newly developed parametrization, we invite the interested reader to view our previous studies.19,20 We are unaware of any reason why TPEFS detection of HNO3 could not be extended to kinetic studies at e.g. different temperatures.
4. Conclusions
We have characterized the detection of HNO3 using TPEFS as part of a study to assess its viability for detection of HNO3 in real-time (e.g. pulsed laser) kinetic studies. We have shown that detection of HNO3 (via OH(A) emission at ∼310 nm is orders of magnitude more sensitive than detection NO or NO2 (via NO* emission) at the same wavelength, especially in air where the quenching of NO fluorescence is most efficient owing to the presence of O2. As a test case, we have used TPEFS for real-time detection of HNO3 in the reaction between OH and NO2. The rate constant obtained (293 K, 50–200 torr) is entirely consistent with that obtained by simultaneously measuring the OH decay and is in very good agreement with the most recent literature values.Author contributions
DA, TD and JC set up the apparatus, DA, TD and AB performed the experiments. DA analysed the data. JC conceptualised the experiments and helped DA write the manuscript.Conflicts of interest
There are no conflicts to declare.Acknowledgements
We thank the Deutsche Forschungsgemeinschaft (DFG) for partial financial support of this research (CR 246/2-1). Open Access funding provided by the Max Planck Society.Notes and references
- R. Atkinson, D. L. Baulch, R. A. Cox, J. N. Crowley, R. F. Hampson, R. G. Hynes, M. E. Jenkin, M. J. Rossi and J. Troe, Atmos. Chem. Phys., 2004, 4, 1461 CrossRef CAS.
- A. A. Turnipseed, G. L. Vaghjiani, J. E. Thompson and A. R. Ravishankara, J. Chem. Phys., 1992, 96, 5887 CrossRef CAS.
- P. Felder, X. F. Yang and J. R. Huber, Chem. Phys. Lett., 1993, 215, 221 CrossRef CAS.
- A. Schiffman, D. D. Nelson and D. J. Nesbitt, J. Chem. Phys., 1993, 98, 6935 CrossRef CAS.
- T. L. Myers, N. R. Forde, B. Hu, D. C. Kitchen and L. J. Butler, J. Chem. Phys., 1997, 107, 5361 CrossRef CAS.
- J. Schlütter and K. Kleinermanns, Chem. Phys. Lett., 1992, 192, 94 CrossRef.
- A. Jacobs, K. Kleinermanns, H. Kuge and J. Wolfrum, J. Chem. Phys., 1983, 79, 3162 CrossRef CAS.
- G. H. Leu, C. W. Hwang and I. C. Chen, Chem. Phys. Lett., 1996, 257, 481 CrossRef CAS.
- Q. Li, R. T. Carter and J. R. Huber, Chem. Phys. Lett., 2001, 334, 39 CrossRef CAS.
- H. Okabe, J. Chem. Phys., 1980, 72, 6642 CrossRef CAS.
- M. Suto and L. C. Lee, J. Chem. Phys., 1984, 81, 1294 CrossRef CAS.
- T. Papenbrock, H. K. Haak and F. Stuhl, Ber. Bunsen-Ges., 1984, 88, 675 CrossRef CAS.
- R. D. Kenner, F. Rohrer and F. Stuhl, Chem. Phys. Lett., 1985, 116, 374 CrossRef CAS.
- R. D. Kenner, F. Rohrer, T. Papenbrock and F. Stuhl, J. Phys. Chem., 1986, 90, 1294 CrossRef CAS.
- T. Papenbrock and F. Stuhl, Atmos. Environ., Part A, 1991, 25, 2223 CrossRef.
- T. Papenbrock, F. Stuhl, K. P. Müller and J. Rudolph, J. Atmos. Chem., 1992, 15, 369 CrossRef CAS.
- F. A. F. Winiberg, C. J. Percival and S. P. Sander, Chem. Phys. Lett., 2019, 3, 100029 CAS.
- K. Dulitz, D. Amedro, T. J. Dillon, A. Pozzer and J. N. Crowley, Atmos. Chem. Phys., 2018, 18, 2381 CrossRef CAS.
- D. Amedro, M. Berasategui, A. J. C. Bunkan, A. Pozzer, J. Lelieveld and J. N. Crowley, Atmos. Chem. Phys., 2020, 20, 3091 CrossRef CAS.
- D. Amedro, A. J. C. Bunkan, M. Berasategui and J. N. Crowley, Atmos. Chem. Phys., 2019, 19, 10643 CrossRef CAS.
- A. K. Mollner, S. Valluvadasan, L. Feng, M. K. Sprague, M. Okumura, D. B. Milligan, W. J. Bloss, S. P. Sander, P. T. Martien, R. A. Harley, A. B. McCoy and W. P. L. Carter, Science, 2010, 330, 646 CrossRef CAS PubMed.
- J. Troe, J. Phys. Chem. A, 2012, 116, 6387 CrossRef CAS PubMed.
- IUPAC, Task Group on Atmospheric Chemical Kinetic Data Evaluation, (Ammann, M., Cox, R. A., Crowley, J. N., Herrmann, H., Jenkin, M. E., McNeill, V. F., Mellouki, A., Rossi, M. J., Troe, J. and Wallington, T. J.), http://iupac.pole-ether.fr/index.html.).
- M. Wollenhaupt, S. A. Carl, A. Horowitz and J. N. Crowley, J. Phys. Chem., 2000, 104, 2695 CrossRef CAS.
- A. C. Vandaele, C. Hermans, S. Fally, M. Carleer, R. Colin, M. F. Merienne, A. Jenouvrier and B. Coquart, J. Geophys. Res.: Atmos., 2002, 107, 4348 CrossRef.
- G. L. Vaghjiani and A. R. Ravishankara, J. Geophys. Res.: Atmos., 1989, 94, 3487 CrossRef CAS.
- F. Biaume, J. Photochem., 1973–1974, 2, 139 Search PubMed.
- P. H. Wine, A. R. Ravishankara, N. M. Kreutter, R. C. Shah, J. M. Nicovich, R. L. Thompson and D. J. Wuebbles, J. Geophys. Res.: Atmos., 1981, 86, 1105 CrossRef CAS.
- C. A. Cantrell, A. Zimmer and G. S. Tyndall, Geophys. Res. Lett., 1997, 24, 2195 CrossRef CAS.
- R. A. Copeland and D. R. Crosley, J. Chem. Phys., 1986, 84, 3099 CrossRef CAS.
- A. E. Bailey, D. E. Heard, P. H. Paul and M. J. Pilling, J. Chem. Soc., Faraday Trans., 1997, 93, 2915 RSC.
- R. A. Copeland and D. R. Crosley, Chem. Phys. Lett., 1984, 107, 295 CrossRef CAS.
- R. A. Copeland, M. J. Dyer and D. R. Crosley, J. Chem. Phys., 1985, 82, 4022 CrossRef CAS.
- K. R. German, J. Chem. Phys., 1975, 62, 2584 CrossRef CAS.
- J. Luque and D. R. Crosley, LIFBASE (version 1.5) http://www.sri.com/cem/lifbase, 1999.
- R. D. Kenner, F. Rohrer and F. Stuhl, J. Phys. Chem., 1986, 90, 2635 CrossRef CAS.
- F. Sun, G. P. Glass and R. F. Curl, Chem. Phys. Lett., 2001, 337, 72 CrossRef CAS.
- J. N. Crowley, F. G. Simon, J. P. Burrows, G. Moortgat, K. M. E. Jenkin and R. A. Cox, J. Photochem., 1991, 60, 1 CAS.
- K. Shibuya and F. Stuhl, J. Chem. Phys., 1982, 76, 1184 CrossRef CAS.
- W. Hack, R. K. Sander, J. J. Valentini and N. S. Nogar, Mol. Phys., 1985, 56, 977 CrossRef CAS.
- T. B. Settersten, B. D. Patterson and C. D. Carter, J. Chem. Phys., 2009, 130, 204302 CrossRef.
- J. B. Nee, C. Y. Juan, J. Y. Hsu, J. C. Yang and W. J. Chen, Chem. Phys., 2004, 300, 85 CrossRef CAS.
- J. Few and G. Hancock, Phys. Chem. Chem. Phys., 2014, 16, 11047 RSC.
- W. Schneider, G. K. Moortgat, G. S. Tyndall and J. P. Burrows, J. Photochem. Photobiol., A, 1987, 40, 195 CrossRef CAS.
- J. M. Sun, M. Y. Zhang and T. S. Liu, J. Geophys. Res.: Atmos., 2001, 106, 10325 CrossRef.
- G. Hancock and M. Morrison, Mol. Phys., 2005, 103, 1727 CrossRef CAS.
- T. Nakayama, K. Takahashi, Y. Matsumi and K. Shibuya, J. Phys. Chem. A, 2005, 109, 10897 CrossRef CAS PubMed.
- H. K. Haak and F. Stuhl, J. Photochem., 1981, 17, 69 CrossRef.
- K. P. Huber and G. Herzberg, Molecular spectra and molecular structure IV. Constants of diatomic molecules, Van Nostrand Reinhold Company Inc., New York, 1st edn, 1979 Search PubMed.
- R. Jost, J. Nygard, A. Pasinski and A. Delon, J. Chem. Phys., 1996, 105, 1287 CrossRef CAS.
- I. Wilkinson, I. A. Garcia, B. J. Whitaker, J.-B. Hamard and V. Blanchet, Phys. Chem. Chem. Phys., 2010, 12, 15766 RSC.
- K. H. Welge, J. Chem. Phys., 1966, 45, 1113 CrossRef CAS.
- U. Gerlach-Meyer, E. Linnebach, K. Kleinermanns and J. Wolfrum, Chem. Phys. Lett., 1987, 133, 113 CrossRef CAS.
- G. Vaghjiani, A. A. Turnipseed, R. F. Warren and A. R. Ravishankara, J. Chem. Phys., 1992, 96, 5878 CrossRef CAS.
- Y. Inagaki, Y. Matsumi and M. Kawasaki, Bull. Chem. Soc. Jpn., 1993, 66, 3166 CrossRef CAS.
- T. Nakayama, K. Takahashi and Y. Matsumi, Int. J. Chem. Kinet., 2005, 37, 751 CrossRef CAS.
- M. Suto and L. C. Lee, Chem. Phys. Lett., 1983, 98, 152 CrossRef CAS.
- H. Gölzenleuchter, K.-H. Gericke and F. Josef Comes, Chem. Phys. Lett., 1985, 116, 61 CrossRef.
- C. B. McKendrick, E. A. Kerr and J. P. T. Wilkinson, J. Phys. Chem., 1984, 88, 3930 CrossRef CAS.
Footnote |
| † Electronic supplementary information (ESI) available. See DOI: 10.1039/d1cp00297j |
| This journal is © the Owner Societies 2021 |

