 Open Access Article
Creative Commons Attribution 3.0 Unported Licence
Atomistic simulation studies of ionic cyanine dyes: self-assembly and aggregate formation in aqueous solution†
Gary
Yu
 ,
Martin
Walker
 and
Mark R.
Wilson
 *
*
Department of Chemistry, Durham University, Lower Mountjoy, Stockton Road, Durham, UK. E-mail: mark.wilson@durham.ac.uk
First published on 5th March 2021
Abstract
Cyanine dyes are known to form large-scale aggregates of various morphologies via spontaneous self-assembly in aqueous solution, akin to chromonic liquid crystals. Atomistic molecular dynamics simulations have been performed on four cyanine dyes: pseudoisocyanine chloride (PIC), pinacyanol chloride (PCYN), 5,5′,6,6′-tetrachloro-1,1′,3,3′-tetraethylbenzimidazolylcarbocyanine chloride (TTBC) and 1,1′-disulfopropyl-3,3′-diethyl-5,5′,6,6′-tetrachloro-benzimidazolylcarbocyanine sodium salt (BIC). Simulations employed an optimised general AMBER force field and demonstrate the organisation of the dyes into stacked structures at dilute concentrations. The thermodynamics of self-assembly was studied by calculating potentials of mean force for n-mers (n = 2, 3 or 4), from which the free energies of association are determined. We report binding free energies in the range of 8 to 15kBT for dimerisation, concordant with typical values for ionic chromonics (7 to 14kBT), and examine the enthalpic and entropic contributions to the aggregation process. The self-assembly of these dyes yields two distinct classes of structures. We observe the formation of H-aggregate stacks for PCYN, with further complexity in these assemblies for PIC; where the aggregates contain shift and Y junction defects. TTBC and BIC associate into a J-aggregate sheet structure of unimolecular thickness, and is composed of a brickwork arrangement between molecules. These sheet structures are characteristic of the smectic chromonic mesophase, and such assemblies provide a route to the emergence of nanoscale tubular architectures.
1 Introduction
The self-assembly of synthetic dye molecules into supramolecular aggregates is recognised to be a promising approach to construct functional materials on the nanoscale.1 These molecular assemblies are known to form spontaneously in various environments, giving rise to large-scale aggregates with interesting optical properties.2–4 In particular, cyanine dyes exhibit a strong shift of the monomer (M) absorption band, upon aggregation in aqueous solution, towards a longer wavelength. Dyes which exhibit this bathochromic (red) shift, resulting in a sharp narrow absorption band, are termed J-aggregates (with the band itself termed as a J-band) and was first observed in a pseudoisocyanine dye.5,6 Similarly, a hypsochromic (blue) shift is ascribed to H-aggregation, which has also been observed in cyanine dyes.7 These spectral properties originate from the organisation of the molecules within the aggregates. Such systems are characterised by the intermolecular association of aromatic cores into stacked structures, where the direction of the spectral shift is determined by the angle between adjacent molecular planes.8,9 Generally, direct face-to-face stacking results in H-aggregate behaviour, whereas J-aggregate behaviour is attributed to offset, staggered stacking.These stacking patterns are ubiquitous in chromonic liquid crystals, which are lyotropic systems of amphiphilic, disc-like molecules in aqueous solution. Here, initial aggregation into stacks is followed by further organisation into mesophases, such as the nematic or hexagonal phases, as concentration and temperature are varied.10 Within the two main aggregation motifs, further complexity can arise with proposed structures such as double-width columns, hollow chimneys and brickwork models.11,12 These structures have been suggested to exist in aqueous, ionic cyanine dyes where their behaviour is largely liquid-crystalline in nature.13
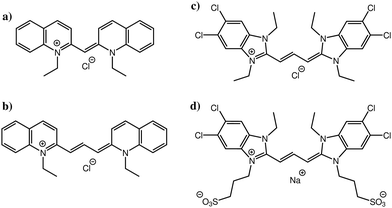
In this study, we focus on four cyanine dyes (see Fig. 1): pseudoisocyanine chloride (PIC),5,6 pinacyanol chloride (PCYN),14–19 5,5′,6,6′-tetrachloro-1,1′,3,3′-tetraethylbenzimidazolylcarbocyanine chloride (TTBC)20–22 and 1,1′-disulfopropyl-3,3′-diethyl-5,5′,6,6′-tetrachloro-benzimidazolylcarbocyanine sodium salt (BIC).23–27 PIC and PCYN differ only by an ethylene unit in the centre of the molecule. TTBC and BIC share a common mesogenic core but BIC has two additional mesylate groups. A distinguishing feature of cyanine dyes is the structural stability of the aggregates despite the relatively small size of the mesogen; this is achieved due to the delocalisation of the π-electron density across the polymethine chain.1 This gives rise to a high polarisability of the cationic aromatic system and results in strong attractive interactions governing the association rather than hydrophobic forces. The unique properties of cyanine J-aggregates can be exploited in devices as spectral sensitisers and synthetic light harvesting systems,28,29 owing to the ease of alignment and adsorption of the dyes to surfaces.30–32 Further applications, such as electronic energy transport wires,33 fast all-optical switches34,35 and as fluorophores for biological imaging36,37 have been reported. The supramolecular morphologies of cyanine aggregates have been studied using electron microscopy techniques, revealing the common formation of tubular architectures which can form networks of fibres.14,20,23,38–40 However, the molecular level stacking arrangement within these aggregates is still a question for which there is currently no unequivocal answer.
Atomistic simulation is a powerful tool for the study of aggregation in aqueous systems in terms of structures and thermodynamics, and has been applied extensively for similar, analogous processes in chromonics.41–50 All-atom molecular dynamics (AA MD) simulations have previously been performed on some cyanine dyes.20,43,51,52 In this paper, we investigate the self-assembly of four cyanine dyes with AA MD simulations in an attempt to elucidate the finer details of J-aggregation. We present simulation results on the association and emergent structures of cyanine aggregates and the thermodynamics of the self-assembly in a low concentration regime. Two classes of structures are observed in this work: stacks of H-aggregate character, which can incorporate the J-aggregate motif in shift and Y junction defects, and sheet-like assemblies composed of a brickwork arrangement between molecules as suggested for the smectic chromonic mesophase.
2 Computational methods
2.1 Force fields
In this work, the General AMBER Force Field (GAFF) was chosen as the starting force field for atomistic simulations.53 The Antechamber software from AmberTools18 was used to produce appropriate potentials for the force field for a given chemical structure.54 The GAFF topologies generated were converted into the necessary input files for GROMACS using the ACPYPE script.55 All simulations used the TIP3P water model56 which is compatible in combination with GAFF.57The force field was modified in two ways. Firstly, the dihedral potentials for key sections within the mesogens were optimised to better describe their torsional profiles, according to the methodology employed by Boyd and Wilson.58,59 Dihedral potentials were obtained using density functional theory (DFT) by incrementing the selected dihedral, ϕ, by 6° over a range of 180°, performing a geometry optimisation and calculating the potential energy at each step. The resulting DFT potential was fitted to a Ryckaert–Bellemans (RB) function with the determination of new coefficients (see ESI:† Tables S1 and S2) via minimisation of a squared difference, χ2. The RB dihedral potential is defined as
 | (1) |
2.2 Simulation details
All MD simulations were carried out in GROMACS 2018.2.62 Atomistic simulations were initiated from a random configuration of solute in a box (with dimensions of 6 nm × 6 nm × 6 nm), solvated with water and counterions to meet the required concentration. Long-range electrostatic interactions were handled by the Particle Mesh Ewald (PME) method63 with a cut-off of 1.2 nm used (for electrostatic and Lennard-Jones interactions). After minimisation, a short pre-equilibration run in the NVT ensemble was run using the Berendsen thermostat followed by a more extensive pre-equilibration in the NpT ensemble with the addition of the Berendsen barostat.64 Equilibration (for 100 ps) and subsequent production runs employed the Nosé–Hoover thermostat65,66 to keep the temperature constant at 300 K, and the Parrinello–Rahman barostat67 to maintain a pressure of 1 bar. We used a leap-frog integrator with a time step of 1 fs for equilibration with an increase to 2 fs for production runs, where constraints were applied to all bonds using the Linear Constraints Solver (LINCS) algorithm.68 After equilibration, production simulations were typically performed for 500 ns. All simulation snapshots are produced from the final frame of their MD trajectories, unless otherwise stated.2.3 Free energy of association
The free energy of association for a system can be evaluated from a potential of mean force (PMF) along a reaction coordinate. If the reaction coordinate is a separation distance, then the PMF describes the work done to pull two species apart. This PMF can be obtained by a series of simulations where the molecules are constrained at specified points over a separation distance. The PMF, UPMF, is then calculated by integrating the average constraint force, 〈fc〉s, over the separation distance, s, according to the equation | (2) |
Here, PMFs were calculated for systems at a concentration of 1 wt% and at various temperatures. This dilute concentration is required in order to facilitate the pulling apart of the initial structures while avoiding self-interaction due to periodic boundary conditions. A pull was applied between the centres of mass (COMs), rCOM, of each species
 | (3) |
Configurations of specific distance were extracted with neighbouring points varying from 0.02–0.1 nm between windows. Each window was equilibrated for 1 ns and then simulated for 20 ns to sample a range of configurations with the intermolecular distances of the COMs constrained. A total of 1 × 10⁶ force values were output for each point of the separation distance and used to calculate the average constraint force before integration to obtain the PMF.
3 Results and discussion
3.1 Structure of the dyes and dihedral potentials
The standard GAFF parameters for PIC allow for free rotation around the central dihedral. This is incorrect as studies show that the central ‘bridge’ in PIC allows for twisting of the molecule where the global minimum for the angle is ∼27° away from planarity.51 Thus, a dihedral optimisation process was applied here to improve the representation of the key dihedral. For PIC, one dihedral was optimised whereas PCYN has two dihedrals for optimisation (see Fig. 2). Both TTBC and BIC share a common mesogenic unit; therefore, this process was only applied to TTBC with the assumption that these parameters are transferable.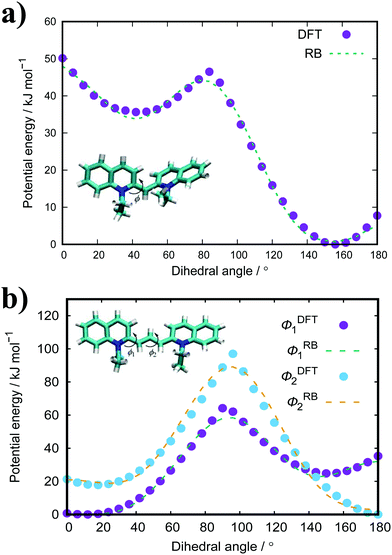 | ||
| Fig. 2 Calculated potentials (DFT, B3LYP/6-31+G*) for the key dihedral(s) with their fitted Ryckaerts-Bellemans (RB) potentials in (a) PIC and (b) PCYN. | ||
The dihedral potential for PIC exhibits a global minimum at 156° and a local minimum at 45° with a 46.5 kJ mol−1 energy barrier between the two minima. This results in conformations where the planar rings are twisted with respect to each other. The corresponding dihedral in PCYN (ϕ1) has a global minimum at 12° and a local minimum at 150°, where the second dihedral (ϕ2) has a global minimum at 180° and a local minimum at 18°. This manifests as a twist between the rings, but of a smaller magnitude than PIC. For TTBC, the potentials have global minima at 180° with reasonably high energy barriers present (see ESI:† Fig. S1). Therefore, the original RB potentials were used for these dihedrals (which have minima at 0/180°) with modifications made only to the magnitude of the barrier height. As a result, TTBC/BIC mesogens are planar with respect to the aromatic rings.
3.2 Potentials of mean force
The free energies of association, ΔGassoc, evaluated from the PMFs in this work are summarised in Table 1. The error on ΔGassoc is estimated by propagation of the errors for each data point in the PMF. For dimerisation, the ΔGassoc values determined for all four cyanine dyes are in the range of 8 to 15kBT. Typical values extracted from experimental studies of chromonic systems are in the range of 7 to 14kBT.72–76 These binding energies are also consistent with other recent atomistic simulation studies of self-assembling chromonic mesogens and dyes (Sunset Yellow:41 7kBT, TP6EO2M:42 12kBT and a thiacyanine dye:43 14kBT).| Molecule | ΔGassoc/kBT | r assoc/nm | |
|---|---|---|---|
| Dimer | PIC | 8.0 ± 0.6 | 0.43 |
| PCYN | 13.9 ± 0.3 | 0.42 | |
| TTBC | 14.4 ± 0.4 | 0.42 | |
| BIC | 15.3 ± 0.3 | 0.45 | |
| Trimer | PIC | 6.1 ± 0.4 | 0.65 |
| PCYN | 11.2 ± 0.1 | 0.59 | |
| TTBC | 12.7 ± 0.8 | 0.60 | |
| BIC | 10.3 ± 0.6 | 0.69 | |
| Tetramer | PIC | 5.5 ± 0.5 | 0.84 |
| PCYN | 11.7 ± 0.2 | 0.76 | |
| TTBC | 10.6 ± 0.2 | 0.79 | |
| BIC | 9.1 ± 0.3 | 0.94 |
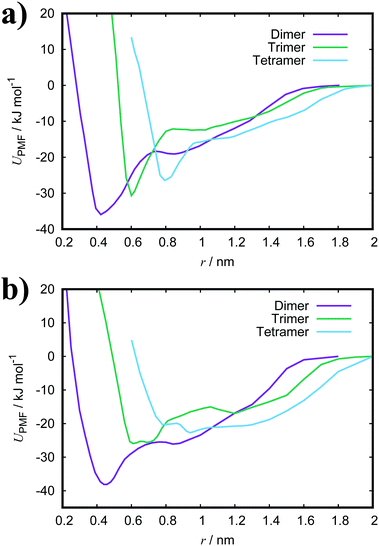
Fig. 3(a) shows the PMFs for the pulling of a molecule from a dimer, trimer and tetramer of PIC chloride. The free energy of association, ΔGassoc, is defined as the maximum well depth of UPMF(r). The global minimum is at an intermolecular COM distance of 0.43 nm with a ΔGassoc value of 8.0kBT. Reported values77–79 of ≈5.3kBT, from experimental measurements for the dimerisation constant, compare favourably with our results; though interestingly, the trimer/tetramer values for ΔGassoc (discussed below) are in even closer agreement. The lowest energy configurations for the dimer correspond to H-aggregation of the molecules. This configuration provides maximum overlap of the cores and is thermodynamically favourable. Moreover, the PMF has a plateau after the global minimum centred at ≈0.8 nm. Configurations corresponding to this region represent J-aggregation and are characterised by overlap of only one of the quinoline units for each molecule.
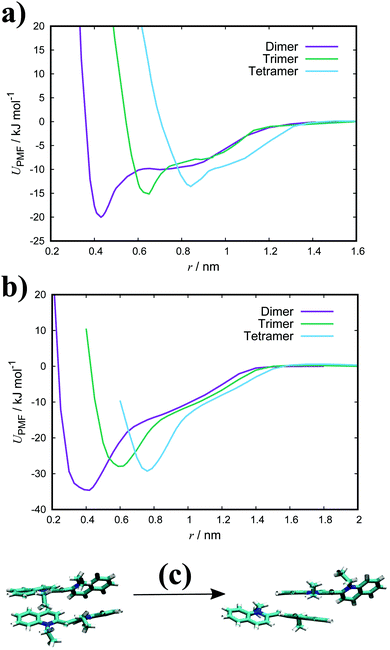 | ||
| Fig. 3 PMFs for a dimer, trimer and tetramer of (a) PIC and (b) PCYN in TIP3P water at 300 K with snapshots of dimer structures (c) along the reaction coordinate for PIC. | ||
For the trimer/tetramer, the COM distance of molecules in the stack were constrained to 0.43 nm and the sampling was performed relative to the COM of the stack and the pulled molecule. This results in a shift of the PMFs compared to the dimer. We observe that the binding energies for a trimer and tetramer (of PIC) are lower than that for the dimer. Generally, self-assembly in these types of system is considered isodesmic: the addition of a new molecule to a stack provides more or less the same free energy increment, independent of the size of the aggregate.80–82 It is found that aggregation here is “quasi-isodesmic”, a property observed in chromonics previously.41,42,83 This effect is indicated to be entropic in origin; the molecules in the middle of a stack experience a restriction in orientational freedom and, thus, dimers are slightly preferred over small aggregates (see Section 3.3 for further examination of the thermodynamics).42 As with the dimer, configurations extracted from the minimum of the PMFs for both the trimer and tetramer correspond to H-aggregation (see ESI:† Fig. S3 for example snapshots).
For PCYN (see Fig. 3(b) for the PMF profiles), the free energies of association determined are higher than that for PIC. This could arise from the differences in the magnitude of the twist between the quinoline units for each species. The slightly more extended core in PCYN allows the aromatic rings to adopt a small twist of 12°, whereas PIC exhibits a greater twist of 24°. This greater divergence from planarity affects the overlap of the molecules in the dimeric state and leads to a lower binding constant.22 Moreover, it is found that the tendency to form aggregates increases with the size of the core and length of the polymethine segment.1,40,84 The “quasi-isodesmic” pattern of aggregation is also observed again in PCYN as with PIC and the configurations observed in the minima of the PMFs all correspond to H-aggregation. Experimentally observed binding energies for the dimer of PCYN chloride,85 8.3kBT, and its acetate salt,86 10.3kBT, are in good agreement with our results. However, the experimental values are (again) closer to our measured trimer/tetramer results for ΔGassoc.
Both TTBC and BIC share a common mesogenic core, differing in the additional mesylate groups on BIC. It is expected that their binding energies would be similar and this is indeed the case (see Fig. 4 for the PMF profiles). The ΔGassoc values obtained are slightly greater than that for PCYN. The dimer structures exhibited by both TTBC and BIC are subtly offset so as to minimise overlap of the peripheral chlorine groups. Snapshots of dimer configurations exhibited in the minima of the PMFs are shown in Fig. 5. Despite this slight offset, these dimers are still characterised as H-aggregate structures. These dyes partially exhibit the “quasi-isodesmic” aggregation property as seen in PCYN and PIC. However, there is a noticeable decrease, compared to PIC and PCYN, in binding energies going from trimerisation to tetramerisation for both species. This is particularly apparent in TTBC, where there is a systematic decrease in the association free energy as the number of molecules in the stack increases. For BIC, the ΔGassoc value for the trimer is 5kBT lower than that for the dimer, with the tetramer binding energy being similar to the trimer value. These results for TTBC and BIC indicate a possible shift away from H-aggregation, or from the configurations observed in the PMFs, as the number of molecules in the aggregate increases.
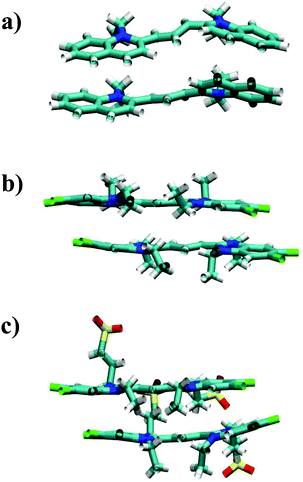 | ||
| Fig. 5 Example structures of dimers exhibited in the minimum of the PMFs for (a) PCYN, (b) TTBC and (c) BIC. | ||
3.3 Thermodynamic analysis
To gain insight into the driving forces of aggregation, the free energy of association can be separated into an enthalpic and an entropic contribution. This can be determined by calculating ΔGassoc from PMFs at various temperatures. Here, the binding energies of a dimer and trimer of PIC and PCYN were calculated at five temperatures in the range of 280–320 K. Using | (4) |
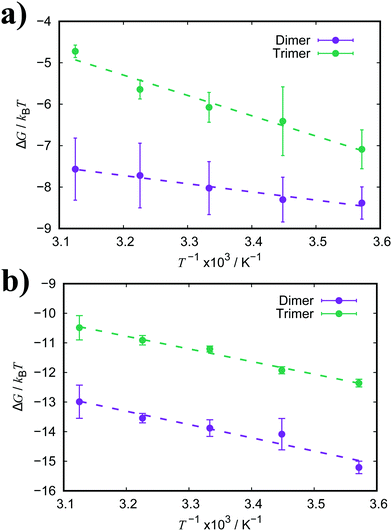 | ||
| Fig. 6 Free energy of association, ΔGassoc, for a dimer and trimer of (a) PIC and (b) PCYN as a function of temperature. Dashed lines represent the fitted linear functions. | ||
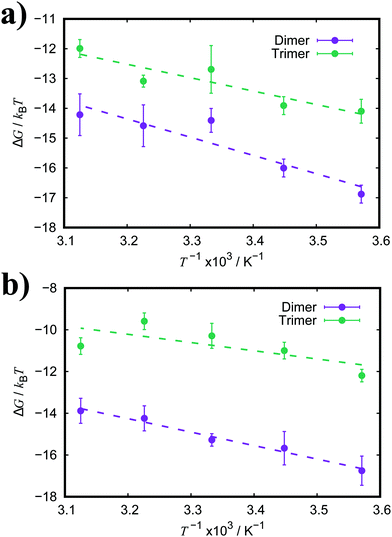 | ||
| Fig. 7 Free energy of association, ΔG, for a dimer and trimer of (a) TTBC and (b) BIC as a function of temperature. Dashed lines represent the fitted linear functions. | ||
| Molecule | ΔHassoc/kJ mol−1 | −TΔSassoc/kJ mol−1 | |
|---|---|---|---|
| Dimer | PIC | −17 ± 3 | −3.5 ± 1.7 |
| PCYN | −37 ± 6 | 2.6 ± 0.9 | |
| TTBC | −51 ± 12 | 13 ± 9 | |
| BIC | −54 ± 5 | 16 ± 5 | |
| Trimer | PIC | −40 ± 8 | 26 ± 5 |
| PCYN | −36 ± 2 | 7 ± 2 | |
| TTBC | −37 ± 9 | 5 ± 2 | |
| BIC | −33 ± 10 | 6 ± 4 |
For both PIC and PCYN dimerisation, it is found that the enthalpic term is much higher than the entropic contribution to the aggregation process. This indicates that the association of monomers is driven by favourable attractive forces rather than a strong hydrophobic effect arising from the release of water from the interaction with hydrophobic rings. In contrast, it has been shown that the aggregation of a non-ionic chromonic molecule, TP6EO2M, has a larger entropic contribution, which is up to 1.5 times larger than the enthalpic term.42,72 This suggests that the ionic nature of these cyanine dyes shifts the driving forces of association. Noting also recent MD work, characterising the dimerisation thermodynamics for an anionic perylene bisimide dye, showed that the enthalpic component was much greater than the entropic term, and the latter was unfavourable with respect to association.49
For PCYN, the entropic component to ΔGassoc is small and unfavourable for both dimerisation and trimerisation, while the enthalpic contribution is very similar for both dimerisation and trimerisation. This shows that the “quasi-isodesmic” aggregation observed for PCYN (i.e. not fully isodesmic) arises from the entropic change between dimer and trimer association for this species. In experiment, steady-state absorption spectroscopy provides approximate values for the enthalpy and entropy changes for the dimerisation of PCYN of −28 ± 3 kJ mol−1 and −0.1 ± 0.1 kJ mol−1, respectively (at 300 K).16 While our predicted association enthalpy is similar in magnitude, the entropic contribution we obtain is slightly larger. For PIC, the entropic contribution towards ΔGassoc is strongly unfavourable for the trimerisation case. However, this system shows enthalpy-entropy compensation with the enthalpic term increasing for trimers. The dimer–trimer difference probably arises from the higher orientational freedom of the dimeric species in solution compared to trimeric state.
The enthalpic and entropic contributions to the binding energies for both TTBC and BIC are very similar. For dimerisation, the process is greatly favourable with respect to enthalpy, and the enthalpic component is much larger than the entropic one. The unfavourable contribution from the association entropy is slightly higher for TTBC and BIC than for PIC and PCYN. Interestingly, it seems the presence of the additional ionic groups in BIC does not affect the ratio of enthalpy/entropy in the free energy of association compared to TTBC, indicating that the chemical identity of the core is the key aspect in the binding of these dyes. As for trimerisation, we see a decrease in both the enthalpic and entropic components to association, compared to the dimer, for both TTBC and BIC. This is in contrast to PCYN (where only the entropic component changed) and shows that the “quasi-isodesmic” behaviour observed for TTBC and BIC is due, in these two cases, to an overall weakening of ΔHassoc.
3.4 Self-assembly in aqueous solution
| d = di·rij, | (5) |
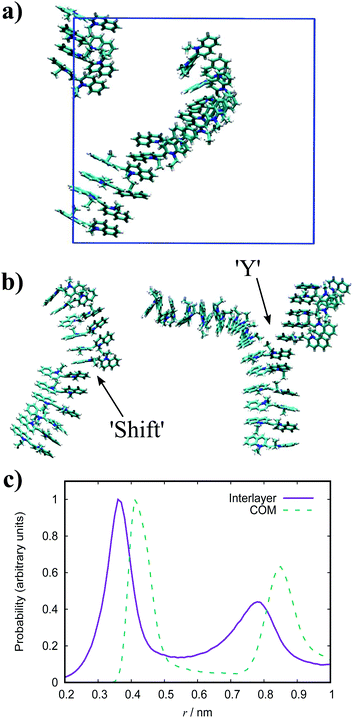
The dynamic nature of the assemblies can give rise to defects when smaller stacks merge together. In chromonic systems, such as Sunset Yellow (SSY), it is proposed that such aggregates contain stacking faults, which complicate their structure beyond that of simple rods. This explains the discrepancy that the persistence length of SSY aggregates is too low to produce the orientational order that it exhibits.74 This results in the definition of two spatial scales; a short scale where stacking is correlated, characterised by the persistence length, and a long scale comprising the whole aggregate, which is composed of branches for which correlation is lost due to defects. These defects can manifest as a molecular lateral shift (shift’ junction) or a 3-fold Y junction, which causes the splitting of the column into branches. These Y junctions have previously been observed in a variety of soft matter systems such as block copolymers and worm-like micelles.87–89 Here, we observe the presence of these defects in aggregates of PIC chloride, disrupting the H-type stacking and incorporating J-aggregate motifs into the structures (Fig. 8(b)). To our knowledge, this is the first reported observation of Y junctions in simulations. The propensity for H-aggregation is explained in the PMFs attained, with the possibility of J-aggregation behaviour also predicted. Furthermore, the tendency for the stacks to be dynamic, rather than form one stable structure, can be attributed to the weak binding energy between the molecules. For the self-assembly of neutral monomers in solution, an expression for the average aggregation number, 〈n〉, has been determined in previous work90,91 as follows
 | (6) |
 where lB is the Bjerrum length, w is the width of the monomer and
 ![[small tau, Greek, tilde]](https://www.rsc.org/images/entities/i_char_e0e5.gif) is the effective charge of the rod (
is the effective charge of the rod (![[small tau, Greek, tilde]](https://www.rsc.org/images/entities/i_char_e0e5.gif) e ∼ e/lB). As concentration increases, the electrostatic correction decreases as counterions dispersed in solution are packed nearer to the stacks, which increases their screening effect on the monomers. This also implies that ionic additives will have a significant effect on the character of the aggregates.
e ∼ e/lB). As concentration increases, the electrostatic correction decreases as counterions dispersed in solution are packed nearer to the stacks, which increases their screening effect on the monomers. This also implies that ionic additives will have a significant effect on the character of the aggregates.
For PIC chloride, application of eqn (6) yields an average aggregation number of ≈16, where E is taken to be the association free energy for dimerisation. The use of the binding energy as E is reasonable as the PMFs should effectively contain contributions due to the electrostatics/concentration. The volume fraction is estimated from the solvent accessible surface area93 of the solute (using a standard probe radius of 0.14 nm), and calculating its internal volume, which provides a value of ϕ = 0.09. It is noted that the binding energy used here corresponds to a more dilute concentration; on which its dependence is expected to have a minor effect on the magnitude. The “quasi-isodesmic” nature observed here suggests that the trimer/tetramer binding energy is a better approximation for the scission energy. This returns a value of 〈n〉 ≈ 6 for E = 6.1kBT. This value appears to be a more appropriate prediction based on the structures observed in the simulations, where defects occur between rigid sections of 4–8 molecules. This also implies that the reduction in binding energy for a trimer/tetramer could be an effect of increased electrostatic repulsion between the monomers as the stack size increases. The relatively low persistence length associated with the estimated value of 〈n〉 (L ≈ 2.2 nm) explains the propensity for the defects observed and the flexibility of the aggregates here.
Experimentally, PIC chloride has been thoroughly studied with numerous observations reported. In the absorption spectrum for this species, a J-band is clearly exhibited along with what is thought to be a broad H-band overlapping with the monomeric vibronic progression.94,95 Furthermore, the initial stages of aggregation produce blue-shifted bands which diminish as the J-band emerges,96,97 and is concurrent with the onset of fibres. Individual fibres are estimated to have an average width of 2.3–2.89 nm38,39 corresponding to an estimated average aggregation number of ≈3000 based on geometric packing models coupled with spectroscopic arguments. Suggestions for the structure within aggregates has been a matter of debate for decades and has produced a diverse ensemble of models. Initially, Scheibe and Kandler proposed a pile-of-coins’ structure with the long axis of each monomer being perpendicular to the aggregate axis,98 but this model is not consistent with the required displacement of transition dipole moments proposed by Kasha.9 While there are discussions that Kasha theory has limitations,99,100 further models of offset monomers with the molecular long axes aligned parallel to the aggregate axis have been suggested in subsequent years;101 these include a brickwork arrangement,102 threaded double-string models103 and rods composed of single strands packed in a herringbone arrangement.38
In the simulation results presented for PIC, we only observe straightforward stacks of H-aggregate character with no inclination shown for formation of brickwork or cylindrical structures. While the J-aggregate motif is present in these assemblies, it is not abundant or dominant enough to account for the experimental observations. It is experimentally observed that formation of H-aggregates is the first stage of self-assembly, where there is a shift to J-aggregation over time with increasing concentration.38,98 The existence of a MHJ equilibrium here suggests that our simulations correspond to a regime of competition between the different modes of self-assembly, preceding the emergence of large-scale J-aggregation. This transition may be induced by sufficiently increasing the system size and concentration, together with the timescale of the simulations. We note that previous AA MD simulation work has been reported on PIC chloride which, despite significant differences between the force fields, match the structures obtained here.52
The absorption spectrum for PCYN shows a pronounced H-band at 511 nm, with cryo-TEM revealing tubular aggregates for this species.14 Furthermore, it is observed that these H-aggregates transform into J-aggregates over the experimental timescale of weeks. The aforementioned study suggests that these nanotubes are single-walled with the molecules aligned parallel to the tube axis. Similarly, Tiddy and co-workers reported nematic and hexagonal chromonic phases of the acetate salt, with SAXS measurements indicating single-walled nanotubes of H-aggregate character.17 The latter study, however, suggests that the molecules prefer a perpendicular orientation along the aggregate axis. Our simulation results display the expected H-aggregation of PCYN but, like PIC, do not show any proclivity towards the formation of higher-order aggregates beyond stacks.
With respect to the molecular orientation within the tubular structures, the simulations cannot offer definitive insight. However, there are a number of possible modes of evolution into nanotubes based on our results: an end-to-end wrapping of a stack into ringed subunits to form the basis of a tube, a helical curling of a long stack to form a continuous tube, or a side-by-side alignment of stacks into a tube. The isotropic nature of stacks in solution observed here is expected as further organisation into nematic/hexagonal chromonic phases occurs after formation of elongated tube structures.14,17,38
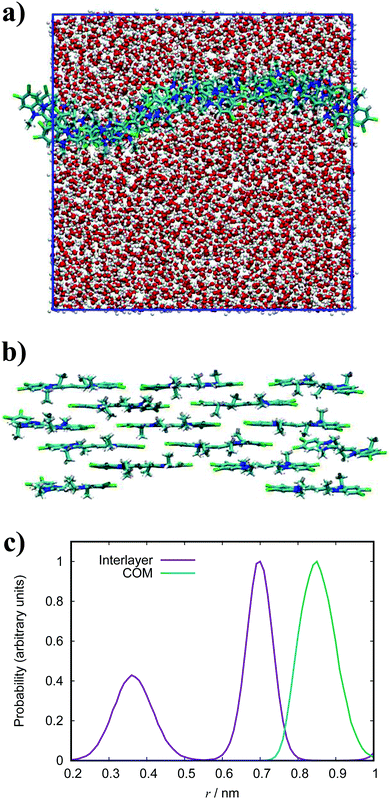
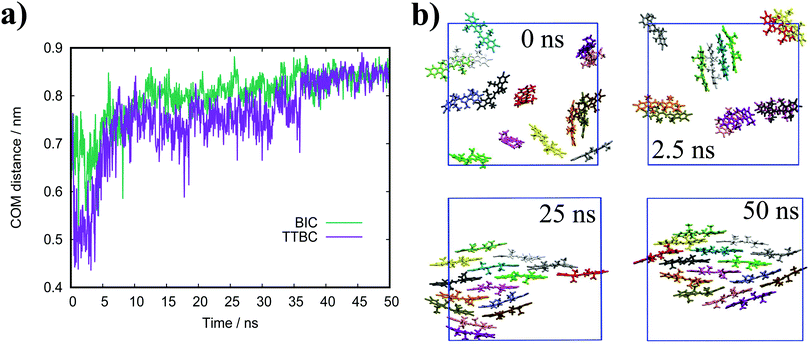 | ||
| Fig. 11 (a) Evolution of the average COM distance over the first 50 ns of simulation. (b) Simulation snapshots of TTBC at various points in the initial stages of self-assembly. | ||
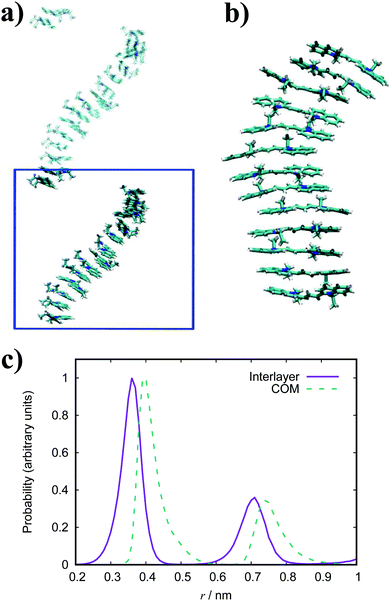
In general, the structure we obtain via MD simulation is strikingly similar to the proposed smectic chromonic mesophase observed in cyanine dyes previously.8,12,13 This mesophase consists of sheets, with a brickwork arrangement of molecules within the layer, which are in equilibrium with other layers in solution akin to a lamellar phase and are suggested to curl up to form hollow tubes.12 XRD measurements indicate that the layers are one molecule thick,8 the intralayer separation is ≈0.35 nm13 and that the molecular long axis lies parallel to the layer plane.12 Furthermore, dilution of these systems results in the additional water being incorporated into the space between layers, and increasing the dye concentration increases the width of the layers (perpendicular to the layer axis). In our work, the 10 wt% system of 15 molecules self-assembles into a single layer, which is fully substantiated by the experimental observations. To investigate this mesophase, we seeded a larger system of 120 molecules by replicating the simulation box of the 15 molecule single layer (and solvent) in each dimension twice. This system (see Fig. 12), which contains four separate layers, remains stable over several hundred nanoseconds where the layers rotate in solution over time. The layers do not merge or interact across the simulation timescale here, so we cannot discount the prospect that one large aggregate will form eventually. The prevalence and stability of the smectic chromonic phase here suggests that it is a precursor state, which exists over a long timescale, before the evolution into tubular architectures.
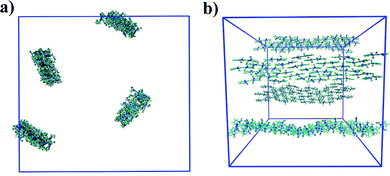 | ||
| Fig. 12 Simulation snapshots of 10 wt% system of 120 molecules for TTBC viewed parallel (a) and perpendicular (b) to the layer axes. | ||
An assortment of aggregate structures and optical spectra have been reported for TTBC, where three types of J-aggregate are observed, depending on the counterion and method of preparation. The chloride salt exhibits an absorption spectrum consisting of a strong H-band and a weak J-band (type I spectrum), and cryo-TEM reveals fibrous networks of tubes with unimolecular thickness.21 This type of spectrum is attributed to Davydov splitting and is expected to have two molecules in the unit cell of the crystal structure.104 A 2D herringbone model for the molecular structure was proposed for this type of J-aggregate,22 but it has been suggested that a rolled up herringbone arrangement into nanotubes is more likely.21 The stability of such tubular structures for TTBC-Cl have been studied with MD simulation, where tubes were constructed by wrapping of two types of crystal lattices.20 Two crystal structures for TTBC solvates have been found: a herringbone arrangement with two molecules per unit cell (DYEM) and a brickwork arrangement with one molecule per unit cell (DYEA).105 The brickwork model for DYEA has been reported for air-dried TTBC aggregates on a mica surface, where monolayers of stacked TTBC molecules were observed.21 These structures exhibited an absorption spectrum containing a weak, single J-band (type II spectrum). The iodide salt exhibits both a type I spectrum and type III spectrum (J-band with a monomer band), depending on the solvent pH.21 The type III J-aggregate is suggested to contain linearly stacked dye molecules in a tubular shape with the molecular long axes arranged parallel to the tube axis. While our simulation results display the brickwork model observed experimentally, we do not see any indication for the herringbone arrangement despite its ubiquity in reported work. We note in passing that our simulations were performed in pure water and, so, the possible effect of the presence of other species in solution (such as NaCl, MeOH, etc.) on our structures is not known. The brickwork model accounts for the type II and type III J-aggregates and, supposing the nanotubes are formed by rolling of these layers, further supports the suggestion that our results correspond to an intermediate state approaching large-scale aggregate formation.
| θ = cos−1(vi·vj), | (7) |
| vn = Ln × dn. | (8) |
The simulated structures we obtain correspond to the brickwork model within the smectic chromonic phase observed in cyanine dyes, as discussed for TTBC. Seeding a larger system of 120 molecules for MD simulation yields the same behaviour observed for the analogous TTBC system. Experimentally, the absorption spectrum for this species shows a single, sharp J-band;23,26 which suggests a brickwork arrangement of dye molecules as observed in our work. In contrast to other J-aggregates, the morphology of extended BIC J-aggregates is revealed to be mainly spherical with a particle diameter of 20–100 nm.23,26 The formation of any of the higher order aggregates seen in literature has not been observed in this work. However, we suggest that such morphologies of rods or spheres could nucleate from the structures we have obtained by MD simulation here.
In comparison to the PIC and PCYN systems, TTBC and BIC behave in a completely different manner in their self-assembly. The fundamental difference between these pairs of cyanine dyes is the structure of the mesogenic core. The length of the polymethine chain or the presence of heteroatoms significantly alters the charge distribution across the aromatic core, which can affect both the strength of binding as well as the modes of self-assembly (i.e. orientations of a neighbouring molecule to minimise/maximise electrostatic interactions). Another factor behind the differences is the molecular shape. PIC and PCYN are elongated disks but feature a small twist within the core, which creates an offset between the aromatic segments. This affects the overlap of adjacent molecules and, potentially, limits the number of possible approaches for molecules to associate. In contrast, TTBC and BIC have a bent, V-like shape and a planar core with no twist between the two halves of the molecule. The planarity of these two mesogens allow for a range of slippage angles to be accessed between molecules in an aggregate.
4 Conclusions
We have performed atomistic molecular dynamics simulations on four ionic cyanine dyes. For each species, we have studied the thermodynamics of their association and provided insight into the self-assembly of these complex systems in aqueous solution. We applied systematic modifications, using quantum chemical methods, to GAFF to improve the representability of the force field and obtain free energies of association consistent with experimental studies. Decomposition of the binding energies into enthalpic and entropic components confirms that the association of these dyes is driven by attractive interactions rather than the hydrophobic effect. We have observed the spontaneous self-assembly into systems of H- and J-aggregate character, with two classes of stacked structures revealed. For PIC, we see H-aggregate stacks that contain shift and Y junctions, and the J-aggregation motif is incorporated as stacking defects. By increasing the length of the polymethine chain, as in PCYN, a greater rigidity of the stacks is discerned. We observe the formation of a J-aggregate consisting of a single-molecule thick, brickwork sheet structure for TTBC, which is inherent to the smectic chromonic phase. A similar structure is obtained for BIC which shows a strong preference for antiparallel orientation between adjacent molecules along the stacked structure. The seeding of these sheet structures into the layered arrangement of the smectic chromonic phase with further MD simulation verifies the stability of this mesophase for these dyes. We propose that these assemblies correspond to an intermediate state, which precedes the organisation into tubular, or other higher-order, architectures. However, the corresponding length and timescales required to study these structures are intractable for atomistic simulation. We are currently developing coarse-grained simulation models to study this scale of self-assembly and investigating a range of parametrisation approaches, to construct coarse-grained models that can capture both structure and thermodynamics,106–109 in order to study chromonic mesophases and the large-scale aggregation of cyanine dyes.Conflicts of interest
There are no conflicts to declare.Acknowledgements
The authors would like to thank Durham University for providing computer time on its high performance computer system, Hamilton. G. Y. would like to thank Durham University and EPSRC for providing studentship funding.References
- F. Würthner, T. E. Kaiser and C. R. Saha-Möller, Angew. Chem., Int. Ed., 2011, 50, 3376–3410 CrossRef PubMed.
- A. H. Herz, Adv. Colloid Interface Sci., 1977, 8, 237–298 CrossRef CAS.
- G. Scheibe, Angew. Chem., 1936, 49, 563 CAS.
- G. Scheibe, Angew. Chem., 1937, 50, 212–219 CrossRef CAS.
- E. E. Jelley, Nature, 1936, 138, 1009 CrossRef CAS.
- E. E. Jelley, Nature, 1937, 139, 631 CrossRef CAS.
- W. West and S. Pearce, J. Phys. Chem., 1965, 69, 1894–1903 CrossRef CAS.
- W. J. Harrison, D. L. Mateer and G. J. T. Tiddy, Faraday Discuss., 1996, 104, 139–154 RSC.
- M. Kasha, Radiat. Res., 1963, 20, 55–70 CrossRef CAS.
- J. Lydon, J. Mater. Chem., 2010, 20, 10071–10099 RSC.
- M. R. Tomasik and P. J. Collings, J. Chem. Phys. B, 2008, 112, 9883–9889 CrossRef CAS PubMed.
- G. J. T. Tiddy, D. L. Mateer, A. P. Ormerod, W. J. Harrison and D. J. Edwards, Langmuir, 1995, 11, 390–393 CrossRef CAS.
- W. J. Harrison, D. L. Mateer and G. J. T. Tiddy, J. Phys. Chem., 1996, 100, 2310–2321 CrossRef CAS.
- H. von Berlepsch, K. Ludwig and C. Böttcher, Phys. Chem. Chem. Phys., 2014, 16, 10659–10668 RSC.
- S. J. Khouri and V. Buss, J. Solution Chem., 2010, 39, 121–130 CrossRef CAS.
- H. Min, J. Park, J. Yu and D. Kim, Bull. Korean Chem. Soc., 1998, 19, 650–654 CAS.
- C. Rodríguez-Abreu, C. Aubrey-Torres and G. J. T. Tiddy, Langmuir, 2011, 27, 3067–3073 CrossRef PubMed.
- E. K. Batchelor, S. Gadde and A. E. Kaifer, Supramol. Chem., 2010, 22, 40–45 CrossRef CAS.
- K. Manna and A. K. Panda, Spectrochim. Acta, Part A, 2009, 74, 1268–1274 CrossRef PubMed.
- C. Friedl, T. Renger, H. von Berlepsch, K. Ludwig, M. S. Am Busch and J. Megow, J. Phys. Chem. C, 2016, 120, 19416–19433 CrossRef CAS PubMed.
- H. von Berlepsch and C. Böttcher, Langmuir, 2013, 29, 4948–4958 CrossRef PubMed.
- B. Birkan, D. Gülen and S. Özçelik, J. Phys. Chem. B, 2006, 110, 10805–10813 CrossRef CAS PubMed.
- A. V. Sorokin, I. Y. Ropakova, R. S. Grynyov, M. M. Vilkisky, V. M. Liakh, I. A. Borovoy, S. L. Yefimova and Y. V. Malyukin, Dyes Pigm., 2018, 152, 49–53 CrossRef CAS.
- A. Pawlik, A. Ouart, S. Kirstein, H. W. Abraham and S. Daehne, Eur. J. Org. Chem., 2003, 3065–3080 CrossRef CAS.
- S. Özçelik, I. Özçelik and D. L. Akins, Appl. Phys. Lett., 1998, 73, 1949–1951 CrossRef.
- I. Filimonova, S. Yefimova and A. V. Sorokin, Funct. Mater., 2012, 19, 348–353 Search PubMed.
- M. S. Bradley, J. R. Tischler and V. Bulovic, Adv. Mater., 2005, 17, 1881–1886 CrossRef CAS.
- S. E. Sheppard, R. H. Lambert and R. D. Walker, J. Chem. Phys., 1939, 7, 265–273 CrossRef CAS.
- M. S. A. Abdel-Mottaleb, M. M. S. Abdel-Mottaleb, H. S. Hafez and M. Saif, Int. J. Photoenergy, 2014, 2014, 579476 CrossRef.
- S. E. Sheppard and H. Crouch, J. Phys. Chem., 1928, 32, 751–762 CrossRef CAS.
- I. S. Lim, F. Goroleski, D. Mott, N. Kariuki, W. Ip, J. Luo and C. Zhong, J. Phys. Chem. B, 2006, 110, 6673–6682 CrossRef CAS PubMed.
- A. S. Elsherbiny, M. A. Salem and A. A. Ismail, Chem. Eng. J., 2012, 200, 283–290 CrossRef.
- C. Didraga, A. Pugžlys, P. R. Hania, H. von Berlepsch, K. Duppen and J. Knoester, J. Phys. Chem. B, 2004, 108, 14976–14985 CrossRef CAS.
- Z. Jin, Z. Li, K. Kasatani and H. Okamoto, J. Lumin., 2007, 122, 427–429 CrossRef.
- S. B. Shiring, R. L. Gieseking, C. Risko and J. Brédas, J. Phys. Chem. C, 2017, 121, 14166–14175 CrossRef CAS.
- F. Sivandzade, A. Bhalerao and L. Cucullo, Bio-Protoc., 2019, 9, e3128 Search PubMed.
- J. O. Escobedo, O. Rusin, S. Lim and R. M. Strongin, Curr. Opin. Chem. Biol., 2010, 14, 64–70 CrossRef CAS PubMed.
- H. von Berlepsch, C. Böttcher and L. Dähne, J. Phys. Chem. B, 2000, 104, 8792–8799 CrossRef CAS.
- W. P. Bricker, J. L. Banal, M. B. Stone and M. Bathe, J. Chem. Phys., 2018, 149, 024905 CrossRef PubMed.
- S. Kirstein and S. Daehne, Int. J. Photoenergy, 2006, 5, 1–21 Search PubMed.
- F. Chami and M. R. Wilson, J. Am. Chem. Soc., 2010, 132, 7794–7802 CrossRef CAS.
- A. Akinshina, M. Walker, M. R. Wilson, G. J. T. Tiddy, A. J. Masters and P. Carbone, Soft Matter, 2015, 11, 680–691 RSC.
- R. Thind, M. Walker and M. R. Wilson, Adv. Theory Simul., 2018, 1, 1800088 CrossRef.
- O. M. M. Rivas and A. D. Rey, Carbon, 2016, 110, 189–199 CrossRef.
- O. M. M. Rivas and A. D. Rey, Mol. Syst. Des. Eng., 2017, 2, 223–234 RSC.
- O. M. M. Rivas and A. D. Rey, J. Phys. Chem. B, 2019, 123, 1718–1732 CrossRef.
- O. M. M. Rivas and A. D. Rey, J. Phys. Chem. B, 2019, 123, 8995–9010 CrossRef.
- Z. Chen, B. Fimmela and F. Würthner, Org. Biomol. Chem., 2012, 10, 5845–5855 RSC.
- J. Baz and N. Hansen, J. Phys. Chem. C, 2019, 123, 8027–8036 CrossRef CAS.
- K. Bag, R. Halder, B. Jana and S. Malik, J. Phys. Chem. C, 2019, 123, 6241–6249 CrossRef CAS.
- F. Haverkort, A. Stradomska, A. H. de Vries and J. Knoester, J. Phys. Chem. B, 2013, 117, 5857–5867 CrossRef CAS PubMed.
- F. Haverkort, A. Stradomska and J. Knoester, J. Phys. Chem. B, 2014, 118, 8877–8890 CrossRef CAS PubMed.
- J. Wang, R. M. Wolf, J. W. Caldwell, P. A. Kollman and D. A. Case, J. Comput. Chem., 2004, 25, 1157–1174 CrossRef CAS PubMed.
- J. Wang, W. Wang, P. A. Kollman and D. A. Case, J. Mol. Graphics Modell., 2006, 25, 247–260 CrossRef CAS PubMed.
- A. W. S. da Silva and W. F. Vranken, BMC Res. Notes, 2012, 5, 367 CrossRef PubMed.
- W. L. Jorgensen, J. Chandrasekhar, J. D. Madura, R. W. Impey and M. L. Klein, J. Chem. Phys., 1983, 79, 926–935 CrossRef CAS.
- B. Jójárt and T. A. Martinek, J. Comput. Chem., 2007, 28, 2051–2058 CrossRef.
- N. J. Boyd and M. R. Wilson, Phys. Chem. Chem. Phys., 2015, 17, 24851–24865 RSC.
- N. J. Boyd and M. R. Wilson, Phys. Chem. Chem. Phys., 2018, 20, 1485–1496 RSC.
- C. M. Breneman and K. B. Wiberg, J. Comput. Chem., 1990, 11, 361–373 CrossRef CAS.
- M. J. Frisch, G. W. Trucks, H. B. Schlegel, G. E. Scuseria, M. A. Robb, J. R. Cheeseman, G. Scalmani, V. Barone, G. A. Petersson, H. Nakatsuji, X. Li, M. Caricato, A. Marenich, J. Bloino, B. G. Janesko, R. Gomperts, B. Mennucci, H. P. Hratchian, J. V. Ortiz, A. F. Izmaylov, J. L. Sonnenberg, D. Williams-Young, F. Ding, F. Lipparini, F. Egidi, J. Goings, B. Peng, A. Petrone, T. Henderson, D. Ranasinghe, V. G. Zakrzewsk, J. Gao, N. Rega, G. Zheng, W. Liang, M. Hada, M. Ehara, K. Toyota, R. Fukuda, J. Hasegawa, M. Ishida, T. Nakajima, Y. Honda, O. Kitao, H. Nakai, T. Vreven, K. Throssell, J. J. A. Montgomery, J. E. Peralta, F. Ogliaro, M. Bearpark, J. J. Heyd, E. Brothers, K. N. Kudin, V. N. Staroverov, T. Keith, R. Kobayashi, J. Normand, K. Raghavachari, A. Rendell, J. C. Burant, S. S. Iyengar, J. Tomasi, M. Cossi, J. M. Millam, M. Klene, C. Adamo, R. Cammi, J. W. Ochterski, R. L. Martin, K. Morokuma, O. Farkas, J. B. Foresman and D. J. Fox, Gaussian 09, Revision A.02, Gaussian, Inc., Wallingford CT, 2016 Search PubMed.
- S. Pronk, S. Páll, R. Schulz, P. Larsson, P. Bjelkmar, R. Apostolov, M. R. Shirts, J. C. Smith, P. M. Kasson, D. van der Spoell, B. Hess and E. Lindahl, Bioinformatics, 2013, 29, 845–854 CrossRef CAS PubMed.
- U. Essmann, L. Perera, M. L. Berkowitz, T. Darden, H. Lee and L. G. Pedersen, J. Chem. Phys., 1995, 103, 8577–8593 CrossRef CAS.
- H. J. C. Berendsen, J. P. M. Postma, W. F. van Gunsteren, A. DiNola and J. R. Haak, J. Chem. Phys., 1984, 81, 3684–3690 CrossRef CAS.
- S. Nosé, J. Chem. Phys., 1984, 81, 511–519 CrossRef.
- W. G. Hoover, Phys. Rev. A: At., Mol., Opt. Phys., 1985, 31, 1695–1697 CrossRef PubMed.
- M. Parrinello and A. Rahman, J. Appl. Phys., 1981, 52, 7182–7190 CrossRef CAS.
- B. Hess, H. Bekker, H. J. C. Berendsen and J. G. E. M. Fraaije, J. Comput. Chem., 1997, 18, 1463–1472 CrossRef CAS.
- A. Villa, C. Peter and N. F. A. van der Vegt, Phys. Chem. Chem. Phys., 2009, 11, 2077–2086 RSC.
- A. Villa, N. F. A. van der Vegt and C. Peter, Phys. Chem. Chem. Phys., 2009, 11, 2068–2076 RSC.
- C. Li, J. Shen, C. Peter and N. F. A. van der Vegt, Macromolecules, 2012, 45, 2551–2561 CrossRef CAS.
- J. F. Hubbard, PhD thesis, University of Leeds, 1997.
- V. R. Horowitz, L. A. Janowitz, A. L. Modic, P. A. Heiney and P. J. Collings, Phys. Rev. E: Stat., Nonlinear, Soft Matter Phys., 2005, 72, 041710 CrossRef PubMed.
- H. S. Park, S. W. Kang, L. Tortora, Y. Nastishin, D. Finotello, S. Kumar and O. D. Lavrentovich, J. Phys. Chem. B, 2008, 112, 16307–16319 CrossRef CAS PubMed.
- A. J. Dickinson, N. D. LaRacuente, C. B. McKitterick and P. J. Collings, Mol. Cryst. Liq. Cryst., 2009, 509, 751–762 CAS.
- C. B. McKitterick, N. L. Erb-Satullo, N. D. LaRacuente, A. J. Dickinson and P. J. Collings, J. Phys. Chem. B, 2010, 114, 1888–1896 CrossRef CAS.
- G. Scheibe, Elektrochem, 1948, 52, 283 CAS.
- B. Neumann and P. Pollmann, Bunsen-Ges. Phys. Chem., Ber., 1996, 100, 15–19 CrossRef CAS.
- B. Neumann and P. Pollmann, Phys. Chem. Chem. Phys., 2000, 2, 4784–4792 RSC.
- J. R. Henderson, Phys. Rev. Lett., 1996, 77, 2316–2319 CrossRef CAS PubMed.
- J. R. Henderson, Phys. Rev. E: Stat., Nonlinear, Soft Matter Phys., 1997, 55, 5731–5742 CrossRef CAS.
- J. R. Henderson, J. Chem. Phys., 2009, 130, 45101–45103 CrossRef CAS PubMed.
- M. Walker, A. J. Masters and M. R. Wilson, Phys. Chem. Chem. Phys., 2014, 16, 23074–23081 RSC.
- B. I. Shapiro, Nanotechnol. Russ., 2008, 3, 139–150 CrossRef.
- H. Naorem and S. D. Devi, J. Mol. Liq., 2012, 173, 119–123 CrossRef CAS.
- P. J. Collings, J. N. Goldstein, E. J. Hamilton, B. R. Mercado, K. J. Nieser and M. H. Regan, Liq. Cryst. Rev., 2015, 3, 1–27 CrossRef CAS.
- S. Jain and F. S. Bates, Science, 2003, 300, 460–464 CrossRef CAS PubMed.
- N. Dan, K. Shimoni, V. Pata and D. Danino, Langmuir, 2006, 22, 9860–9865 CrossRef CAS PubMed.
- A. G. Zilman and S. A. Safran, Phys. Rev. E: Stat., Nonlinear, Soft Matter Phys., 2002, 66, 051107 CrossRef CAS PubMed.
- W. M. Gelbart and A. Ben-Shaul, J. Phys. Chem., 1996, 100, 13169–13189 CrossRef CAS.
- M. E. Cates and S. J. Candau, J. Phys.: Condens. Matter, 1990, 2, 6869–6892 CrossRef CAS.
- F. C. MacKintosh, S. A. Safran and P. A. Pincus, Europhys. Lett., 1990, 12, 697–702 CrossRef.
- F. Eisenhaber, P. Lijnzaad, P. Argos, C. Sander and M. Scharf, J. Comput. Chem., 1995, 16, 273–284 CrossRef CAS.
- I. Renge and U. P. Wild, J. Phys. Chem. A, 1997, 101, 7977–7988 CrossRef CAS.
- D. Gülen and S. Özçelik, J. Lumin., 2008, 128, 834–837 CrossRef.
- B. Kopainsky, J. Hallermeier and W. Kaiser, Chem. Phys. Lett., 1981, 83, 498–502 CrossRef CAS.
- Y. Kitahama, T. Yago, A. Furube and R. Katoh, Chem. Phys. Lett., 2008, 457, 427–433 CrossRef CAS.
- G. Scheibe and L. Kandler, Naturwissenschaften, 1938, 26, 412–413 CrossRef CAS.
- K. Norland, A. Ames and T. Taylor, Photogr. Sci. Eng., 1970, 14, 295–307 CAS.
- S. Kirstein and H. Möhwald, Adv. Mater., 1995, 7, 460–463 CrossRef CAS.
- T. Förster, Naturwissenschaften, 1946, 33, 166–175 CrossRef.
- H. Bücher and H. Kuhn, Chem. Phys. Lett., 1970, 6, 183–185 CrossRef.
- E. Daltrozzo, G. Scheibe, K. Geschwind and F. Haimerl, Photogr. Sci. Eng., 1974, 18, 441–450 CAS.
- A. S. Davydov, Theory of Molecular Excitons, Plenum Press, New York, 1971 Search PubMed.
- D. Smith and H. Luss, Acta Crystallogr., Sect. B: Struct. Crystallogr. Cryst. Chem., 1972, 28, 2793–2806 CrossRef.
- M. Walker and M. R. Wilson, Soft Matter, 2016, 12, 8588–8594 RSC.
- T. D. Potter, J. Tasche, E. L. Barrett, M. Walker and M. R. Wilson, Liq. Cryst., 2017, 44, 1979–1989 CAS.
- T. D. Potter, J. Tasche and M. R. Wilson, Phys. Chem. Chem. Phys., 2019, 21, 1912–1927 RSC.
- T. D. Potter, M. Walker and M. R. Wilson, Soft Matter, 2020, 16, 9488–9498 RSC.
Footnote |
| † Electronic supplementary information (ESI) available. See DOI: 10.1039/d0cp06205g |
| This journal is © the Owner Societies 2021 |

