
 Open Access Article
 This Open Access Article is licensed under a
 Creative Commons Attribution 3.0 Unported Licence
Analysis of DNA interactions and GC content with energy decomposition in large-scale quantum mechanical calculations†
Han
Chen
 and
Chris-Kriton
Skylaris
*
and
Chris-Kriton
Skylaris
*
School of Chemistry, University of Southampton, Highfield, Southampton SO17 1BJ, UK. E-mail: c.skylaris@soton.ac.uk
First published on 6th April 2021
Abstract
GC content is a contributing factor to the stability of nucleic acids due to hydrogen bonding. More hydrogen bonding generally results in greater stability. Empirical evidence, however, has suggested that the GC content of a nucleic acid is a poor predictor of its stability, implying that there are sequence-dependent interactions besides what its GC content indicates. To examine how much such sequence-dependent interactions affect the interaction energies of double-stranded DNA (dsDNA) molecules, dsDNA molecules of different sequences are generated and examined in silico for variabilities in the interaction energies within each group of dsDNA molecules of the same GC content. Since the amount of hydrogen bonding depends on the GC content, holding the GC content fixed when examining the differences in interaction energies allows sequence-dependent interactions to be isolated. The nature of sequence-dependent interactions is then dissected using energy decomposition analysis (EDA). By using EDA, the components of the interactions that depend on the neighboring base pairs help explain some of the variability in the interaction energies of the dsDNA molecules despite having the same GC content. This work provides a new paradigm and tool for the study and analysis of the distributions of interaction components in dsDNA with the same GC content using EDA within large-scale quantum chemistry calculations.
1 Introduction
Hydrogen bonding represents a significant contribution to the stability of a double-stranded DNA (dsDNA). Adenine–thymine (A–T) contributes two hydrogen bonds, and guanine–cytosine (G–C) contributes three hydrogen bonds. As such, the amount of energy required to denature a double-stranded DNA depends on the GC content, which is the percentage of nucleobases that are guanine or cytosine. Base stacking represents another significant contribution due to π–π interactions.1 Since base stacking occurs for neighboring base pairs, the interaction energy and stability of a DNA structure do not depend on the GC content alone. The ordering of the base pairs in addition to the GC content is therefore also a factor contributing to the stability of a DNA.Due to the importance of interacting biomolecules in a supermolecule system, determining the various factors that contribute to the interaction energy of a biomolecular system would aid in the understanding of some biological phenomena. For instance, mRNA transcription involves the opening and unwinding of the DNA helix by RNA polymerase along with the aid of many transcription factors. The interactions within and their contributions to the interaction energy of the DNA strands affect the transcription process and efficiency.2 Another example is CG islands, which are regions of high GC content often associated with the beginning of a gene. The GC content affects the interaction energy of the DNA helical region. Since it can be near or within the promoters of many genes, understanding how the GC content affects the interaction energy in CG islands near such genes can elucidate some of the aspects of transcription initiation and promoter escape.3,4
Understanding such biomolecular interactions is a motivation for using and further improving computational chemistry methods. Density functional theory (DFT) examines the electronic structure of chemical systems with many atoms. Due to computational costs, DFT is often applied to small systems that are either simple or simplified models of biomolecules so that biomolecular interactions can be studied and then extrapolated to real systems. An example of such systems is the pairing of stacked amino acids, where their orientations relative to each other determine the stability and interaction energy.5 Also regarding stacking interactions, fragment-based drugs and moieties have been studied in the context of binding to different DNA base pairs.6 Stacking interactions and hydrogen bonding are often the themes in DFT-based studies of biomolecules, since they serve as important noncovalent contributors to the stabilization of the supermolecule.
Often such studies involve very simple or simplified versions of real biomolecules. DFT calculations are expensive, and conventional software packages are cubic-scaling in terms of the computation time it takes and the number of atoms in the system being studied. Biological molecules, such as proteins and nucleic acids, are usually large or part of a larger complex of interacting units, which exceed reasonable limits in the computational time that a cubic-scaling software package takes on such systems.
ONETEP (Order-N Electronic Total Energy Package)7 is a DFT software package based on a plane-wave, pseudo-potential approach that utilizes the electronic localization inherent in systems with a non-vanishing band gap. As such, the computational cost of ONETEP DFT calculations scales linearly with the number of atoms and the number of processors when parallelized.8 Due to its linear scaling, ONETEP is suitable for studying biological systems on the order of thousands of atoms.9 On the other hand, cubic-scaling calculations, in general, can only handle up to hundreds of atoms at its best. In addition to the size of the system, the variability of a class of systems, such as nucleic acids with different sequences, presents combinatorial issues for setting up and running a large number of calculations and is exacerbated if the calculations are cubic-scaling.
DFT has been applied to the study of DNA molecules in the context of ligand complexes and disease prevention. Ligand binding to DNA has impacts on the stability of DNA, such as increasing the susceptibility of DNA to cleavage and altering the thermodynamic properties.10 Ligand binding to DNA has also been examined using electronic absorption spectra and charge transfer using time-dependent DFT (TDDFT) calculations.11 However, as noted, such complexes are usually small enough for cubic-scaling calculations.
While the DFT method aims to estimate the total energy of a system, the main objectives of energy decomposition analysis (EDA) is to partition the interaction energy of a multi-fragment supermolecule into their chemical origins,12 such as electrostatics, exchange–correlation contributions, polarization, charge transfer, and other relevant chemical phenomena. Hence, EDA is an important analytical tool that partitions the interaction energy into chemically interpretable components.
EDA is a family of decomposition methods, each of which is known as an EDA scheme. The EDA schemes can be categorized according to the nature of their underlying theory.12 There are two major categories of EDA schemes: variational-based and perturbation-based. Variational-based schemes are typically derived from the early forms of EDA. The interaction energy is decomposed by the use of intermediate wave functions. LMO,13 ALMO,14 and BLW15,16 schemes are in this category. Perturbation-based schemes approach EDA from the popular, symmetry-adapted perturbation theory (SAPT) scheme.17,18 The interactions among the fragments are seen as perturbations to the non-interacting description and are constructed as corrections resulting from different physical effects. EDA can also facilitate the creation of new force fields in molecular mechanics by parameterization against EDA data, thereby yielding force fields that are more accurate and transferable.19,20
There have been other studies on applying DFT and EDA to simple biomolecules for understanding some of the stabilization interactions common in biological systems and with drugs. Usually, the types of biomolecules being studied are DNA base pairs, amino acids, or interactions between them. In order to facilitate these studies or computations, oftentimes simplified versions of biomolecules with some functional groups (such as the phosphate backbone) removed are used when studying the interactions between pairs and for avoiding confounding factors due to other subunits and other types of biological interactions.1,21 While the decomposition of the interactions of base pairs, base stacking, and base pairs with amino acids on small scales serves as important starting points, studies of such interactions on a larger and nontrivial system would provide deeper insights into how variety and domains within a biomolecule come into play in biological systems and complexes.22
In the present work, the HALMO-EDA scheme is used for decomposing the inter-strand interactions of dsDNA molecules into various factors and investigating how such factors contribute to the variability of interaction energies despite having the same GC content. Linear-scaling DFT in the ONETEP scientific package and a brief overview of HALMO EDA are presented. The pipeline in which dsDNA molecules are generated, optimized, and decomposed for chemical interactions is developed and applied in conjunction with DFT and EDA, alongside a molecular-mechanic interpretation of the energy decomposition as supporting data.
2 Methods
2.1 Linear-scaling DFT and ONETEP
ONETEP uses a linear-scaling method that employs a basis set of orthogonal and localized functions known as periodic sine (psinc) functions.23 Such a basis set allows systematic control of truncation errors and accurate representation of the kinetic-energy operator. The localized quantities would lead to a physical way of dividing the computational effort among many processors to allow calculations to be performed in parallel. What distinguishes this approach is that the localization is achieved in a controlled and mathematically consistent manner so that ONETEP obtains the same accuracy as cubic-scaling plane-wave approaches, while offering fast and stable convergence.8ONETEP aims to obtain the same result as solving a set of single-particle Schrödinger equations in Kohn–Sham (KS) DFT:
 | (1) |
If there is a band gap in the system, the density matrix decays exponentially as a function of |r′ − r|. The density matrix can then be truncated to a sparse band-diagonal form such that the amount of information it contains increases linearly with its size.8 The density kernel, K, is used to achieve the truncation and is defined for each element as
 | (2) |
 | (3) |
| n(r) = 2ρα(r,r) = 2ρβ(r,r) | (4) |
The truncation of the density kernel is carried out by setting
| Kικ = 0 | (5) |
| |Rι − Rκ| > rcut | (6) |
In ONETEP's formulation, molecular orbitals are linear combinations of a set of localized orbitals called nonorthogonal generalized Wannier functions (NGWFs) and are expanded as
 | (7) |
 | (8) |
The total energy is variationally minimized with respect to both the density kernel and the NGWFs. The method of minimizing the energy is carried out using two nested loops. Corresponding to the outer loop, the set of NGWFs is varied. Corresponding to the inner loop, the density kernel is optimized with respect to a fixed set of NGWFs. The density kernel is constrained to be idempotent, which imposes orthogonality on the orbitals. The constraint is applied in ONETEP using a modified Li–Nunes–Vanderbilt (LNV) scheme24–26 where the energy is minimized with respect to an auxiliary density kernel. The relationship between the auxiliary density kernel, L, and the density kernel, K, is
| K = 3LSL − 2LSLSL | (9) |
 | (10) |
2.2 Energy decomposition analysis
In ONETEP, the available EDA scheme used in this work is hybrid absolutely localized molecular orbitals (HALMO),27 which is based on localized molecular orbitals (LMO) and absolutely localized molecular orbitals (ALMO). The decomposition of the interaction energy into frozen density, polarization, and charge transfer is based on the first-generation ALMO EDA.14 Further decomposition of the frozen-density component is based on LMO EDA.13 HALMO is a hybrid EDA scheme with some differences in the names for similar, though not identical, EDA components compared to LMO.Fig. 1 depicts the decomposition of interaction energy as performed using HALMO EDA. HALMO EDA has a frozen-density component, which is composed of electrostatics, exchange, Pauli repulsion, and correlation. Despite the similarity of these components with LMO EDA, HALMO-EDA frozen density cannot be computed solely from LMO-EDA components. First-generation ALMO EDA does not further decompose its frozen-density component.
 | ||
| Fig. 1 Decomposition of interaction energy in HALMO EDA. | ||
Electrostatics in HALMO EDA is the same as in LMO EDA, and it is the classical-like terms of the Kohn–Sham (KS) energy containing the electron–electron coulombic repulsion and nucleus–nucleus repulsion. Exchange is also the same in both EDA schemes, and it is the change in exchange energy from isolated fragments to the supermolecule without the relaxation of the orbitals. Repulsion is again the same, and it is the difference in energy due to the overlapping of the orbitals without considering correlation. Correlation, however, is exclusive to HALMO EDA and is the difference in correlation energy from isolated fragments to the supermolecule with orthogonalized molecular orbitals that are variationally optimized within their respective fragments. For the mathematical definitions of these HALMO-EDA components, the reader is referred to the original development and implementation of HALMO EDA in ONETEP.27
LMO EDA does not have a charge-transfer component but has an energy component that is called polarization. However, polarization in LMO EDA is not the same as polarization in HALMO EDA. Instead, polarization in HALMO EDA is the same as that of ALMO EDA, which arises from the use of a self-consistent field for molecular interactions (SCF MI).28,29 After it is determined, charge transfer simply becomes the remaining component of the interaction energy. Since LMO EDA does not concern itself with charge transfer due to its dependence on the choice of basis set, SCF MI is not used in LMO EDA. Although charge transfer is absent in LMO EDA, charge transfer has a common and useful interpretation that it is a measure of covalency among fragments,14 and HALMO EDA calculates charge transfer as one of its components. Charge transfer is simply the difference in energy when going from the polarized state to the state of the supermolecule with molecular orbitals that are variationally optimized across the supermolecule.
2.3 Computational procedure with DNA structures
To generate structures and perform classical molecular dynamics (MD) simulations of DNA fragments, we have used AmberTools, which is a distribution of programs that are independently developed as part of the Amber Project and is the free distribution that is built upon by Amber30 for additional programs and parallelization. The version of AmberTools used here is 18, and the three programs of it used in this work are NAB (Nucleic Acid Builder), LEaP, and sander.To study how interaction energy is affected by the sequence and sequence length, all possible four-base-pair (4bp) sequences were generated for optimization and energy determination. 2bp and 3bp sequences were not considered due to their lower sample sizes. Naive generation of DNA sequences would result in redundant structures, causing unnecessary computations on equivalent sequences. By standard convention, nucleic acid sequence without the strand direction being indicated is always presented in the 5′-to-3′ direction. If a sequence is presented in the 3′-to-5′ direction, the 3′ and 5′ ends must be indicated. Since each DNA sequence has a reverse complementary sequence and could be a palindrome, two generated sequences that give the same structure are reduced to one unique sequence by removing one of them. For example, TAAT and its reverse complement ATTA give the same structure and are treated as if they are the same sequence. The famous TATA (for a TATA box) is a palindromic sequence and, hence, has a reverse complement that happens to be the same.
Removing such redundant sequences based on sequence alone would only remove redundancies due to palindromic sequences, since each of them has a reverse complement that is the same. It would not remove non-palindromic sequences that are reverse complements of each other. Therefore, the implementation of the uniqueness of two sequences based on reverse complementarity was also taken into consideration. This resulted in 136 unique 4bp sequences. With the unique sequences generated, NAB with the BSC1 DNA force field was used for creating 136 dsDNA structures in silico without optimizing the resulting structure, which was done later in the pipeline.
dsDNA alone is a negatively charged system due to the phosphates in its backbone. Sodium counterions were added to the dsDNA structures in order to neutralize the negative charges using LEaP, which is an AmberTools program that creates new systems or modifies the existing systems. However, adding the counterions to the dsDNA structures would obfuscate the association of counterions with individual strands, since LEaP considers dsDNA as a whole. Because the interaction energy of the two DNA strands coupled with counterions will be decomposed using EDA, the counterion-strand association is necessary for defining the fragments for EDA.
To keep track of which counterions are associated with which DNA strand, each dsDNA created from NAB was separated into its individual strands. The sodium counterions are then added to each strand in isolation. The counterions are tracked before recombining them back into double-stranded form. Although not needed during the optimization of the dsDNA structures, bookkeeping of the counterion-strand association was maintained throughout. This allows the optimized structures to be used for HALMO EDA later, which requires the counterion-strand associations in order to define each counterion-neutralized single-stranded DNA (ssDNA) as a fragment.
Depending on the length or possibly the DNA sequence itself, automatic determination by LEaP of the number of sodium counterions to add sometimes does not actually neutralize all the negative charges. However, LEaP offers an option to explicitly specify the number of counterions to be added and thus allows a workaround to the issue. Before adding the counterions, in LEaP, the negative charge of a DNA strand is determined and then negated to give the number of sodium counterions needed to neutralize all of the negative charges. The number of counterions to add is explicitly passed to LEaP so that LEaP does not determine it automatically in an occasionally erroneous way.
Sander is a program in AmberTools for geometry optimization and molecular dynamics. In this work, it is used exclusively for optimizing the dsDNA structures in implicit water. For implicit water, the implicit-solvation model used31–33 corresponds to the sander IGB value of 1. Other configuration parameters for sander that are used have the values imin = 1, maxcyc = 10![[thin space (1/6-em)]](https://www.rsc.org/images/entities/char_2009.gif) 000, ncyc = 5000, and ntb = 0. Sander's cut parameter is dynamically determined, and the lower-bound value for drms is set to 1.0 × 10⁻⁶, both of which are discussed below.
000, ncyc = 5000, and ntb = 0. Sander's cut parameter is dynamically determined, and the lower-bound value for drms is set to 1.0 × 10⁻⁶, both of which are discussed below.
In addition to sander's optimization (which shall now be considered as the inner loop of optimization), an algorithm for the outer loop outside of AmberTools was developed that utilizes Brent's method34 to minimize a structure's energy with a specified desired RMS (root mean square) as the lower bound and before the maximum number of steps is encountered. Furthermore, dynamically determining the cutoff distances for each dsDNA structure in an iterative fashion is implemented as part of the algorithm to avoid arbitrary cutoff distances. The nesting of the inner optimization by sander with the outer optimization yields negative interaction energies for all dsDNA structures, suggesting that the method gives more credible results than using sander alone, which would produce positive interaction energies for some of the structures.
The implementation of Brent's method used in the outer optimization is part of the Apache Commons Math, which is a Java library developed by the Apache Software Foundation. Given a user-specified lower-bound RMS and the maximum number of steps, the outer optimization executes sander's optimization as if it is an energy function of desired RMS to be minimized. Without falling below the lower-bound RMS, the RMS passed to the energy function is the desired RMS for sander to optimize the DNA structure. The RMS passed to the energy function is adjusted by Brent's method until the minimum of the energy function, which would be the energy of the properly optimized DNA structure, is found. The energy function is a programmatically generated function based on the DNA sequence, the implicit solvation environment, and the various configurations needed by sander.
To systematically determine the cut-off distances without predefining them with arbitrarily large ones, the cut-off distances are decided dynamically and iteratively as part of the outer optimization. The criterion for a cut-off distance used in this work is that it should not be shorter than the largest distance between any two atoms in a supposedly optimized DNA structure. Achieving this criterion begins with an initial guess based on the distances of the atoms in an unoptimized DNA structure and is then used as the first cut-off distance for sander in the inner optimization. The largest distance in the supposedly optimized DNA is checked against the cut-off distance used. If the cut-off distance turns out to be shorter than the largest atom distance, a new cut-off distance is established by increasing from the previous cut-off distance in the outer optimization, and the inner optimization process with sander is performed again with the new cut-off distance. The procedure repeats until the criterion that the cut-off distance used for the inner optimization is not shorter than the largest atom distance in the resulting dsDNA structure is satisfied.
3 Results and discussion
All possible and unique 4bp sequences were generated, resulting in 136 sequences. These 136 sequences are constructed in silico as dsDNA in B form by NAB along with the addition of sodium counterions, and are then geometry optimized by sander in implicit water. Using the optimized structures, energy calculations were performed by both sander (with the BSC1 force field) and ONETEP (with PBE+D2 and B97M-V exchange–correlation functionals), with ONETEP also having performed HALMO EDA in a vacuum. Descriptive statistics of the interaction energies and their HALMO-EDA components are calculated for the 4bp dsDNA structures in order to compare and contrast differences and variabilities for a fixed GC content.To study the significance of the ordering of the base pairs in addition to the amount of hydrogen bonding between the two strands of a dsDNA, the sequences are categorized by their GC content, which is the percentage of bases that are G or C. The possible GC contents for 4bp sequences are 0%, 25%, 50%, 75%, and 100%. Categorizing the 136 4bp sequences according to GC contents results in 10, 32, 52, 32, and 10 sequences, respectively. The purpose of GC-content categorization is to observe how base stacking and any other effects besides hydrogen bonding affect the interaction energies and their HALMO-EDA components.
For each of the dsDNA structures, ONETEP was used to calculate the interaction energy and HALMO-EDA components. Similarly, sander was used to calculate the interaction energy, electrostatics, and vdW energies in vacuum and in implicit water. Since implicit solvation with HALMO EDA is not supported in ONETEP, HALMO EDA was performed in vacuum only (Tables 3 and 4). However, single-point energy calculations with implicit solvation is supported in ONETEP, and the overall interaction energies in implicit solvation were computed (Table 2).
Table 1 demonstrates the variabilities, through median absolute deviation (MAD), in the interaction energies within each GC-content group in vacuum. The spread in the interaction energies exists in both ONETEP and AmberTools. On the other hand, Table 2 indicates that the implicit solvation of dsDNA makes the spread in the interaction energies of the DNA strands much less pronounced. For both in vacuum and in implicit water, the median of interaction energies becomes more negative as the GC content increases as expected from the estimates based on the GC content alone discussed below. However, the MAD in a GC-content group can be large enough to suggest that there are sequence-dependent interactions, and the variability of interaction energies within a GC-content group deserves further dissection by EDA.
| GC content | PBE | B97M-V | BSC1 | |||||
|---|---|---|---|---|---|---|---|---|
| Median | MAD | Est. | Median | MAD | Est. | Median | MAD | |
| 0% | −58.7 | 5.1 | −63.0 | −55.6 | 4.3 | −58.1 | −45.6 | 5.8 |
| 25% | −80.3 | 12.8 | −79.9 | −77.1 | 11.5 | −75.7 | −64.2 | 11.0 |
| 50% | −97.4 | 8.6 | −96.9 | −95.4 | 8.6 | −93.3 | −81.8 | 9.3 |
| 75% | −115.9 | 8.8 | −113.9 | −115.4 | 9.3 | −110.9 | −105.0 | 12.8 |
| 100% | −134.5 | 10.9 | −130.9 | −133.7 | 10.6 | −128.5 | −120.4 | 14.5 |
| GC content | PBE | B97M-V | BSC1 | |||||
|---|---|---|---|---|---|---|---|---|
| Median | MAD | Est. | Median | MAD | Est. | Median | MAD | |
| 0% | −43.2 | 0.7 | −35.6 | −41.4 | 1.0 | −30.2 | −31.2 | 1.0 |
| 25% | −49.0 | 1.2 | −39.1 | −47.1 | 2.4 | −34.0 | −37.1 | 1.2 |
| 50% | −53.7 | 1.8 | −42.7 | −51.9 | 3.0 | −37.8 | −42.3 | 1.3 |
| 75% | −58.3 | 2.4 | −46.3 | −56.2 | 3.0 | −41.6 | −47.5 | 1.1 |
| 100% | −64.5 | 2.6 | −49.9 | −64.1 | 4.3 | −45.4 | −53.5 | 1.0 |
Interaction energies and EDA components are also estimated by adding the interaction energies of one base pairs based solely on the GC content and not on the sequence. Such additive energies often underestimate the stability of a dsDNA, particularly of those in implicit water, and suggest that the GC content alone often does not account for base stacking interactions. This further suggests that there could be other interactions besides just hydrogen bonding that are contributing to the interaction energies being more negative than the corresponding estimates (Tables 1 and 2).
To examine which part or parts of an interaction energy exhibit the majority of the variability, HALMO EDA was applied to the same dsDNA structures in vacuum (Tables 3 and 4 with histograms, ESI†). The largest contributor to the variability of interaction energies based on the MAD appears to be frozen density (Table 3). Since there is much less variability in the interaction energies for implicit water, the observation that frozen density is the most important contributor is in accordance with the fact that electrostatic forces are involved in the different environments between vacuum and implicit solvation due to the screening effects in the presence of a solvent.
| GC content | Frozen density | DFT-D2 | ||||||||
|---|---|---|---|---|---|---|---|---|---|---|
| PBE | B97M-V | PBE | B97M-V | |||||||
| Median | MAD | Est. | Median | MAD | Est. | Median | MAD | Est. | ||
| 0% | 21.2 | 5.4 | 4.8 | −4.5 | 4.7 | −8.8 | −22.5 | 1.1 | −12.7 | 0.0 |
| 25% | 8.4 | 16.3 | −1.3 | −17.1 | 13.3 | −16.7 | −24.1 | 0.8 | −13.4 | 0.0 |
| 50% | 4.6 | 6.2 | −7.4 | −23.3 | 6.2 | −24.6 | −24.9 | 1.4 | −14.0 | 0.0 |
| 75% | −0.3 | 5.2 | −13.5 | −33.4 | 6.0 | −32.4 | −25.9 | 1.2 | −14.7 | 0.0 |
| 100% | −6.8 | 8.8 | −19.6 | −41.4 | 7.7 | −40.3 | −27.0 | 1.3 | −15.4 | 0.0 |
| GC content | Polarization | Charge transfer | ||||||||||
|---|---|---|---|---|---|---|---|---|---|---|---|---|
| PBE | B97M-V | PBE | B97M-V | |||||||||
| Median | MAD | Est. | Median | MAD | Est. | Median | MAD | Est. | Median | MAD | Est. | |
| 0% | −17.2 | 0.8 | −15.1 | −16.1 | 0.8 | −14.3 | −39.2 | 0.3 | −39.9 | −34.5 | 0.3 | −35.0 |
| 25% | −25.2 | 1.2 | −21.3 | −23.7 | 1.1 | −20.4 | −44.2 | 1.1 | −44.0 | −38.9 | 1.0 | −38.6 |
| 50% | −31.4 | 1.9 | −27.5 | −29.5 | 2.3 | −26.5 | −48.4 | 0.9 | −48.0 | −42.8 | 0.7 | −42.2 |
| 75% | −37.5 | 3.5 | −33.8 | −35.5 | 3.3 | −32.7 | −52.3 | 1.1 | −52.0 | −46.3 | 0.9 | −45.8 |
| 100% | −42.0 | 3.0 | −40.0 | −40.4 | 3.0 | −38.8 | −55.1 | 1.0 | −56.0 | −49.0 | 1.0 | −49.4 |
Since charge transfer is often considered to be a measure of covalency among fragments,14 the electron transfer portion of hydrogen bonding can be considered as part of charge transfer. By energy decomposition, the effects of hydrogen bonding can be segregated in the analysis. According to EDA results in the present work, hydrogen bonding is not the sole contributor to the strengthening of the interaction between the two DNA strands, which would offer computational support to the hypothesis that GC content alone cannot explain the thermal adaptability of single-celled and multicellular organisms.35,36 Furthermore, the estimates of charge transfer from additive one base pair are very close to the corresponding value for the dsDNA structures calculated as a whole (Table 4). Cross-base stacking may be a contributor to the increase in stability between DNA strands. Since a sufficiently long nucleic acid can fold back on itself, the overall 3D structure of a nucleic acid could further affect its stabilization. Additionally, proteins that stabilize a nucleic acid may also affect the perceived interaction energy, and some of these proteins are sequence-specific, structure-specific, or discriminate differently based on the different classes of nucleic acids.
In HALMO EDA, polarization and charge transfer are not further decomposed. Frozen density, on the other hand, is decomposed into subcomponents, allowing more fine-grained dissection of the interaction energy to better pinpoint the sources of the variability. The descriptive statistics for 4bp dsDNA grouped by GC content (Tables 5 and 6) offer a demonstrative interpretation that electrostatics and Pauli repulsion play larger roles in the variability of the interaction energies among sequences with the same GC content compared to exchange and correlation.
| GC content | Electrostatics | Pauli repulsion | ||||||||||
|---|---|---|---|---|---|---|---|---|---|---|---|---|
| PBE | B97M-V | PBE | B97M-V | |||||||||
| Median | MAD | Est. | Median | MAD | Est. | Median | MAD | Est. | Median | MAD | Est. | |
| 0% | −71.8 | 5.5 | −85.5 | −101.3 | 6.1 | −99.1 | 159.2 | 2.2 | 150.6 | 166.9 | 10.6 | 155.0 |
| 25% | −94.2 | 12.7 | −102.4 | −125.3 | 16.3 | −117.2 | 177.0 | 2.6 | 167.8 | 185.0 | 44.4 | 172.7 |
| 50% | −108.7 | 5.8 | −119.2 | −138.8 | 8.8 | −135.3 | 194.2 | 3.3 | 184.9 | 202.6 | 8.1 | 190.4 |
| 75% | −126.3 | 5.0 | −136.1 | −158.8 | 7.4 | −153.4 | 212.4 | 3.0 | 202.1 | 223.0 | 5.9 | 208.0 |
| 100% | −144.4 | 8.6 | −153.0 | −179.5 | 9.5 | −171.5 | 230.2 | 4.5 | 219.2 | 246.1 | 10.2 | 225.7 |
| GC content | Exchange | Correlation | ||||||||||
|---|---|---|---|---|---|---|---|---|---|---|---|---|
| PBE | B97M-V | PBE | B97M-V | |||||||||
| Median | MAD | Est. | Median | MAD | Est. | Median | MAD | Est. | Median | MAD | Est. | |
| 0% | −37.5 | 0.5 | −36.7 | −61.9 | 3.2 | −56.9 | −28.8 | 0.8 | −23.6 | −9.2 | 0.4 | −7.9 |
| 25% | −41.7 | 0.8 | −40.4 | −69.1 | 3.8 | −64.0 | −31.2 | 0.6 | −26.3 | −21.1 | 12.4 | −8.2 |
| 50% | −45.4 | 1.0 | −44.1 | −75.9 | 2.7 | −71.1 | −33.7 | 0.9 | −28.9 | −10.1 | 0.6 | −8.5 |
| 75% | −49.3 | 0.9 | −47.8 | −85.1 | 1.6 | −78.3 | −36.5 | 0.7 | −31.6 | −10.4 | 0.5 | −8.8 |
| 100% | −53.6 | 1.3 | −51.6 | −93.1 | 2.8 | −85.4 | −39.4 | 1.3 | −34.2 | −11.0 | 0.7 | −9.1 |
To demonstrate the effects of frozen density, polarization, and charge transfer, HALMO EDA provides visualizations of the electron-density differences (EDDs) among these components. For the sequence TA, Fig. 2 depicts the change in going from frozen density to polarization, whereas Fig. 3 depicts the change in going from polarization to the variationally optimized state. For instance, the electron transfer portion of hydrogen bonding can be visualized by the charge-transfer component, illustrated by the increase in the electron density between the base pairs in Fig. 3. In fact, the majority of charge transfer comes from the electron transfer between bases from opposing strands where the hydrogen bonding occurs. Observing the EDD in going from frozen density to polarization, the change in electron densities reflects some of the pre-hydrogen bonding aspects, where the electrons on the oxygen that is partaking the hydrogen bonding have accumulated toward its companion hydrogen as if it is preparing for the electron transfer that occurs in the charge-transfer component.
 | ||
| Fig. 2 Change in electron densities from frozen density to polarization for the sequence TA in vacuum. Red indicates an increase in electron density, whereas blue indicates a decrease. Isovalue is set at ±0.02 e Å−3. | ||
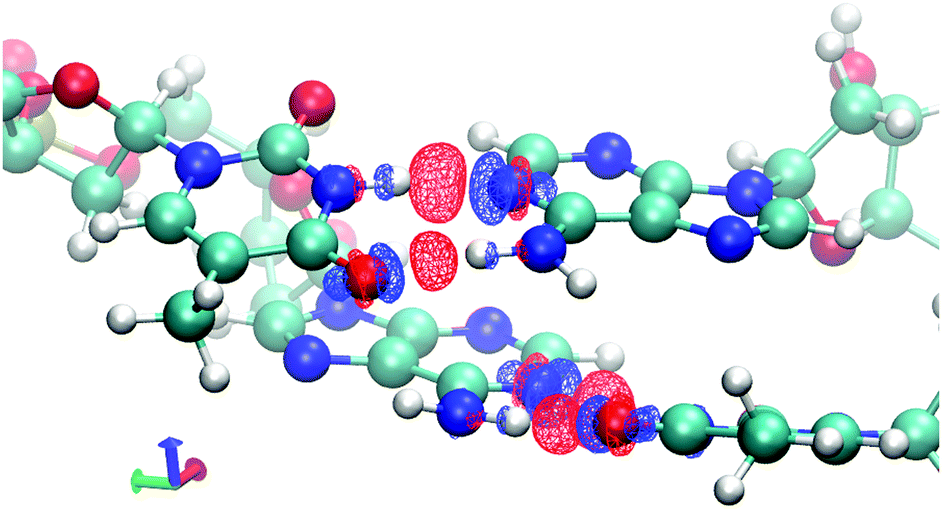 | ||
| Fig. 3 Change in electron densities from polarization to supermolecule with variationally optimized molecular orbitals across the supermolecule for the sequence TA in vacuum. Red indicates an increase in electron density, whereas blue indicates a decrease. Isovalue is set at ±0.02 e Å−3. | ||
Analogous to ONETEP's HALMO EDA, AmberTools offers a molecular-mechanic version of energy decomposition. For the counterion-coupled dsDNA structures studied in this work, the two components that make up the entire interaction energy according to the BSC1 force field are electrostatics and vdW. As for HALMO EDA, the statistics calculated for these components can also be grouped by the GC content (Table 8). For these dsDNA structures, BSC1 decomposes the interaction energy into electrostatics, vdW, and solvation energy. Solvation energy is zero in vacuum and non-zero in implicit water. Electrostatics and vdW are the same regardless of whether a dsDNA structure is in vacuum or in implicit water.
Similar to HALMO EDA, electrostatics is also the major contributor to the variability of interaction energies according to BSC1 and substantially outweighs that of vdW. The decrease in the variability in the overall interaction energy between in vacuum and in implicit water is substantial, which can be seen in Table 7 by their MAD statistics. For any comparison in this study, caution should be taken when comparing MAD statistics between overall interaction energies and specific energy components. While the interaction energy provides an indication of the thermal stability of dsDNA molecules as a whole from multiple contributing factors, a particular energy component's susceptibility to neighboring base interactions is a reflection of that component only.
| GC content | Vacuum | Solvation | Implicit water | |||
|---|---|---|---|---|---|---|
| Median | MAD | Median | MAD | Median | MAD | |
| 0% | −45.6 | 5.8 | 12.4 | 5.7 | −31.2 | 1.0 |
| 25% | −64.2 | 11.0 | 27.3 | 11.5 | −37.1 | 1.2 |
| 50% | −81.8 | 9.3 | 39.6 | 8.3 | −42.3 | 1.3 |
| 75% | −105.0 | 12.8 | 56.8 | 12.5 | −47.5 | 1.1 |
| 100% | −120.4 | 14.5 | 67.9 | 13.9 | −53.5 | 1.0 |
Non-vdW and vdW energies for 4bp dsDNA in vacuum from the BSC1 force field are compared and contrasted with that of HALMO EDA (Table 8). The overall interaction energy is composed of non-vdW and vdW parts. In BSC1, there is a dedicated vdW component, and electrostatics makes up the remaining portion of the interaction energy as the non-vdW part. In HALMO EDA, there is no component specific to vdW, so vdW is defined either as the correlation component in HALMO EDA or as the empirical dispersion correction37 depending on whether the exchange–correlation functional intrinsically includes dispersion interactions. This definition used in the present work was arrived at by calculating 27 possible combinations of HALMO-EDA components (which has six components) and empirical dispersion correction, which is non-zero for PBE and zero for B97M-V. The calculated values were then compared with the vdW component of BSC1 to determine which of the combinations of HALMO-EDA components and empirical dispersion correction give values that are closer to the vdW component of BSC1 while still maintaining chemical interpretability. A definition of vdW from EDA components varies between different EDA schemes and different studies, where, for instance, an alternative definition of vdW38,39 includes charge transfer, which in turn is couterintuitively claimed to be related to covalency.14 Differences in the definitions of vdW are attributed to the differing components in various EDA schemes and the methodologies of establishing such definitions.
| GC content | Non-vdW | vdW | ||||||||||
|---|---|---|---|---|---|---|---|---|---|---|---|---|
| PBE | B97M-V | BSC1 | PBE | B97M-V | BSC1 | |||||||
| Median | MAD | Median | MAD | Median | MAD | Median | MAD | Median | MAD | Median | MAD | |
| 0% | −36.4 | 6.5 | −44.3 | 6.9 | −27.6 | 6.0 | −22.5 | 1.1 | −9.2 | 0.4 | −17.8 | 0.8 |
| 25% | −57.5 | 13.4 | −50.4 | 46.0 | −47.1 | 10.9 | −24.1 | 0.8 | −21.1 | 12.4 | −17.4 | 0.9 |
| 50% | −73.8 | 9.0 | −80.3 | 12.5 | −65.3 | 8.3 | −24.9 | 1.4 | −10.1 | 0.6 | −17.2 | 1.3 |
| 75% | −90.2 | 8.4 | −95.1 | 18.4 | −87.9 | 12.0 | −25.9 | 1.2 | −10.4 | 0.5 | −16.9 | 1.1 |
| 100% | −106.5 | 11.2 | −104.6 | 19.4 | −104.4 | 15.4 | −27.0 | 1.3 | −11.0 | 0.7 | −17.2 | 0.9 |
By defining vdW in terms of HALMO-EDA components as done in the present work, similar variabilities (by MAD) for each GC-content group compared to BSC1 are exhibited in PBE and B97M-V, with the exception of the 25% GC-content group for B97M-V that is also apparent in the overall interaction energy in vacuum. For PBE, the vdW contribution to the interaction energy is significantly overestimated in a consistent manner compared to both BSC1 and B97M-V. For B97M-V not in the 25% GC-content group, vdW contribution is underestimated compared to BSC1, roughly by the same magnitude in the opposite direction relative to PBE. To provide a comparison with an SAPT-based approach, vdW components are also provided between the two fragments for each dsDNA structure from vdW2017,20 an SAPT-based force field for vdW contributions, which is detailed in the ESI.† These further demonstrate the non-uniqueness in the partitioning of energy components among EDA schemes.
The much greater variability in vdW contributions for the 25% GC-content group using the B97M-V functional lends itself to future studies in determining whether the variability is an artifact of the way this exchange–correlation functional operates or is due to actual sequence-dependent interactions. If the latter, such interactions are apparently more pronounced when the GC content is 25% for 4bp and could serve as a useful category for future studies of interactions that depend on neighboring base pairs.
4 Conclusions
We have applied energy decomposition analysis (EDA) methods to dissect the interactions within double-stranded DNA (dsDNA) to examine how much sequence-dependent interactions affect the interaction energies of dsDNA molecules. For this work, we have analyzed all 136 combinations of four-base-pair (4bp) sequences, which we have categorized based on their GC content.Hybrid absolutely localized molecular orbitals (HALMO) EDA has shown to be a useful tool in conjunction with molecular mechanics in decomposing the interaction energies into components for comparisons and analyses. It has been demonstrated in this work and the work of other researchers that GC content is an important property of DNA in the context of its stability. Despite its importance, it is not the sole factor in determining the stability of nucleic acids, since substantial variabilities can exist for nucleic acids with the same GC content. This suggests that the hydrogen bonding between two bases should not be considered as the only or even the most important factor in the interactions between two complementary DNA strands.
This work has provided a new paradigm and tool for the study and analysis of nucleic acid interactions using EDA within large-scale quantum chemistry calculations. Future work can involve a more in-depth study of intramolecular interactions that exist within nucleic acids and also the interactions of nucleic acids with other entities, such as proteins and drug molecules.
Conflicts of interest
There are no conflicts to declare.Acknowledgements
The authors acknowledge the use of the IRIDIS 5 High-Performance Computing Facility, and associated support services at the University of Southampton. The authors are also grateful for computational support from the UK Materials and Molecular Modelling Hub, which is partially funded by EPSRC (EP/P020194 and EP/T022213/1). This work is part of the University of Southampton's Centre for Doctoral Training (CDT) program in Next Generation Computational Modelling (NGCM).Notes and references
- M. Swart, T. van der Wijst, C. F. Guerra and F. M. Bickelhaupt, J. Mol. Model., 2007, 13, 1245–1257 CrossRef CAS PubMed.
- M. Dangkulwanich, T. Ishibashi, L. Bintu and C. Bustamante, Chem. Rev., 2014, 114, 3203–3223 CrossRef CAS PubMed.
- A. Deaton and A. Bird, Genes Dev., 2011, 25, 1010–1022 CrossRef CAS PubMed.
- N. Elango and S. Yi, Genetics, 2011, 187, 1077–1083 CrossRef CAS PubMed.
- A. Bootsma, A. Doney and S. Wheeler, J. Am. Chem. Soc., 2019, 141, 11027–11035 CrossRef CAS PubMed.
- H. Toupkanloo and Z. Rahmani, Appl. Biol. Chem., 2018, 61, 209–226 CrossRef CAS.
- J. Prentice, et al. , J. Chem. Phys., 2020, 152, 174111-1–174111-36 Search PubMed.
- C.-K. Skylaris, P. Haynes, A. Mostofi and M. Payne, J. Chem. Phys., 2005, 122, 084119-1–084119-10 CrossRef PubMed.
- J. Dziedzic, S. Fox, T. Fox, C. Tautermann and C.-K. Skylaris, Int. J. Quantum Chem., 2013, 113, 771–785 CrossRef CAS.
- K. Sakthikumar, J. Raja, R. Solomon and M. Sankarganesh, J. Biomol. Struct. Dyn., 2019, 37, 2498–2514 CrossRef CAS PubMed.
- J. Li, L.-C. Xu, J.-C. Chen, K.-C. Zheng and L.-N. Ji, J. Phys. Chem. A, 2006, 110, 8174–8180 CrossRef CAS PubMed.
- M. J. S. Phipps, T. Fox, C. S. Tautermann and C.-K. Skylaris, Chem. Soc. Rev., 2015, 44, 3177–3211 RSC.
- P. Su and H. Li, J. Chem. Phys., 2009, 131, 014102-1–014102-15 Search PubMed.
- R. Khaliullin, E. Cobar, R. Lochan, A. Bell and M. Head-Gordon, J. Phys. Chem., 2007, 111, 8753–8765 CrossRef CAS PubMed.
- Y. Mo and J. Gao, J. Chem. Phys., 2000, 112, 5530–5538 CrossRef CAS.
- Y. Mo, P. Bao and J. Gao, Phys. Chem. Chem. Phys., 2011, 13, 6760–6775 RSC.
- B. Jeziorski, R. Moszynski and K. Szalewicz, Chem. Rev., 1994, 94, 1887–1930 CrossRef CAS.
- K. Patkowski, Wiley Interdiscip. Rev.: Comput. Mol. Sci., 2020, 10, e1452 CAS.
- J. McDaniel and J. Schmidt, Annu. Rev. Phys. Chem., 2016, 67, 467–488 CrossRef CAS PubMed.
- R. Qi, Q. Wang and P. Ren, Bioorg. Med. Chem., 2016, 24, 4911–4919 CrossRef PubMed.
- H. Kruse, P. Banáš and J. Sponer, J. Chem. Theory Comput., 2019, 15, 95–115 CrossRef CAS PubMed.
- M. J. S. Phipps, T. Fox, C. S. Tautermann and C.-K. Skylaris, J. Chem. Theory Comput., 2017, 13, 1837–1850 CrossRef CAS PubMed.
- A. Mostofi, P. Haynes, C.-K. Skylaris and M. Payne, J. Chem. Phys., 2003, 119, 8842–8848 CrossRef CAS.
- X.-P. Li, R. W. Nunes and D. Vanderbilt, Phys. Rev. B: Condens. Matter Mater. Phys., 1993, 47, 10891–10894 CrossRef CAS PubMed.
- R. W. Nunes and D. Vanderbilt, Phys. Rev. B: Condens. Matter Mater. Phys., 1994, 50, 17611–17614 CrossRef CAS PubMed.
- P. D. Haynes, C.-K. Skylaris, A. A. Mostofi and M. C. Payne, J. Phys.: Condens. Matter, 2008, 20, 294207 CrossRef.
- M. J. S. Phipps, T. Fox, C. S. Tautermann and C.-K. Skylaris, J. Chem. Theory Comput., 2016, 12, 3135–3148 CrossRef CAS PubMed.
- R. Khaliullin, M. Head-Gordon and A. Bell, J. Chem. Phys., 2006, 124, 204105-1–204105-11 CrossRef PubMed.
- H. Stoll, G. Wagenblast and H. Preuβ, Theor. Chim. Acta, 1980, 57, 169–178 CrossRef CAS.
- D. Case, et al. , J. Comput. Chem., 2005, 26, 1668–1688 CrossRef CAS PubMed.
- G. D. Hawkins, C. J. Cramer and D. G. Truhlar, Chem. Phys. Lett., 1995, 246, 122–129 CrossRef CAS.
- G. D. Hawkins, C. J. Cramer and D. G. Truhlar, J. Phys. Chem., 1996, 100, 19824–19839 CrossRef CAS.
- V. Tsui and D. A. Case, Biopolymers (Nucleic Acid Sciences), 2001, 56, 275–291 CrossRef CAS.
- R. Brent, Algorithms for Minimization without Derivatives, Dover, 2002 Search PubMed.
- L. Hurst and A. Merchant, Proc. R. Soc. London, Ser. B, 2001, 268, 493–497 CAS.
- P. Šmarda, P. Bureš and L. Horová, et al. , Proc. Natl. Acad. Sci. U. S. A., 2014, 111, E4096–E4102 CrossRef PubMed.
- S. Grimme, J. Comput. Chem., 2006, 27, 1787–1799 CrossRef CAS PubMed.
- Y. Mao, O. Demerdash, M. Head-Gordon and T. Head-Gordon, J. Chem. Theory Comput., 2016, 12, 5422–5437 CrossRef CAS PubMed.
- Y. Mao, Y. Shao, J. Dziedzic, C.-K. Skylaris, T. Head-Gordon and M. Head-Gordon, J. Chem. Theory Comput., 2017, 13, 1963–1979 CrossRef CAS PubMed.
Footnote |
| † Electronic supplementary information (ESI) available. See DOI: 10.1039/d0cp06630c |
| This journal is © the Owner Societies 2021 |