 Open Access Article
High coordination number actinide-noble gas complexes; a computational study†
Lin
Yang
 ,
Sophie
Cooper
 and
Nikolas
Kaltsoyannis
 *
*
Department of Chemistry, School of Natural Sciences, The University of Manchester, Oxford Road, Manchester M13 9PL, UK. E-mail: nikolas.kaltsoyannis@manchester.ac.uk
First published on 3rd February 2021
Abstract
The geometries, electronic structures and bonding of early actinide-noble gas complexes are studied computationally by density functional and wavefunction theory methods, and by ab initio molecular dynamics. AcHe183+ is confirmed as being an 18-coordinate system, with all of the He atoms accommodated in the primary coordination shell, and this record coordination number is reported for the first time for Th4+ and Th3+. For Pa and U in their group valences of 5 and 6 respectively, the largest number of coordinated He atoms is 17. For AnHe17q+ (An = Ac, q = 3; An = Th, q = 4; An = Pa, q = 5; An = U, q = 6), the average An–He binding energy increases significantly across the series, and correlates linearly with the extent of He → Anq+ charge transfer. The interatomic exchange–correlation term Vxc obtained from the interacting quantum atoms approach correlates linearly with the An–He quantum theory of atoms-in-molecules delocalization index, both indicating that covalency increases from AcHe173+ to UHe176+. The correlation energy in AnHe163+ obtained from MP2 calculations decreases in the order Pa > Th > U > Ac, the same trend found in Vxc. The most stable complexes of Ac3+ with the heavier noble gases Ar–Xe are 12 coordinate, best described as Ng12 cages encapsulating an Ac3+ ion. There is enhanced Ng → Ac3+ charge transfer as the Ng gets heavier, and Ac–Ng covalency increases.
1. Introduction
The noble gas (Ng) elements, with their completely filled principal quantum shells, were considered unreactive for a long time. However, the 1962 report of the first stable Ng compound, Xe+[PtF6]− disproved that view,1 and a new field of chemistry was opened. After that, many scientists devoted themselves to noble gas chemistry, and various new Ng compounds were reported from both experimental and theoretical studies.2–5 Among them, actinide–Ng complexes, CUO(Ar)4−n(Ng)n (Ng = Kr–Xe, n = 1–4), were first reported by Andrews et al. in 2002.6 During the synthesis of CUO by laser ablation of U and CO in Ng matrices, it was found that the vibrational spectrum of CUO in an Ar matrix was different from that in a Ne matrix, with the spectral shift from Ne to Ar being much larger than the normal “matrix shift”. Combined with density functional theory (DFT) calculations, Andrews et al. assigned the spectrum in Ar to triplet CUO, but to singlet CUO in Ne. Such matrix-induced ground-state reversal suggested direct Ar–U bonding, and U–Ng bonds were also found in Kr and Xe. The interaction between U and Ng was attributed to the donation of Ng lone pair electrons into vacant orbitals of U, suggesting that positively charged actinide compounds such as UO22+ would have stronger interaction with Ng elements, and the U–Ng complexes [UO2(Ne)6]+, [UO2(Ng)5]+ (Ng = Ar–Xe) and UO2(Ng)4 (Ng = Ne, Ar) were indeed subsequently reported.7,8 The larger average U–Ng binding energy in [UO2(Ng)5]+vs. UO2(Ng)4 and CUO(Ng)4 (e.g. 23.6 kJ mol−1, 14.6 kJ mol−1 and 16.2 kJ mol−1 respectively for Ng = Ar) supports the influence of charge on U–Ng interaction strength, also found in AuXenq+.2,9Actinide–Ng (especially He) complexes are candidate molecules for achieving high coordination numbers. Coordination number (CN), originally defined as the total number of neighboring atoms directly bonded to the central atom in a molecule or ion, is a fundamental concept in coordination chemistry, and the experimental and theoretical search for compounds with high CN has a long history.10–13 Hermann et al. predicted the existence of PbHe152+ with a CN of 15 by DFT calculation,14 and that even higher CN systems may be achievable in charged actinide–He interactions. Motivated by this work, our group15 theoretically studied actinide ions coordinated by He atoms and reported 17-coordinated AcHe173+, PaHe174+ and ThHe174+ complexes, a step forward as for several years the highest known CN was 16.11–13 UHenq+ (q = 2–6) and PaHen5+ were also studied, but no stable structures were found with n > 15. However, a year later, AcHe183+ was reported by Ozama et al., using coupled cluster theory and path integral molecular dynamics (PIMD).16 According to their work, 18 He atoms can be accommodated in the first coordination shell, in a highly symmetrical D4d structure, the increase in CN from our work potentially being due to omission of basis set superposition error (BSSE) in our CCSD(T) calculations. Although CN higher than 18 has recently been reported for M(H2)12n+ (M = Ac, Th, Pa, U, La, n = 3, 4)17 and An(BH)24 (An = Th–Cm),18 genuine CNs of 24 are debatable given the strong H–H interaction in M(H2)12n+ and lack of direct evidence for true 24 M–B bonds in An(BH)24. High coordination number is also observed in metal cluster-based compounds. M(EH)12 (M = Cr, Mo, W; E = Zn, Cd, Hg)19 possess 12 M-ER bond paths which are characterized as 6 three-centre two-electron bonds by quantum theory of atoms-in-molecules (QTAIM) and MO analysis. Weak peripheral E–E bonding is also observed with lower bond order than the M–E bonds. By contrast, [Pt@Pb12]2−,20,21 which has similar geometry, is stabilized by strong interactions in the Pb icosahedron.
In this contribution, we study AnHenq+ (An = Ac–U) using wavefunction theory, DFT and ab initio molecular dynamics (AIMD) calculations, and probe the nature of the An–He interaction. The latter is investigated via the QTAIM, interacting quantum atoms (IQA) and natural population analysis (NPA) methods. We also extend the helium work to the heavier Ng elements neon, argon, krypton, and xenon, systemically investigating the nature of the Anq+–Ng interaction, including the influence of Ng polarizability.
2. Computational details
All the geometrical structures, binding energies and thermodynamic stabilities of AnNgnq+ complexes were studied by dispersion-corrected density functional theory methods (DFT-D3),22 as implemented in TURBOMOLE 7.3.23 Effective core potentials (ECPs) with 60 core electrons were used for the actinide elements along with the def-TZVPP valence basis sets,24–26 and the aug-cc-pV5Z basis set27 was used for He. Stuttgart RLC basis sets and ECPs with 2, 10, 28, and 46 core electrons respectively were used for Ne, Ar, Kr, and Xe.28,29 To ensure valid comparisons with the He results, both the aug-cc-pV5Z and Stuttgart RLC ECP basis sets were used for benchmark AcNen3+ calculations (Table S1, ESI†). The average Ac3+–Ne distance and distance range obtained, as well as the binding energies, are close, suggesting that comparisons may indeed be justifiably made between the He and heavier Ng results, despite the difference in Ng basis sets employed. Harmonic vibrational frequency analysis30 was conducted for all optimized structures to ensure that they are true minimum structures.To benchmark the density functional selection, CCSD(T)31 calculations were conducted in MOLPRO 201932 using the 60 electron ECP along with associated ECP60MWB_SEG valence basis set for An (Ac, U)24–26 and aug-cc-pV5Z basis set for He.27 HF33 and MP234 calculations were performed in Gaussian 1635 with the same basis sets as used for the CCSD(T) calculations. BSSE corrections were evaluated by the counterpoise correction method.36
QTAIM and IQA37 calculations were conducted using the AIMAll software.38 The input files for the IQA calculations were generated from DFT calculations based on the B3LYP-D3 density functional39 because the BHLYP-D3 density functional (which is used for our other production DFT calculations) is not currently supported for IQA analysis in AIMAll. The details for the IQA calculations were as reported in our previous work.40 Natural population analysis (NPA) was carried out using NBO 7.041 to obtain the natural charges and electron configurations of the AnNgnq+ complexes.
To study the thermodynamic stability of the optimized AnNgnq+ structures, AIMD calculations were performed in TURBOMOLE, using the Nosé–Hoover thermostat.42 The time step was set to 1.21 fs and the total simulation time to 1.25 ps for Ac3+–Ng compounds. For the Th4+–He complexes, longer simulation times were used, 2.47 ps and 3.71 ps for temperatures of 3 K and 10 K respectively. The simulations for AcHe183+ and ThHe184+ were conducted twice, yielding similar results. Hence, simulations for the Ac3+–Ng complexes were conducted only once.
3. Results and discussion
3.1. Potential energy curves for An3+–He
As stated in the Introduction, Ozama et al. reported that BSSE has a significant influence on the Ac3+–He potential energy curve at the ECP60MWB/CCSD(T) level.16 To verify this, we began by studying BSSE, calculating the potential energy curve for the Ac3+–He interaction with CCSD(T), with and without BSSE correction. Both contracted and uncontracted valence basis sets were used for Ac. As shown in Fig. 1(a), the effect of BSSE depends on whether the Ac basis set is contracted or uncontracted. The contracted basis set without BSSE gives the deepest potential well of 35.13 kJ mol−1, close to the 34.98 kJ mol−1 and 35.0 kJ mol−1 calculated by Ozama et al. and by us, respectively. However, the potential well without BSSE but using the uncontracted basis set is much shallower, 22.68 kJ mol−1 at 2.61 Å. BSSE correction leads to a shallowing of the potential energy curve, to 21.93 kJ mol−1 and 22.18 kJ mol−1 for contracted and uncontracted basis set respectively, close to the value of 21.94 kJ mol−1 predicted by Ozama et al. This suggests that BSSE correction has a marked influence on CCSD(T) calculations using contracted basis sets, but that the impact on uncontracted basis set calculations is slight. BSSE at the DFT level was also studied, using the PBE-D3 functional as a representative example (Fig. S1, ESI†). The results suggest that the effect is very small, with potential well depths of 27.40 kJ mol−1 and 27.46 kJ mol−1 with and without BSSE correction, respectively. On the basis of these results, we (i) use BSSE-corrected contracted basis set CCSD(T) data as a benchmark to determine the most appropriate density functional (contracted basis sets are used for DFT calculations in the TURBOMOLE software) and (ii) neglect BSSE corrections in our DFT calculations.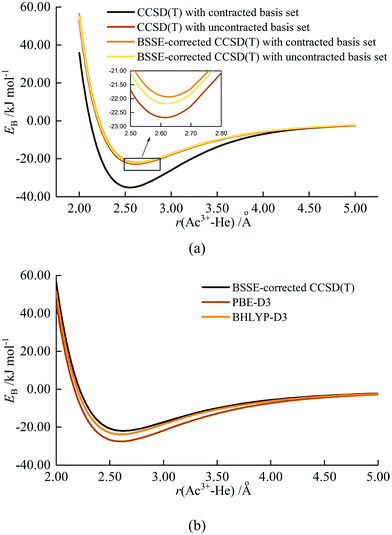 | ||
| Fig. 1 Potential energy curves of Ac3+–He by (a) CCSD(T) calculation and (b) DFT calculation using PBE-D3 and BHLYP-D3 density functionals.39,43 | ||
Ac3+–He potential energy curves were calculated by various density functionals; the results from PBE-D3 and BHLYP-D3 are shown in Fig. 1(b) with the other data being plotted in Fig. S2 (ESI†). All functionals match reasonably well with BSSE-corrected CCSD(T), with hybrid functionals performing slightly better than GGA. Among the hybrids, the BHLYP curve is the best match for the coupled cluster results, and hence BHLYP-D3 is used for geometry optimization and binding energy calculations of AnNgnq+. The only exception is UHen3+, for which BHLYP-D3 gave a poor description of the UHe183+ average binding energy (Fig. S3, ESI†) and U3+–He potential energy curve (Fig. S4, ESI†). Fig. S4 (ESI†) shows that the binding energies obtained from BHLYP-D3 are very large, leading to an extremely deep potential well which does not converge to 0 at large U3+–He distance. Further examination indicates that the total energy of U3+ obtained by BHLYP-D3 is appreciably less negative than from the other methods employed (Table S2, ESI†), and also less negative than obtained from the same calculation performed in Gaussian 16, suggesting that TURBOMOLE does not converge to the correct ground state of U3+ with BHLYP. Given this observation and, as the curve from B3LYP-D3 matches better with that of CCSD(T), it is used for the study of U3+–He complexes.
3.2. Anq+–He complexes
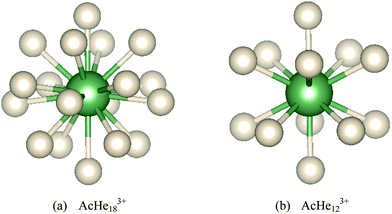
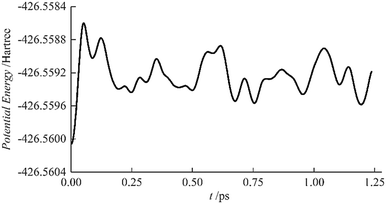
The stability of AcHe183+ was studied by AIMD at 10 K, starting from the initial geometry shown in Fig. 2(a). The results are shown in Fig. 3; the lowest energy structure over the course of the simulation is the starting structure. Furthermore, the root mean square deviations of the He atoms from the initial structure are less than 0.15 Å, also indicating the stability of the AcHe183+ structure, with only slight relaxation of the He atoms in the first coordination shell.
Geometrical parameters of Ac3+–He complexes from n = 1 to 18 are listed in Table 1. The average Ac3+–He distance increases by only 0.109 Å from n = 1 to 17, with the bond distance range maximising at 0.039 Å for the 16-coordinate system. However, the bond distance range jumps to 0.108 Å at n = 18, with the average bond distance being 0.027 Å longer than that at n = 17, suggesting a crowded distribution of He atoms in AcHe183+. However, the range of 0.108 Å is still small enough to assign all 18 He atoms to the primary coordination shell. That we find bond critical points (BCPs) between Ac3+ and all 18 He atoms also supports this conclusion. Note also the very small bond length range for n = 12 (Fig. 2(b)), 0.001 Å, rising to 0.026 Å at n = 13, due to disruption of the stable AcHe123+ icosahedral structure. The average Ac–He distance of AcHe173+ is 2.719 Å, larger than the 2.671 Å that we reported before,15 consistent with the smaller revised Ac3+–He well depth.
| n | r av/Å | Δr/Å | n | r av/Å | Δr/Å |
|---|---|---|---|---|---|
| 1 | 2.610 | — | 10 | 2.638 | 0.016 |
| 2 | 2.606 | 0.001 | 11 | 2.642 | 0.013 |
| 3 | 2.611 | 0.005 | 12 | 2.644 | 0.001 |
| 4 | 2.613 | 0.006 | 13 | 2.660 | 0.026 |
| 5 | 2.620 | 0.011 | 14 | 2.671 | 0.018 |
| 6 | 2.628 | 0.012 | 15 | 2.683 | 0.037 |
| 7 | 2.631 | 0.013 | 16 | 2.701 | 0.039 |
| 8 | 2.635 | 0.005 | 17 | 2.719 | 0.037 |
| 9 | 2.638 | 0.011 | 18 | 2.746 | 0.108 |
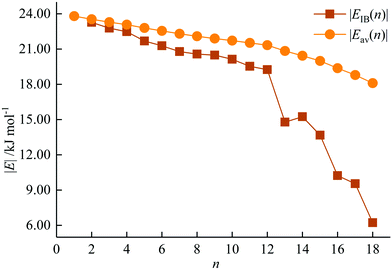
The incremental |EIB(n)| and average |Eav(n)| binding energies of AcHen3+ (n = 1–18) are plotted in Fig. 4. |EIB(n)| is defined as the difference between the total energy of AcHen3+ and the sum of the total energy of AcHen−13+ and He, and represents the energy gain for each He atom attachment. Eav(n) is calculated by equation
| Eav(n) = (E(n) − E(Ac3+) − n × E(He))/n |
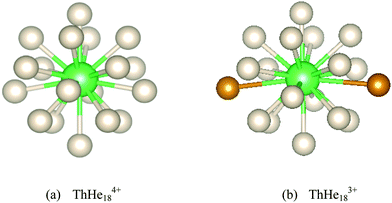 | ||
| Fig. 5 Optimized (a) ThHe184+ and (b) ThHe183+ geometries. The furthest two He atoms in the latter are highlighted in orange in (b). | ||
| r av/Å | Δr/Å | |Eav|/kJ mol−1 | |
|---|---|---|---|
| ThHe184+ | 2.541 | 0.151 | 42.001 |
| ThHe183+ | 2.729 | 0.538 | 19.452 |
| PaHe175+ | 2.360 | 0.053 | 90.604 |
| PaHe163+ | 2.623 | 0.213 | 22.257 |
| UHe176+ | 2.296 | 0.082 | 179.917 |
| UHe163+ | 2.623 | 0.083 | 22.908 |
To study the thermodynamic stability of ThHe184+, AIMD calculations were conducted at 3 K and 10 K. As shown in Fig. 6, ThHe184+ remains as the minimum potential energy structure at 3 K. However, as the temperature is increased to 10 K, the minimum potential energy structure changes to ThHe174+, with the 18th He atom located in the second shell, i.e. the system is better represented as ThHe17+14+. The Th–He distance range in the ThHe174+ part is quite small (0.040 Å), and the distance difference between the two shells is 1.213 Å. Compared with AcHe183+, the primary coordination shell of ThHe184+ is more crowded, which leads to a reduction in the CN at higher temperature.
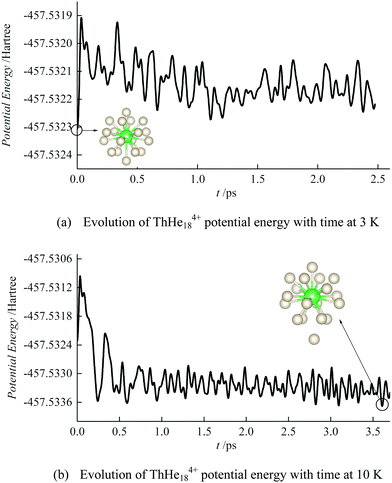 | ||
| Fig. 6 Evolution of ThHe184+ potential energy by AIMD at (a) 3 K and (b) 10 K. The initial structures are as shown in Fig. 5(a). | ||
Although a stable ThHe183+ structure was obtained, the range of Th3+–He distances is quite large (2.645–3.183 Å). As shown in Fig. 5(b), there are two He atoms, highlighted in orange, with an average Th3+–He distance of 3.178 Å, farther out than the other 16 He atoms (average Th3+–He distance = 2.673 Å), making the CN 18 description debatable. However, QTAIM analysis shows BCPs between Th3+ and all 18 He atoms (Fig. 7). The presence of a BCP can be considered as the indicator of a chemical bond. The average electron density at the BCPs between Th3+ and the two more distant He atoms is only 0.005 a.u., while the value is 0.013–0.015 a.u. between Th3+ and the other 16 He atoms. Therefore, we conclude that ThHe183+ is genuinely 18-coordinated, although two of the bonds are extremely weak. Note that the average Th3+–He binding energy (19.452 kJ mol−1) is slightly larger than the 18.098 kJ mol−1 of Ac3+–He, but significantly less than that of Th4+–He.
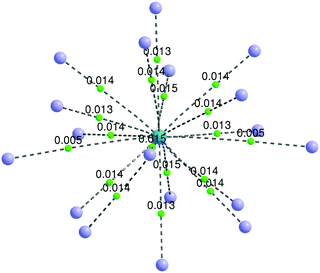 | ||
| Fig. 7 Bond paths (dashed lines) and bond critical points (green dots) of ThHe183+. The electron densities (a.u.) at the BCPs are displayed. He = purple spheres, Th = blue sphere. | ||
To further understand the actinide–Ng interaction within these highly coordinated complexes, QTAIM and NPA analysis for ThHe18q+ (q = 3, 4) were conducted, and the results are presented in Table 3. The data for AcHe183+ are also given. Different from orbital-based analysis, QTAIM is based on the topology of the electron density.44 BCP properties such as the electron density (ρBCP), Laplacian of the electron density (∇2ρBCP), the ratio of kinetic and potential energy densities (−GBCP/VBCP), and the energy density (HBCP) are all useful descriptors of chemical bonds. A general rule is that ρBCP > 0.2 a.u. and HBCP < 0 are features of covalent interaction, while ρBCP < 0.1 a.u. represents closed-shell interactions (ionic bonding, hydrogen bonding, van der Waals bonding).45 However, for chemical bonds involving actinides, ρBCP is rarely larger than 0.2 and usually less than 0.1 a.u. ∇2ρBCP describes whether the electron density is concentrated (∇2ρBCP < 0) or depleted (∇2ρBCP > 0) at the BCP. For highly polarized bonds, positive ∇2ρBCP is possible. For BCPs with positive ∇2ρBCP, −GBCP/VBCP between 0.5 and 1 is a feature of covalent character, while −GBCP/VBCP > 1 is considered to indicate non-covalent interaction.40 Moreover, the delocalization indices (δ), which represent the number of electrons shared between two atomic basis, is a widely used measure of bond order, and also a good indicator of covalence.
| Atomic charge | BCP properties | δ | |||||||
|---|---|---|---|---|---|---|---|---|---|
| QTAIM | NPA | ||||||||
| q An | q He | q An | q He | ρ BCP | ∇2ρBCP | −(GBCP/VBCP) | H BCP | ||
| AcHe183+ | 2.843 | 0.009 | 2.211 | 0.048 | 0.012 | 0.055 | 1.278 | 0.002 | 0.048 |
| ThHe183+ | 2.827 | 0.010 | 1.766 | 0.069 | 0.013 | 0.061 | 1.247 | 0.002 | 0.053 |
| ThHe184+ | 3.613 | 0.021 | 2.226 | 0.099 | 0.020 | 0.083 | 1.154 | 0.002 | 0.077 |
The QTAIM atomic charges in Table 3 indicate that the overall q+ charge partially redistributes between An and He due to electron transfer from the He atoms to the An centres. That said, the An QTAIM charges are close to the formal oxidation state in all cases, and the He charges are small. These charges indicate closed-shell bonding in Thq+–He and Ac3+–He; this has been previously characterized as a charge-induced dipole interaction.15 The BCP data and small δ values further confirm this. Although the An/He charges calculated by NPA are not as disparate as those from the QTAIM, they are also suggestive of ionic bonding. Charge transfer, as well as ρBCP and δ, for ThHe184+ are larger than for ThHe183+ and AcHe183+ (which are similar to one another) consistent with the average Anq+–He binding energy being mainly determined by the charge on the metal centre, as noted above.
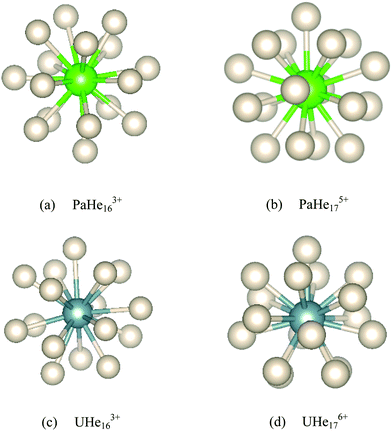
18-Coordinated structures were also located for PaHe183+ and UHe183+, but were found to have imaginary frequencies. To obtain true minima, the PaHe183+ and UHe183+ structures were distorted along the largest imaginary mode and re-optimized, resulting in lower energy AnHe163+ (An = Pa, U) structures with the remaining two He atoms located in the second shell. The geometries of these complexes are given in Fig. 8 and Table 2. PaHe175+ and UHe176+ have similar symmetry and geometry to one another, with the average Anq+–He distances being 2.360 Å and 2.296 Å, respectively. The average Pa5+–He and U6+–He binding energies are much larger than that of Th4+–He, which we attribute in part to the reduced steric effect induced by the reduction in CN, but primarily to the increased metal charge of Pa5+ and U6+, as found in the comparison of ThHe184+ and AcHe183+. For PaHe163+ and UHe163+, the average An3+–He distances are the same with the distance range of the latter being smaller. The average binding energy of UHe163+ is slightly larger than that of PaHe163+, but this increase is small compared with that from PaHe175+ to UHe176+, as found for ThHe18n+ complexes as noted above. This further indicates the significant influence of metal charge on Anq+–He interaction.
AnHe17q+. As shown in Table 4, the average An–He distance in AnHe17q+ decreases significantly from Ac to U, while the average binding energy increases substantially. The atomic charges on the actinide ions deviate from their formal oxidation states, suggesting that part of the overall positive charge is acquired by the He atoms. This charge transfer increases across the series from Ac to U, with the partial charge on Ac(III) close to its formal oxidation state but increasingly less so from Th(IV) to U(VI). The average binding energy correlates linearly with this charge transfer (R2 = 0.999). We noted above that the Thq+–He (q = 3, 4) and Ac3+–He interaction is primarily charge-induced dipole, with little charge transfer and small delocalization indices. This description is also suitable for the Pa–He interaction in PaHe175+, given the small ρBCP value, positive HBCP, and −GBCP/VBCP greater than 1. However, considering the charge loss of 1.73 for U(VI) and small negative HBCP, this description is arguably less appropriate for U–He, which shows more Lewis acid–base interaction characteristics. −GBCP/VBCP between 0.5 and 1.0 further evidences this. Furthermore, ρBCP and δ rise from Ac to U, suggesting increasing covalency.
| r av/Å | E av/kJ mol−1 | q An | q He | ρ BCP | ∇2ρBCP | H BCP | δ | V xc/kJ mol−1 | ||
|---|---|---|---|---|---|---|---|---|---|---|
| AcHe173+ | 2.719 | −18.796 | 2.802 | 0.009 | 0.013 | 0.058 | 1.263 | 0.002 | 0.053 | −27.543 |
| ThHe174+ | 2.511 | −44.121 | 3.604 | 0.023 | 0.022 | 0.090 | 1.138 | 0.002 | 0.085 | −48.296 |
| PaHe175+ | 2.360 | −90.604 | 4.144 | 0.050 | 0.033 | 0.118 | 1.023 | 0.001 | 0.139 | −83.375 |
| UHe176+ | 2.296 | −179.917 | 4.259 | 0.102 | 0.040 | 0.123 | 0.958 | −0.001 | 0.230 | −124.580 |
| AcHe163+ | 2.701 | −19.374 | 2.802 | 0.012 | 0.014 | 0.059 | 1.247 | 0.002 | 0.062 | −29.507 |
| ThHe163+ | 2.650 | −21.270 | 2.779 | 0.014 | 0.015 | 0.067 | 1.213 | 0.002 | 0.070 | −33.444 |
| PaHe163+ | 2.623 | −22.257 | 2.761 | 0.015 | 0.016 | 0.071 | 1.198 | 0.003 | 0.072 | −34.859 |
| UHe163+ | 2.623 | −22.908 | 2.754 | 0.015 | 0.015 | 0.069 | 1.198 | 0.002 | 0.069 | −33.302 |
The exchange–correlation energy (Vxc) between An and He, obtained from IQA analysis, is also listed in Table 4. IQA is a real-space energy partitioning method based on topology theory, with good performance in quantifying chemical bonding, which has only recently begun to be employed in the 5f series.40,48 According to the IQA approach, the interatomic energy (Vint) can be decomposed into electrostatic (VElec) and exchange–correlation terms (Vxc).37 The former is composed of the nuclear–nuclear repulsive energy, electron–electron coulombic repulsion energy, and the electron–nuclear attraction energy. Vxc is a good descriptor of the covalent contribution to the interatomic energy, and it can be seen from Table 4 that Vxc becomes more negative as the series is crossed. Considering that the more negative Vxc, the higher the degree of covalency, IQA gives the same trend as the other QTAIM metrics, i.e. that covalency increases from Ac to U in this closed-shell family. As shown in Fig. 9(a), Vxc shows excellent correlation with δ (R2 = 0.991), which is a more widely used indicator of covalency. This further suggests that the IQA method can be a useful tool in the study of covalency in the 5f series.
To further analyze the electronic structures of these complexes, the natural charges and natural electron configurations were explored using NPA, and are listed in Table 5, together with the Wiberg bond indices (WBIs). The trend in the NPA charges of He in AnHe17q+ is the same as that obtained from QTAIM but with more charge being acquired by He, similar to the behaviour noted above, indicating less closed-shell interaction compared with QTAIM. Like Vxc, WBI is very strongly correlated with δ (R2 = 0.985). Given the charge transfer, it is unsurprising that the natural electron configurations show significant deviation from the formal oxidation states, in which the valence orbitals are expected to be empty. The occupancies of all valence orbitals increase from AcHe173+ to UHe176+, although the details differ. For AcHe173+, the electrons mainly occupy the 6d orbitals, with the 5f occupancy being 0.08. Although the 6d populations are also larger than 5f for ThHe174+ and PaHe175+, the 5f increases significantly and, for UHe176+, the occupation of 5f exceeds that of 6d. The increasing occupation of the 5f orbitals in part reflects their stabilization across the actinide series, as reported in previous theoretical work.49,50
| WBI | q An | q He(av) | Natural electronic configuration | |||
|---|---|---|---|---|---|---|
| 7s | 5f | 6d | ||||
| AcHe173+ | 0.054 | 2.251 | 0.044 | (0) 0.18 | (0) 0.08 | (0) 0.48 |
| ThHe174+ | 0.119 | 2.338 | 0.098 | (0) 0.29 | (0) 0.44 | (0) 0.92 |
| PaHe175+ | 0.187 | 2.292 | 0.159 | (0) 0.36 | (0) 1.02 | (0) 1.31 |
| UHe176+ | 0.286 | 1.789 | 0.248 | (0) 0.37 | (0) 2.23 | (0) 1.58 |
| AcHe163+ | 0.053 | 2.304 | 0.044 | (0) 0.17 | (0) 0.17 | (0) 0.45 |
| ThHe163+ | 0.138 | 1.827 | 0.073 | (0) 0.21 | (1) 0.10 | (0) 0.65 |
| PaHe163+ | 0.151 | 1.714 | 0.080 | (0) 0.22 | (2) 0.11 | (0) 0.67 |
| UHe163+ | 0.136 | 1.846 | 0.072 | (0) 0.21 | (3) 0.12 | (0) 0.67 |
AnHe163+. As discussed in Section 3.1, the BHLYP-D3 functional failed to convincingly describe U3+-based complexes, and hence we employed B3LYP-D3 for calculations on UHe163+. To systematically study trivalent An–He, QTAIM and NBO analyses for AnHe163+ (An = Ac–U) were all conducted from single-point calculations using B3LYP-D3, and the results are collected in Table 4. The average An–He distance shortens across the early actinide series, following the An trivalent radius contraction; that r(Pa–He) and r(U–He) are the same as one another is likely due to the very similar ionic radii of Pa3+ (1.04 Å) and U3+ (1.03 Å). The average binding energy increases slightly from AcHe163+ to UHe163+, and the values for the Th, Pa and U systems are significantly smaller than in the corresponding AnHe17q+. Moreover, the energy difference between AnHe163+ and the corresponding closed-shell AnHe17q+ rises from Ac to U, further illustrating the strong influence of metal charge on the Anq+–He interaction.
Turning to the QTAIM metrics, the small values of ρBCP and δ, and the positive ∇2ρBCP and HBCP, all indicate charge-induced dipole interaction for all AnHe163+ complexes. The charge difference between metal and He decreases slightly from Ac to U, although this change is small compared with the closed-shell AnHe17q+ complexes. The BCP electron densities are very similar for all four complexes, with that for Ac–He being slightly smaller, similar to the charge transfer trend. −GBCP/VBCP also suggests that the Ac system is the most ionic, as does δ, from which the covalency trend is Pa > Th > U > Ac. Vxc indicates the same trend and once again shows excellent correlation with δ (R2 = 0.994, Fig. 9(b)). Notably, the difference in δ and Vxc between the trivalent AnHe163+ and group valent AnHe17q+ complexes increase very significantly from Ac to U, suggesting significantly greater covalency in the higher oxidation state systems. To place the QTAIM metrics for the An–He complexes in context, the values of ρBCP, δ, and Vxc as a function of the shortening and elongation of the An–He bond length are studied for An3+–He diatomic systems (Fig. S5, ESI†).
The natural charge and WBI data (Table 5) show the same trend as the QTAIM and IQA metrics, and once again the correlation of WBI with δ is very strong (R2 = 0.978). As discussed above, the enhanced charge transfer predicted by NPA suggests less of a closed-shell interaction nature. The natural electronic configuration data show that the largest enhancement in all valence orbitals is in the 6d, indicating that the An 6d orbital is the principal acceptor of He electron density in AnHe163+.
In order to study the effect of correlation on the An3+–He bonding, HF and MP2 calculations were performed at the DFT optimized geometries, and the results are plotted in Fig. S6 (ESI†). Although the average binding energies are smaller at the HF level than the DFT, the trend as function of actinide is similar, with a slight increase from Ac to U. At the MP2 level, the binding energies are extremely close to the DFT values for Th to U, but that for AcHe163+ is rather larger than from DFT. As with the CCSD(T) data presented in Section 3.1, correction for BSSE significantly reduces the depth of the potential energy curve of Ac3+–He at the MP2 level, bringing it close to the DFT value and resulting in a trend similar to that from DFT and HF. BSSE has less of an effect on the MP2 data for the later members of our target series. The correlation energy, obtained as the difference between the MP2 and HF results, is largest for Pa (8.62 kJ mol−1) and smallest for Ac (5.52 kJ mol−1) with an overall trend of Pa > Th > U > Ac. This is the same trend as Vxc, further demonstrating the reliability of the IQA method. The strengthening of the An3+–He bond with the inclusion of MP2-level correlation is reminiscent of the increase in the closed-shell metallophilic interaction in [Cl–M–PH3]2 (M = Cu, Ag, Au, Rg) from HF to MP2.51
During the AIMD relaxations, an interesting effect was discovered. It is logical that, for a compound consisting of n Ng atoms and an An ion, if n is larger than the highest CN, the system will have the highest-coordinated geometry with the remaining Ng atoms accommodated in the second shell. If n is less than the highest CN, an n-coordinated structure is expected. But this is not true for AcAr123+ (Ng = Ar–Xe). The optimized structures of AcArn3+ (n = 10–12, 14) are shown in Fig. 11. It can be seen that for n = 10, 11 and 14, 10-coordinated structures with the remaining Ar atoms in the second shell are obtained after AIMD relaxation at T = 10 K. For n = 12, however, the minimum potential energy structure is the icosahedral 12-coordinated one, which is stable even at T = 100 K (as shown in Fig. S8, ESI†). The 10-coordinated structure with 2 more Ar atoms in the second shell was also obtained, but its energy is 11.64 kJ mol−1 higher than that of AcAr123+. This 12-coordinated structure is also located for Kr and Xe.
 | ||
| Fig. 11 The lowest potential energy structures of AcArn3+ determined by AIMD at T = 10 K. The Ar atoms in the second shell are highlighted in dark green. | ||
To further study these AcNg123+ structures, QTAIM analysis was conducted, with the results being presented in Table 6. QTAIM analysis of the actinide-free Ng12 clusters were also conducted (Table 6). BCPs are found between Ac3+ and Ng atoms (Ng = He–Xe) in all AcNg123+, confirming direct Ac3+–Ng bonding. For the Ng12 clusters, BCPs are present between neighbouring Ng atoms in all systems (Ng = He–Xe). In AcHe123+ and AcNe123+, the Ng–Ng BCPs disappear, suggesting that the stability of these two complexes is mainly due to the interaction between Ac and Ng. However, for AcNg123+ (Ng = Ar–Xe), BCPs are retained between neighbouring Ng atoms, indicating that Ng–Ng interactions also contribute to the stability of these structures. As shown in Table 6, the electron densities at these Ng–Ng BCPs (Ar–Xe) are uniform down the group, even though the average Ng–Ng distance increases from 3.44 Å for Ar to 4.09 Å for Xe. The delocalization indices also increase from Ar to Xe, indicating enhanced interaction between Ng and Ng. Moreover, the Ng–Ng BCP data in AcNg123+ (Ng = Ar–Xe) are slightly larger than that in the bare Ng12. It seems that the 12 Ng atoms in AcNg123+ (Ng = Ar–Xe) form a cage, trapping Ac3+ within and enhancing the binding strength of Ng12 in return. This phenomenon is also found in ThNg124+ (geometrical and QTAIM parameters are listed in Table S3, ESI†). In summary, we suggest that the highest CN for AcNgn3+ (Ng = Ar–Xe) is 12 considering the BCPs found between Ac3+ and all Ng atoms, although not all AcNgn3+ structures are stable from n = 1 to 12 (e.g. AcAr113+, AcKr113+, AcXen3+, n = 9–11). The bonding situation in these complexes are similar to the M(EH)1219 which possess strong radial M–EH bonding and weak peripheral E–E bonding.
| r av/Å | |Eav|/kJ mol−1 | q Ac | q Ng(av) | Ac–Ng | Ng–Ng | |||||
|---|---|---|---|---|---|---|---|---|---|---|
| ρ BCP | ∇2ρBCP | δ | ρ BCP | ∇2ρBCP | δ | |||||
| AcHe123+ | 2.644 | 21.338 | 2.848 | 0.013 | 0.016 | 0.069 | 0.072 | — (0.002) | — (0.009) | — (0.007) |
| AcNe123+ | 2.779 | 33.445 | 2.800 | 0.017 | 0.019 | 0.092 | 0.092 | — (0.003) | — (0.021) | — (0.015) |
| AcAr123+ | 3.272 | 66.859 | 2.550 | 0.038 | 0.015 | 0.047 | 0.118 | 0.007 (0.006) | 0.026 (0.025) | 0.052 (0.048) |
| AcKr123+ | 3.521 | 78.037 | 2.478 | 0.043 | 0.012 | 0.033 | 0.120(7) | 0.007 (0.006) | 0.023 (0.022) | 0.067 (0.061) |
| AcXe123+ | 3.887 | 88.278 | 2.403 | 0.050 | 0.009 | 0.019 | 0.121(3) | 0.006 (0.006) | 0.017 (0.016) | 0.084 (0.075) |
The partial positive charge found on the Ng increases down the group (Table 6), with a corresponding decrease in qAc, reflecting the increasing polarizability of the heavier Ng elements, and hence greater transfer of electrons from Ng → Ac. The small values of ρBCP and δ, as well as the positive ∇2ρBCP, indicate the closed-shell nature of the Ac3+–Ng interaction. It is interesting to note that the Ac3+–Ng ρBCP data increase from He to Ne before reducing in the heavier members of group 18. This is inconsistent with the metal–Ng interaction trend reported in previous theoretical work, which finds the largest BCP data at metal–Xe,52 but the difference in behaviour likely arises from the direct Ng–Ng interaction in AcNg123+ (Ng = Ar–Xe). The delocalization indices rise from He to Xe, although the change from Ar to Xe is quite small compared to the increase in binding energies, also due to the Ng–Ng interaction.
The effect of outer coordination on the properties of AcNg123+ are also studied. AIMD simulation of an Ac3+–Ar42 cluster clearly shows separate first, second and outer Ar atom shells (Fig. S9, ESI†) with the former two containing 12 and 20 Ar atoms, respectively. The structure of Ac3+–Ar with two Ar shells is shown in Fig. S10 (ESI†). It can be seen that the second shell Ar has the same symmetry as that of the first shell. This structure is also located for Ne and Kr. The structural and QTAIM parameters for these compounds are shown in Table S4 (ESI†). Comparison with Table 6 shows that the average Ac–Ng bond distance decreases slightly as the second shell is included. Moreover, the cluster size has no effect on the trend in Ac–Ng and first shell Ng–Ng BCP properties. It is worth noting there are very weak bonds between the Ng atoms in the second shell even though the distances are large (e.g. ca. 4 Å for Ar).
4. Conclusions
In this contribution, we have studied the geometric and electronic structures and bonding of a range of complexes involving early actinide ions and the noble gases. We began by identifying the most appropriate form of DFT to study these systems, benchmarking the An3+–He interaction energy curves against BSSE-corrected coupled cluster data, and concluding that dispersion-corrected BHLYP is a good choice for An = Ac–Pa and for U(VI), with B3LYP-D3 being better for U(III). Using this approach, we verified that 18 He atoms can be accommodated in the primary coordination shell of Ac3+, and checked the stability of this system by AIMD. The very low incremental binding energy for the 18th He supports our conclusion that a coordination number of 18 is the maximum. We also report new 18-coordinate Th4+–He and Th3+–He complexes. The former is stable at 3 K by AIMD, but increasing the temperature to 10 K leads to one He migrating into the second coordination shell. In ThHe183+, two of the He are ca. 0.5 Å further from the metal than the other 16, but QTAIM analysis supports the CN = 18 description. Further QTAIM and NPA of the 18 coordinated systems indicates closed shell bonding, supporting previous conclusions of charge-induced dipole interactions.For Pa5+–He and U6+–He complexes, the highest CN is 17, whereas for Pa3+ and U3+ it is 16. As expected, the average An–He binding energies in the 17 coordinate group valent species is significantly larger than in all four An(III) systems, and there is greater transfer of charge from He → Anq+ in the more highly charged complexes. The average An–He binding energy correlates linearly with this charge transfer. The interatomic exchange–correlation energy Vxc determined by the IQA approach correlates linearly with the more widely used QTAIM delocalization index covalency metric, both indicating that An–He covalency increases from AcHe173+ to UHe176+. NPA of these 17 CN systems shows that the He → Anq+ charge transfer is primarily into metal 6d orbitals for Ac, Th and Pa, but mainly into 5f for U.
QTAIM analysis of the bonding in AnHe163+ suggests charge-induced interactions in all cases. HF and MP2 calculations on these systems indicate that the trend in correlation energy is Pa > Th > U > Ac; the same trend is seen in Vxc.
Finally, we studied complexes of Ac3+ with the heavier noble gases. DFT searches show that the maximum coordination number decreases down the group, being 15, 10, 10 and 8 for Ne, Ar, Kr and Xe respectively. These complexes are confirmed as being stable at 10 K by AIMD. However, further AIMD analysis suggest that the highest coordination number for the Ar, Kr and Xe systems is actually 12 as the 12 Ac3+–Ng bond paths are confirmed by QTAIM. Comparison of the bonding in AcNg123+ (Ng = He–Xe) using QTAIM shows enhanced Ng → Ac3+ charge transfer as the Ng gets heavier, and the Ac–Ng delocalization index increases.
Conflicts of interest
There are no conflicts to declare.Acknowledgements
We are grateful to the China Scholarship Council and The University of Manchester for a PhD studentship for LY. We are also grateful to The University of Manchester for a PhD studentship to SC, and to its Computational Shared Facility and associated support services.References
- N. Bartlett, Proc. Chem. Soc., 1962, 218 CAS.
- L. Belpassi, I. Infante, F. Tarantelli and L. Visscher, J. Am. Chem. Soc., 2008, 130, 1048–1060 CrossRef CAS.
- K. O. Christe, Angew. Chem., Int. Ed., 2001, 40, 1419–1421 CrossRef CAS.
- V. I. Feldman, F. F. Sukhov, A. Y. Orlov and I. V. Tyulpina, J. Am. Chem. Soc., 2003, 125, 4698–4699 CrossRef CAS.
- J. P. Wagner, D. C. McDonald, 2nd and M. A. Duncan, Angew. Chem., Int. Ed., 2018, 57, 5081–5085 CrossRef CAS.
- B. Liang, L. Andrews, J. Li and B. E. Bursten, J. Am. Chem. Soc., 2002, 124, 9016–9017 CrossRef CAS.
- I. Infante, L. Andrews, X. Wang and L. Gagliardi, Chem. – Eur. J., 2010, 16, 12804–12807 CrossRef CAS.
- X. Wang, L. Andrews, J. Li and B. E. Bursten, Angew. Chem., Int. Ed., 2004, 43, 2554–2557 CrossRef CAS.
- S. Seidel and K. Seppelt, Science, 2000, 290, 117–118 CrossRef CAS.
- T. R. Galeev, C. Romanescu, W. L. Li, L. S. Wang and A. I. Boldyrev, Angew. Chem., Int. Ed., 2012, 51, 2101–2105 CrossRef CAS.
- D. Pollak, R. Goddard and K. R. Porschke, J. Am. Chem. Soc., 2016, 138, 9444–9451 CrossRef CAS.
- X. Gu, G. H. Chen, M. Ji, Y. X. Yao and X. G. Gong, Nanoscale, 2012, 4, 2567–2570 RSC.
- I. A. Popov, T. Jian, G. V. Lopez, A. I. Boldyrev and L. S. Wang, Nat. Commun., 2015, 6, 8654 CrossRef CAS.
- A. Hermann, M. Lein and P. Schwerdtfeger, Angew. Chem., Int. Ed., 2007, 46, 2444–2447 CrossRef CAS.
- N. Kaltsoyannis, Angew. Chem., Int. Ed., 2017, 56, 7066–7069 CrossRef CAS.
- E. Ozama, S. Adachi, T. Takayanagi and M. Shiga, Chemistry, 2018, 24, 12716–12721 CrossRef CAS.
- M. Joshi and T. K. Ghanty, Chem. Commun., 2019, 55, 7788–7791 RSC.
- S. X. Hu, P. Zhang, W. Zou and P. Zhang, Nanoscale, 2020, 12, 15054–15065 RSC.
- M. von Hopffgarten and G. Frenking, J. Phys. Chem. A, 2011, 115, 12758–12768 CrossRef CAS.
- E. N. Esenturk, J. Fettinger, Y. F. Lam and B. Eichhorn, Angew. Chem., Int. Ed., 2004, 43, 2132–2134 CrossRef CAS.
- E. N. Esenturk, J. Fettinger and B. Eichhorn, J. Am. Chem. Soc., 2006, 128, 9178–9186 CrossRef CAS.
- S. Grimme, J. Antony, S. Ehrlich and H. Krieg, J. Chem. Phys., 2010, 132, 154104 CrossRef.
- R. Ahlrichs, M. Bär, M. Häser, H. Horn and C. Kölmel, Chem. Phys. Lett., 1989, 162, 165–169 CrossRef CAS.
- W. Küchle, M. Dolg, H. Stoll and H. Preuss, J. Chem. Phys., 1994, 100, 7535–7542 CrossRef.
- X. Cao, M. Dolg and H. Stoll, J. Chem. Phys., 2003, 118, 487–496 CrossRef CAS.
- X. Cao and M. Dolg, THEOCHEM, 2004, 673, 203–209 CrossRef CAS.
- C. Hättig, Phys. Chem. Chem. Phys., 2005, 7, 59–66 RSC.
- A. Nicklass, M. Dolg, H. Stoll and H. Preuss, J. Chem. Phys., 1995, 102, 8942–8952 CrossRef CAS.
- B. P. Pritchard, D. Altarawy, B. Didier, T. D. Gibson and T. L. Windus, J. Chem. Inf. Model., 2019, 59, 4814–4820 CrossRef CAS.
- P. Deglmann, F. Furche and R. Ahlrichs, Chem. Phys. Lett., 2002, 362, 511–518 CrossRef CAS.
- M. J. Deegan and P. J. Knowles, Chem. Phys. Lett., 1994, 227, 321–326 CrossRef CAS.
- H.-J. Werner, P. J. Knowles, G. Knizia, F. R. Manby, M. Schutz, P. Celani, W. Gyorffy, D. Kats, T. Korona, R. Lindh, A. Mitrushenkov, G. Rauhut, K. R. Shamasundar, T. B. Adler, R. D. Amos, S. J. Bennie, A. Bernhardsson, A. Berning, D. L. Cooper, M. J. O. Deegan, A. J. Dobbyn, F. Eckert, E. Goll, C. Hampel, A. Hesselmann, G. Hetzer, T. Hrenar, G. Jansen, C. Koppl, S. J. R. Lee, Y. Liu, A. W. Lloyd, Q. Ma, R. A. Mata, A. J. May, S. J. McNicholas, W. Meyer, T. F. Miller III, M. E. Mura, A. Nicklass, D. P. O’Neill, P. Palmieri, D. Peng, K. Pfluger, R. Pitzer, M. Reiher, T. Shiozaki, H. Stoll, A. J. Stone, R. Tarroni, T. Thorsteinsson, M. Wang and M. Welborn, MOLPRO (Version 2019.2) a package of ab initio programs, 2019 Search PubMed.
- C. C. J. Roothaan, Rev. Mod. Phys., 1951, 23, 69 CrossRef CAS.
- M. J. Frisch, M. Head-Gordon and J. A. Pople, Chem. Phys. Lett., 1990, 166, 275–280 CrossRef CAS.
- M. J. Frisch, G. W. Trucks, H. B. Schlegel, G. E. Scuseria, M. A. Robb, J. R. Cheeseman, G. Scalmani, V. Barone, G. A. Petersson, H. Nakatsuji, X. Li, M. Caricato, A. V. Marenich, J. Bloino, B. G. Janesko, R. Gomperts, B. Mennucci, H. P. Hratchian, J. V. Ortiz, A. F. Izmaylov, J. L. Sonnenberg, D. Williams-Young, F. Ding, F. Lipparini, F. Egidi, J. Goings, B. Peng, A. Petrone, T. Henderson, D. Ranasinghe, V. G. Zakrzewski, J. Gao, N. Rega, G. Zheng, W. Liang, M. Hada, M. Ehara, K. Toyota, R. Fukuda, J. Hasegawa, M. Ishida, T. Nakajima, Y. Honda, O. Kitao, H. Nakai, T. Vreven, K. Throssell, J. A. Montgomery Jr., J. E. Peralta, F. Ogliaro, M. J. Bearpark, J. J. Heyd, E. N. Brothers, K. N. Kudin, V. N. Staroverov, T. A. Keith, R. Kobayashi, J. Normand, K. Raghavachari, A. P. Rendell, J. C. Burant, S. S. Iyengar, J. Tomasi, M. Cossi, J. M. Millam, M. Klene, C. Adamo, R. Cammi, J. W. Ochterski, R. L. Martin, K. Morokuma, O. Farkas, J. B. Foresman and D. J. Fox, Gaussian 16 (Version A. 03), Gaussian, Inc., Wallingford, CT, 2016 Search PubMed.
- S. F. Boys and F. Bernardi, Mol. Phys., 1970, 19, 553–566 CrossRef CAS.
- M. A. Blanco, A. Martin Pendas and E. Francisco, J. Chem. Theory Comput., 2005, 1, 1096–1109 CrossRef CAS.
- T. A. Keith, AIMAll (Version 19.10.12), TK Gristmill Software, Overland Park KS, USA, 2019 Search PubMed.
- A. D. Becke, J. Chem. Phys., 1993, 98, 1372–1377 Search PubMed.
- V. E. J. Berryman, J. J. Shephard, T. Ochiai, A. N. Price, P. L. Arnold, S. Parsons and N. Kaltsoyannis, Phys. Chem. Chem. Phys., 2020, 22, 16804–16812 RSC.
- E. D. Glendening, J. K. Badenhoop, A. E. Reed, J. E. Carpenter, J. A. Bohmann, C. M. Morales, P. Karafiloglou, C. R. Landis and F. Weihold, NBO 7.0, Theoretical Chemistry Institute, University of Wisconsin, Madison, WI, 2018 Search PubMed.
- W. G. Hoover, Phys. Rev. A: At., Mol., Opt. Phys., 1985, 31, 1695–1697 CrossRef.
- J. P. Perdew, K. Burke and M. Ernzerhof, Phys. Rev. Lett., 1996, 77, 3865 CrossRef CAS.
- R. F. W. Bader, Atoms in molecules: a quantum theory, Clarendon Press, Oxford, New York, 1990 Search PubMed.
- C. F. Matta and R. J. Boyd, in The Quantum Theory of Atoms in Molecules, ed. C. F. Matta and R. J. Boyd, Wiley-VCH Verlag GmbH & Co. KGaA, Weinheim, 2007, vol. 1, pp. 1–34 Search PubMed.
- S. R. Daly, P. M. Piccoli, A. J. Schultz, T. K. Todorova, L. Gagliardi and G. S. Girolami, Angew. Chem., Int. Ed., 2010, 49, 3379–3381 CrossRef CAS.
- T. Arliguie, L. Belkhiri, S. E. Bouaoud, P. Thuery, C. Villiers, A. Boucekkine and M. Ephritikhine, Inorg. Chem., 2009, 48, 221–230 CrossRef CAS.
- J. A. Platts and R. J. Baker, Dalton Trans., 2020, 49, 1077–1088 RSC.
- M. J. Tassell and N. Kaltsoyannis, Dalton Trans., 2010, 39, 6719–6725 RSC.
- I. Kirker and N. Kaltsoyannis, Dalton Trans., 2011, 40, 124–131 RSC.
- E. O'Grady and N. Kaltsoyannis, Phys. Chem. Chem. Phys., 2004, 6, 680–687 RSC.
- W. Zou, D. Nori-Shargh and J. E. Boggs, J. Phys. Chem. A, 2013, 117, 207–212 CrossRef CAS.
Footnote |
| † Electronic supplementary information (ESI) available. See DOI: 10.1039/d0cp06175a |
| This journal is © the Owner Societies 2021 |

