 Open Access Article
Creative Commons Attribution 3.0 Unported Licence
Structural and optical properties of Be, Mg and Ca nanorods and nanodisks†
A. G.
Chronis
,
F. I.
Michos
,
C. S.
Garoufalis
and
M. M.
Sigalas
 *
*
Department of Materials Science, University of Patras, GR-26504 Patras, Greece. E-mail: sigalas@upatras.gr
First published on 7th January 2021
Abstract
Nanorods and nanodisks of Be, Mg, and Ca with different shapes and sizes have been theoretically studied. Stable structures have been identified and their electronic and optical properties have been thoroughly examined by means of Density Functional Theory (DFT), Time Dependent DFT (TDDFT) and Real Time TDDFT (RT-TDDFT) calculations. The derived properties and trends are systematically compared to the corresponding ones of 0D structures revealing the effect of size and dimensionality. On top of that, the possible emergence of plasmonic behavior for intense resonance peaks of larger nanoparticles is also examined with the help of suitable transition contribution maps (TCM) and induced density isosurface plots.
Introduction
Over the last three decades, small metal clusters and metal nanoparticles have earned a lot of attention due to a number of interesting properties which are strongly dependent on their structural characteristics and morphologies.1–3 Both experimental and theoretical work has been conducted on metal nanoclusters in an effort to describe the evolution from molecular states to bulk metallic character. The critical size at which such a transition takes place is of great interest. For example, it has been shown that for the case of nanoplates, parameters such as diameter, thickness and facet orientations can play a crucial role in determining the stability and the evolutions of various properties of the material.4Beryllium, magnesium and calcium clusters, belonging to the group-IIA alkaline-earth metals, are particularly interesting because they have two valence electrons, quasi-filled closed shells, and in bulk they are metals because of the overlap between s and p bands. There have been many studies focusing on the equilibrium geometries and the electronic structure of such clusters.5–11 Among others, it has been found that the highest occupied and lowest unoccupied molecular orbital (HOMO–LUMO gap) becomes smaller as the numbers of interacting Mg atoms increases and eventually leads to the onset of metallic behavior.12,13 Beyond such expected behavior of size dependence of common properties, interesting conclusions can also be drawn from the small cluster regime. For example, for Ca12 cluster, it has been shown that the lowest-energy isomer undergoes a structural transition as a function of temperature and the structure is changed at about 317 K (ref. 14). Similarly, it has been demonstrated that the ground-state geometry of calcium clusters undergoes a significant change when an extra electron is added.15 For the case of Be clusters, there are many studies which analyze the rapidly increasing strength of the Be–Be bond as a function of cluster size and of non-additive many-body interactions.16–18 Larger clusters of Be (n ≥ 6) could be studied by anion photodetachment spectroscopy and have a similar approach to be examined for HOMO–LUMO gap with Mgn clusters (n = 5–35).19–21 On the theoretical part, there have been numerous computational studies of Mgn (ref. 11 and 22), Can (ref. 14 and 23), and Ben (ref. 17 and 24–26), nanoclusters dealing with the whole spectrum of properties (e.g. structural, electronic, etc.). However, since the focus has not yet been turned on the possible stability and properties of rod- or disk-shaped nanoparticles, the present contribution aims at making the first steps towards this direction. The motivation towards this direction is even more intensified since the recent,27 fabrication of Mg NPs with sizes ranging from 162 to 273 nm makes them suitable alternative to the commonly used Ag or Au metal NPs.
In present manuscript, the differences between spherical nanoparticles, nanorods and nanodisks are highlighted with the help of Density Functional Theory (DFT) calculations. Depending on the desired property, different aspects of the DFT methodology is employed (GGA or hybrid ground state calculation or TDDFT and RT-TDDFT for excited states). Similar calculations have been used successfully for Ti doped Boron nanoclusters,28 single-walled carbon nanotubes,29 metal decorated Boron nitride flakes30 and metal decorated graphene nanoribbons.31 As a first step, it is required to identify stable structures and understand the growth pattern and stability of the nanodisks and nanorods.
At this point it is worth noting that the HOMOs and LUMOs of larger clusters can be accurately calculated using bond-centric (BC) model32 and DFT with scissors operators, which are appropriate for occupied and unoccupied states near the Fermi level with which most electronic and optical properties of metallic clusters are associated.33 In addition, using the Time Dependent DFT (TDDFT), is to investigate the effect of free electron character to their plasmonic performance was also investigated34 and to find nanodisks and nanorods, which combine thermodynamic stability with almost the whole absorption spectrum in the visible spectrum.
The discussion of structural and sized-dependent electronic and optical properties of such clusters follows.
Computational methods
The procedure of identifying stable geometric configurations of the aforementioned type of clusters included multiple geometry optimizations of several different variants of candidate structures (at least 10). Using the optimized geometries of one step, new initial configurations were constructed by adding atoms in different directions following a trial an error fashion. All optimizations were performed employing Density Functional Theory (DFT) within the generalized gradient approximation (GGA). More specifically, the gradient corrected functional of Perdew, Burke and Ernzerhof (PBE)35 was used consistently in all calculation involving structural optimization. The procedure was performed in two steps. Initially the structures were optimized with the def2-SVP basis set,36,37 while the final geometries were obtained with the larger def2-TZVP38 basis set. These geometries and the same basis set were subsequently used for frequency calculations and vibrational analysis. All the described calculations have been performed with the Turbomole suite of programs.39 It should be noted that the vibrational analysis has only been performed for structures with up to 54 atoms. In all cases regarding final structures (presented in this manuscript) no imaginary frequencies were found. This is highly indicative of structural stability. For larger nanoparticles, the computational cost of vibrational analysis was prohibitive. As a result, only the case of Mg72 (nanorods) was considered confirming the absence of any imaginary frequencies.The calculation of excited states properties has been performed either with TDDFT methodology and the Turbomole suite of programs or with RT-TDDFT methodology and the GPAW40 suite of programs. The latter offers the advantage of producing a large part of the absorption spectrum (and not just a few low-lying excited states) with a single calculation. In any case, the optimized geometries were used. For the spherical NPs shown below, we are mostly interested to compare them with the corresponding nanorod and nanodisk NPs and for that reason they may not correspond to global minima of the configuration hypersurface for the particular number of atoms.
The considered structures
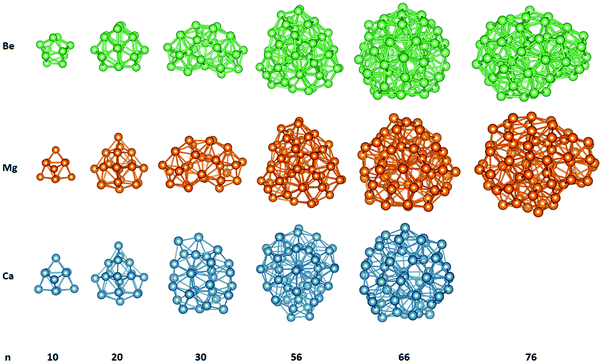
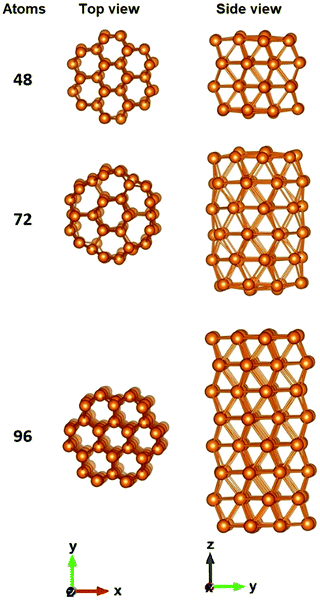
The motivation of the present study was to consider the possibility of stable nanorod and nanodisk like alkaline-earth metal NPs and study their electronic and optical properties. For that reason, nanorods structures were created with their axis being along the crystallographic [001] direction. We wanted to compare those structures and their absorption spectra with some spherical nanoparticles. So, we also created some small Be, Mg and Ca nanoparticles. Those spherical structures are presented in Fig. 1. Later we will study the absorption spectra of those nanoparticles. Bex, Mgx and Cax, where x = 10, 20, 30, 56, 66 and 76 are created. The Ca76 nanoparticle was not considered due to computational difficulties related to SCF convergence. Several structures are similar to each other.In Fig. 2 some representative nanorod-like structures considered here are presented. As evident from this figure the cross section of these cylindrical shaped NPs, consists of a central hexagon surrounded by another six hexagons. The growth direction of the nanoparticle is along the [001] direction. The shortest NP consists of only two layers of atoms and in practice it is just a nanodisk. As the number of layers increases, the nanoparticle becomes more rod-like. The structures with 48 atoms, by having an aspect ratio close to 1, are like a ‘spherical’ particle since they experience the same confinement in all directions (Table 1).
| Length (Å) | Average diameter (Å) | |
|---|---|---|
| Be48 | 5.52 | 5.87 |
| Mg48 | 8.26 | 8.60 |
| Be72 | 9.04 | 6.67 |
| Mg72 | 14.48 | 10.26 |
| Be96 | 12.45 | 12.26 |
| Mg96 | 17.68 | 17.74 |
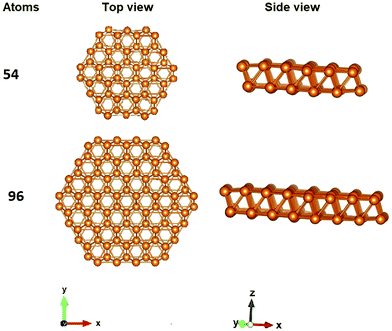
All nanodisk geometries, consist of two layers of atoms along the (001) plane with hexagonal cross section. The thickness is kept constant (two layers) while in the in-plane direction the size of the nanoparticles increases (Table 2). Representative nanodisks are depicted in Fig. 3. It should be mentioned that, as expected, NPs with one layer of atoms were unstable exhibiting imaginary vibrational frequencies and a tendency to collapse to more compact structure.
| Average diameter (Å) | |
|---|---|
| Be54 | 10.61 |
| Mg54 | 15.59 |
| Ca54 | 19.48 |
| Be96 | 14.98 |
| Mg96 | 21.39 |
| Ca96 | 27.34 |
Results and discussion
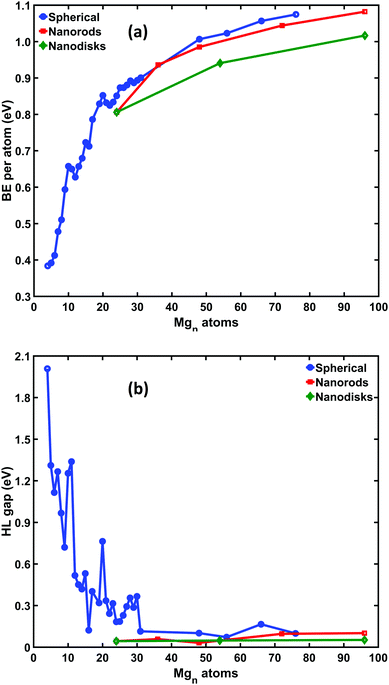
All nanoparticles presented here exhibit a relative structural stability by passing the vibrational analysis criterion without any imaginary frequencies. Although, this does not imply that the aforementioned nanostructures are global minima of the potential hypersurface, it is highly indicative that the specific geometric configurations are dynamically stable.The evolution of this structural stability with regard to the nanoparticles size can be realized by analyzing the trends of the binding energy per atom and the HOMO–LUMO gap. These trends, for the case of Mg nanostructures, are graphically presented in Fig. 4, while the corresponding values can be found in Tables S1–S3 of the ESI.† It is noted that the binding energy per atom can be written as:
| Eb = (nEatom − Etot)/n |
As is evident from Fig. 4(a), the BE per atoms of the so called 0D structures is higher than in any other case and increases (as expected) as the size of the nanoparticle becomes larger. Moreover, it is clear that BE/atom tends asymptotically to a value which (naturally) corresponds to the bulk limit. For the case of nanorods, although the BE/atom is slightly lower than its 0D counterpart, it follows closely the above trend. The close proximity of the two curves is highly suggestive that Mg nanorods of specific dimensions are structures of comparable stability with the more randomly assembled 0D ones, and their experimental fabrication might be feasible. On the contrary, the BE/atom of the corresponding nanodisks is significantly smaller, making them less favorable.
It interesting to note that the two prominent bumps of BE/atom around n = 10 and n = 20, match rather well with analogous peaks in the HOMO–LUMO gap variation in accordance with the maximum hardness principle.41
A close inspection of the NPs electronic density of states plots (Fig. 5), reveals some interesting qualitative differences with respect to the composition of their band edges. In particular, for nanorod NPs the states below HOMO and the states above LUMO exhibit a clear sp character while for nanodisks the s contribution is significantly smaller and in many cases, it is almost vanishing, leading to an almost pure p character.
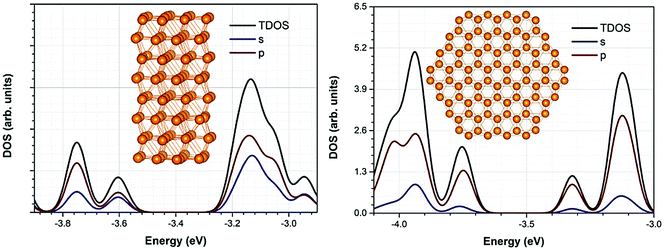 | ||
| Fig. 5 Density of States (DOS) and projected DOS (PDOS) of representative nanorod and nanodisk structure. | ||
UV/Vis spectrum for spherical nanoparticles
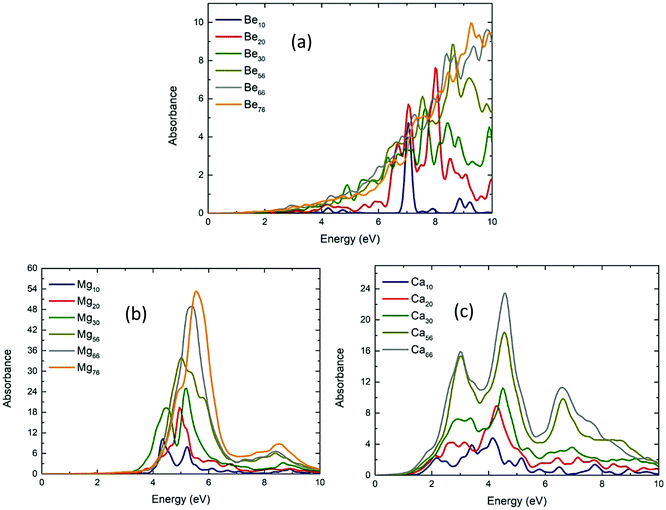
The absorption spectrum for three-dimensional geometries is shown in Fig. 6 for the Be (Fig. 6a), Mg (Fig. 6b), and Ca (Fig. 6c) NPs, respectively. There are some differences between the absorption spectra along the three different directions. Those differences are eliminated as the number of atoms increases. This can be expected as the shape of the NPs become more uniform (spherical) as the number of the atoms increases. In any case, the absorption spectra are shown in Fig. 6 and are the average total absorption spectra.There are some similarities in the absorption spectra in Fig. 6. Be NPs have significant absorption peaks at very high energies (above 6.30 eV). Mg NPs have their lowest energy absorption peak at around 4.32–5.59 eV, while Ca NPs have their first absorption peak at even lower energies at around 2.17 eV. Except for Be10 which has a very strong absorption peak at 7.04 eV, for NPs of the same number of atoms, the Mg NPs have absorption peaks at least twice as strong from both Be and Ca NPs. The bigger Mg NPs have a strong resonance at around 5.5 eV, while the bigger Ca NPs have three lower absorption resonances at about 3, 4.5 and 6.5 eV. On the other hand, bigger Be NPs do not show any strong resonances, instead they have a gradual increase of absorption, as the energy increases. It is also observed that as the structure becomes larger, the absorption increases.
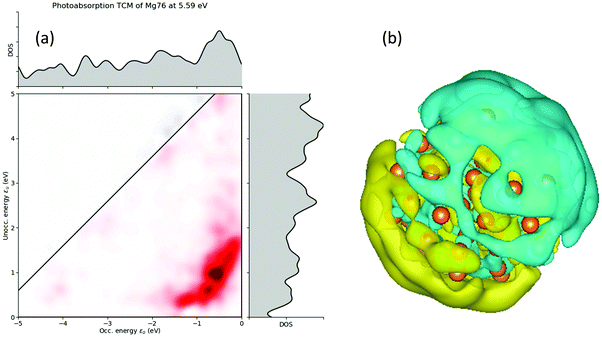
For larger size 3D NPs, the absorption spectra tend to become similar. For the n = 66 and 76 NPs, the spectra are almost the same. For Be76 and Be66, the absorption is almost constantly increasing (Fig. 6a). On the other hand, Mg76 and Mg66 NPs have a very strong resonance peak at around 5.59 and 5.36 eV, respectively. This is in good agreement with the predicted plasmon resonance of Mg NPs at around 5 eV (ref. 27 and 42). The Ca66 NPs has its first resonance at around 3.02 eV, also in good agreement with the predicted value at around 2.5 eV (ref. 42). To further explore those resonance peaks, the transition contribution maps (TCM) for the photo-absorption decomposition of the Mg76 NP at the 5.59 eV resonance (Fig. 6a) is shown if Fig. 7a. It is clearly shown that there is a wide range of positive transitions contributing to that resonance (indicated by red at Fig. 7a). As it is pointed in ref. 41, the increased number of single particle contributions depicted with a widespread red area in a TCM image, is suggestive of a possible emergence of plasmonic behavior, which might become more evident in larger nanoparticles. An additional indication that this resonance peak is due to plasmons is by plotting the electron density profile at that resonance. As it is shown in Fig. 7b, there is a charge density concentration in oppose surfaces of the NP which is again an indication of its plasmonic behavior.
UV/Vis spectrum for nanorods
The UV/vis absorption spectra of Be48 and Mg48 is shown in Fig. 8. As can be seen, the absorption of these structures on the x-axis and y-axis is almost the same but differs on the z-axis. However, the difference in the absorption is not as significant as in the other cases that will be considered. This is explained by the morphology of the structure (see the inset in Fig. 2), which is the same along x and y axis and changes slightly along the z axis. The absorption spectrum of Be48 has significant peaks at around 4.74 and 6.49 eV for the z and x (or y) axis, respectively. The absorption spectrum of Mg48 NPs has much stronger resonances (about 5 times higher absorption than in Be48) at around 4.76 and 5.17 eV for the z and x (or y) axis.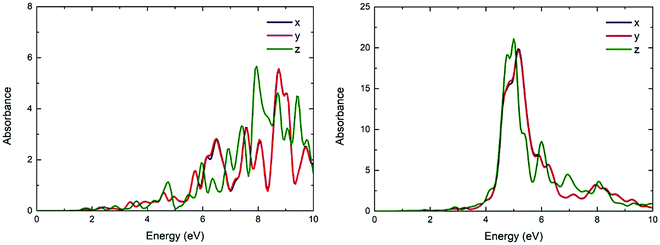 | ||
| Fig. 8 The UV/vis absorbance spectra of the Be48 (a) and Mg48 (b) in x, y, z directions (blue, red and green lines, respectively). | ||
By increasing the number of layers along the [001] direction to six, NPs with 72 atoms were constructed (Fig. 9). The absorbance for both Be72 and Mg72 is almost the same on the x-axis and on the y-axis, while being different on the z-axis, due to their geometry. In both structures, the absorbance has the peak appearing at lower energies along the z-axis. The absorbance of the Mg72 structure along the z axis has an intense peak at about 4.28 eV while the peaks along the x and y axis appear above 5.00 eV and they are almost two times less intense. As in the previous cases, the absorbance of Be72 increases gradually and it has much less intense peaks.
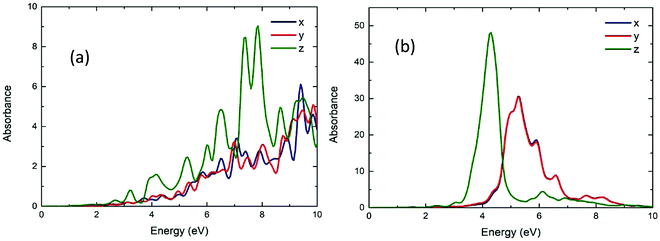 | ||
| Fig. 9 The UV/vis absorbance spectra of the Be72 (a) and Mg72 (b) in x, y, z directions (blue, red and green lines, respectively). | ||
Further increasing the number of layers along the [001] direction to eight, NPs with 96 atoms were constructed (Fig. 10). The absorbance of Mg96 has a peak at around 4.07 eV along the z axis and the peaks along the x or y axis appear above 5.22 eV. The absorbance of both Be96 and Mg96 NPs (Fig. 10) is similar as the Be72 and Mg72 NPs (Fig. 9). However, comparing Fig. 9b and 10b, the peaks along the z axis become more intense and the ones along the x (or y) axis become less intense as the length of the NPs increase. Interestingly, the resonance frequency of the absorbance peak along the z axis moves to lower energies as the length of the NPs increases. The absorbance of Mg48, Mg72, and Mg96, is 4.74, 4.30, and 2.42 eV, respectively.
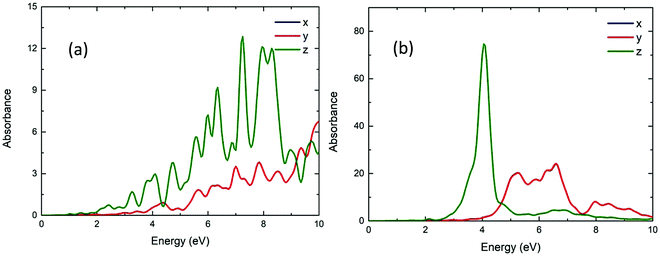 | ||
| Fig. 10 The UV/vis absorbance spectra of the Be96 (a), Mg96 (b) in x, y, z directions (blue, red and green lines, respectively). | ||
UV/Vis spectrum for nanodisks
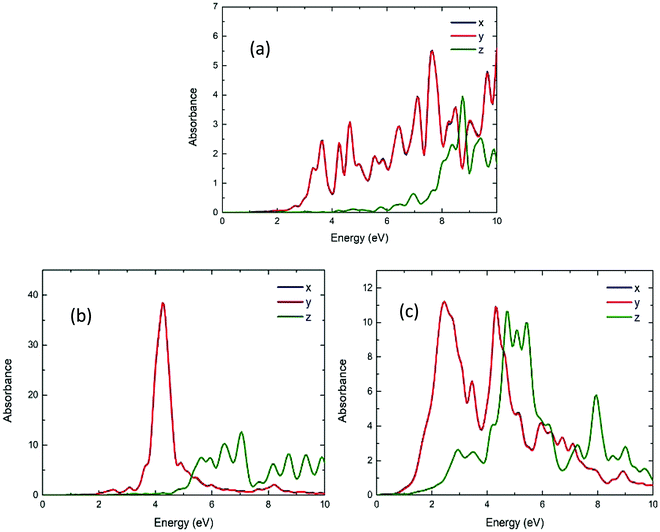
Fig. 11 shows the calculated UV/vis absorption spectra of Be54, Mg54 and Ca54. These have two layers of atoms (nanodisks geometries). Due to their geometry, it is observed that the absorption is almost the same on the x-axis and y-axes, while being significantly different on the z-axis. Comparing with the spherical geometries, the optical gap moves to lower energies. More specifically, the first absorption peak appears at around 3.28, 4.27 and 2.44 eV and the absorbance are about 6, 40 and 12 a.u. for Be54, Mg54 and Ca54, respectively.Fig. 12 shows the calculated UV/vis absorption spectra of Be96, Mg96 and Ca96 nanoparticles with two layers of atoms (2D geometries). Like Fig. 11, the absorption is almost identical to the x and y directions and differs when the structure is in the shape of nanorod (z-axis). It is also observed that increasing the size of the structures increases the absorbance, while the optical gap is within the visible spectrum and appears at 2.40, 4.00 and 2.35 eV and the absorbance are about 1, 65, and 25 a.u. for Be96, Mg96 and Ca96, respectively.
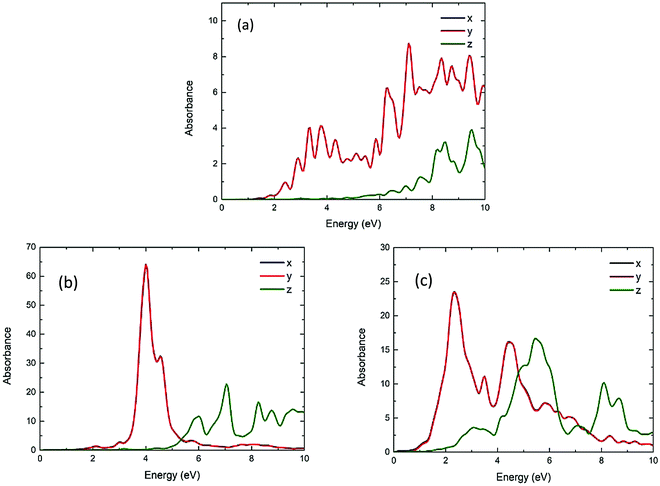 | ||
| Fig. 12 The UV/vis absorbance spectra of the Be96 (a), Mg96 (b) and Ca96 (c) in x, y, z directions (blue, red and green lines, respectively). | ||
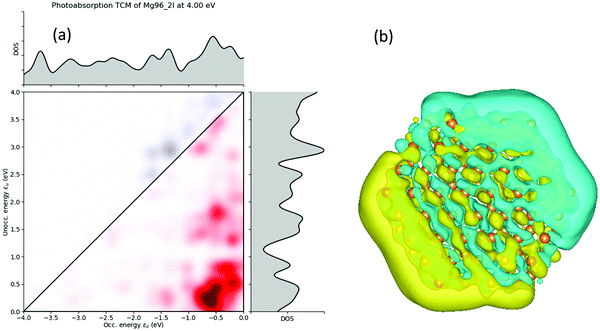
Further exploring the resonance peaks, the transition contribution maps (TCM) for the photo-absorption decomposition of the nanodisks Mg96 NP at the 4.00 eV resonance (Fig. 12) is shown in Fig. 13(a). There is a wide range of positive transitions contributing to that resonance (indicated by red in Fig. 12). As it was mentioned earlier (see also ref. 40) this is a clear indication of a plasmon resonance. This is also confirmed by plotting the induced density profile at that resonance. As it is shown in Fig. 13(b), there is a charge density concentration at oppose surfaces of the NP which is again an indication of its plasmonic behavior.
Comparing the nanorods and nanodisks geometries of Mg96 (Fig. 10 and 12), there is a resonance at about the same energy (4.07 and 4.00 eV) with almost the same intensity. Comparing those resonances with the corresponding ones in the spherical NPs (Mg66 and Mg76 in Fig. 6b), there is a significant reduction in the resonance frequency (from about 5.59 eV in 3D NPs to about 4.00 eV in nanorods and nanodisks NPs). For nanorods and nanodisks Be NPs (Fig. 10 and 12), there is significant increase in the absorbance in lower energies (above 2.40 eV) well inside the visible spectrum, while the corresponding spherical Be geometries (Fig. 6a) have similar absorbances for energies well above the 4 eV. The absorbance of Ca NPs is less affected by its geometries. For Ca nanodisks NPs (Fig. 12) the first resonance is at about 2.35 eV while for corresponding 3D Ca NPs (Fig. 6c) the first resonance appears at 2.17 eV.
Conclusions
Using DFT and TDDFT the stability and absorbance spectra of Be, Mg, and Ca NPs with nanorods and nanodisks were calculated. The nanorods NPs were made from NPs grown along the [001] crystalline direction. Stable structures were found with at least two layers of atoms along that direction. The nanodisks NPs had only two layers of atoms along the [001] direction and they were grown along the perpendicular plane. Nanorods and nanodisks configurations had absorbance resonances in lower energies compared with their spherical NPs. For spherical Be NPs, the absorbance was above 1 a.u. for energies well above 4.75 eV while their nanorods and nanodisks Be NPs had absorbances above 1 a.u. for energies above 2.41 eV (see Fig. 12). The first absorbance resonances were at around 4.31 eV for spherical Mg NPs while the nanorods and nanodisks Mg NPs the first absorbance resonance was at around 4.00 eV. The smallest differences were observed for Ca NPs. The spherical Ca NPs had their first absorbance peaks at around 2.17 eV while the nanodisks Ca NPs had peaks at around 2.35 eV. The transition contribution maps (TCM) for the photo-absorption decomposition of the Mg NPs resonances showed a wide range of positive transitions contributions, an indication of a plasmon resonance. This was further confirmed from the induce densities at those resonances that had charge density concentration in opposing surfaces of the NPs as it is expected for plasmonic resonances.Conflicts of interest
There are no conflicts to declare.Acknowledgements
The authors would like thank E. N. Koukaras for helpful discussions.References
- P. Jena and A. W. Castleman, Proc. Natl. Acad. Sci. U. S. A., 2006, 103, 10560–10569 CrossRef CAS.
- M. L. Cohen, M. Y. Chou, W. D. Knight and W. A. D. Heer, J. Phys. Chem., 1987, 91, 3141–3149 CrossRef CAS.
- J. Jellinek and P. H. Acioli, J. Phys. Chem. A, 2002, 106, 10919–10925 CrossRef CAS.
- X. Chen, R. Huang, T. M. Shih and Y. H. Wen, Nanoscale Res. Lett., 2019, 14, 357 CrossRef.
- S. N. Belyaev, S. V. Panteleev, S. K. Ignatov and A. G. Razuvaev, Comput. Theor. Chem., 2016, 1079, 34 CrossRef CAS.
- X. Xia, X. Kuang, C. Lu, Y. Jin, X. Xing, G. Merino and A. J. Hermann, J. Phys. Chem. A, 2016, 120, 7947 CrossRef CAS.
- K. Duanmu, J. Friedrich and D. G. Truhlar, J. Phys. Chem. C, 2016, 120, 26110 CrossRef CAS.
- I. A. Solov’yov, A. V. Solov’yov and W. Greiner, J. Phys. B: At., Mol. Opt. Phys., 2004, 37, L137 CrossRef.
- J. Wang, G. Wang and J. Zhao, J. Phys., 2001, 13, L753–L758 CAS.
- R. Shinde and A. Shukla, Eur. Phys. J. D, 2017, 71, 301 CrossRef.
- E. N. Koukaras, A. D. Zdetsis and M. M. Sigalas, J. Am. Chem. Soc., 2012, 134, 15914–15922 CrossRef CAS.
- O. C. Thomas, W. Zheng, S. Xu and K. H. Bowen Jr, Phys. Rev. Lett., 2002, 89, 213403 CrossRef.
- C. Sikorska, ChemPhysChem, 2019, 20, 2236–2246 CrossRef CAS.
- J. W. Mirick, C. H. Chien and E. Blaisten-Barojas, Phys. Rev. A: At., Mol., Opt. Phys., 2001, 63, 023202 CrossRef.
- X. Liang, X. Huang, Y. Su and J. Zhao, Chem. Phys. Lett., 2015, 634, 255–260 CrossRef CAS.
- J. S. Lee, J. Phys. Chem. A, 2005, 109, 11927–11932 CrossRef CAS.
- S. Srinivas and J. Jellinek, J. Chem. Phys., 2004, 121, 7243–7252 CrossRef CAS.
- M. K. Beyer, L. A. Kaledin, A. L. Kaledin, M. C. Heaven and V. E. Bondybey, Chem. Phys., 2000, 262, 15–23 CrossRef CAS.
- M. J. Nee, A. Osterwalder, J. Zhou and D. M. Neumark, J. Chem. Phys., 2006, 125, 014306 CrossRef.
- M. C. Heaven, J. M. Merritt and V. E. Bondybey, Annu. Rev. Phys. Chem., 2011, 62, 375–393 CrossRef CAS.
- D. Labanc, M. Šulka, M. Pitoňák, I. Černušák, M. Urban and P. Neogrády, Mol. Phys., 2018, 116, 1259–1274 CrossRef CAS.
- J. S. Lee, Phys. Rev. A: At., Mol., Opt. Phys., 2003, 68, 043201 CrossRef.
- X. Liang, X. Huang, Y. Su and J. Zhao, Chem. Phys. Lett., 2015, 634, 255–260 CrossRef CAS.
- J. M. Merritt, V. E. Bondybey and M. C. Heaven, Science, 2009, 324, 1548–1551 CrossRef CAS.
- E. Fromager, R. Cimiraglia and H. J. A. Jensen, Phys. Rev. A: At., Mol., Opt. Phys., 2010, 81, 024502 CrossRef.
- V. Vetere, A. Monari, A. Scemama, G. L. Bendazzoli and S. Evangelisti, J. Chem. Phys., 2009, 130, 024301 CrossRef.
- J. S. Biggins, S. Yazdi and E. Ringe, Nano Lett., 2018, 18, 3752–3758 CrossRef CAS.
- S. Chopra and T. Lu, Theor. Chem. Acc., 2020, 139, 136 Search PubMed.
- S. Chopra, Mol. Phys., 2019, 117, 71–78 CrossRef CAS.
- S. Chopra and F. Plasser, Mol. Phys., 2017, 115, 2469–2477 CrossRef CAS.
- S. Chopra, RSC Adv., 2016, 6, 20565–20570 RSC.
- Z. Yan, M. G. Taylor, A. Mascareno and G. Mpourmpakis, Nano Lett., 2018, 18, 2696–2704 CrossRef CAS.
- T. Zeng and Y. He, J. Appl. Phys., 2018, 124, 044305 CrossRef.
- M. G. Blaber, M. D. Arnold and M. J. Ford, J. Phys., 2010, 22, 143201 CAS.
- J. P. Perdew, K. Burke and M. Ernzerhof, Phys. Rev. Lett., 1996, 77, 3865–3868 CrossRef CAS.
- A. Schafer, H. Horn and R. Ahlrichs, J. Chem. Phys., 1992, 97, 2571 CrossRef.
- K. Eichkorn, F. Weigend, O. Treutler and R. Ahlrichs, Theor. Chem. Acc., 1997, 97, 119 Search PubMed.
- F. Weigend and R. Ahlrichs, Phys. Chem. Chem. Phys., 2005, 7, 3297 RSC.
- TURBOMOLE, TURBOMOLE GmbH, Karlsruhe, Germany, 1989–2007 Search PubMed.
- M. Walter, H. Häkkinen, L. Lehtovaara, M. Puska, J. Enkovaara, C. Rostgaard and J. J. Mortensen, J. Chem. Phys., 2008, 128, 244101 CrossRef.
- R. G. Pearson, Acc. Chem. Res., 1993, 26, 250–255 CrossRef CAS.
- T. P. Rossi, M. Kuisma, M. J. Puska, R. M. Nieminen and P. Erhart, J. Chem. Theory Comput., 2017, 13, 4779–4790 CrossRef CAS.
Footnote |
| † Electronic supplementary information (ESI) available. See DOI: 10.1039/d0cp05780k |
| This journal is © the Owner Societies 2021 |

