Terahertz response of DL-alanine: experiment and theory†
T. J.
Sanders
 *,
J. L.
Allen
 ,
J.
Horvat
 and
R. A.
Lewis

Institute of Superconducting and Electronic Materials, School of Physics, University of Wollongong, Wollongong, NSW 2522, Australia. E-mail: tjs804@uowmail.edu.au
First published on 18th December 2020
Abstract
The terahertz (THz) spectrum of DL-alanine has been measured for the first time at cryogenic temperatures and with a pure sample. Several sharp absorptions are observed, over a wide frequency range (0.8–4.8 THz), at 8 K. The sample structure and purity were confirmed with both Raman spectroscopy and X-ray diffraction. Temperature dependent spectra revealed redshifting, with increasing temperature, for all modes except one at 2.70 THz. This mode exhibits blueshifting until ≈120 K, where it starts to redshift. A Bose–Einstein distribution has been used to model the frequency shift with temperature for the four lowest energy modes. Strong correlations between the fits and data indicate that these modes are caused by phonon excitation in an anharmonic potential. Density functional theory has also been used to identify the origin of these low frequency modes. They are attributed to large scale molecular vibrations.
1 Introduction
Terahertz (THz) spectroscopy is a proven tool for studying intermolecular bonds, particularly those of biomolecules.1–6 This is due to the energy of photons in the terahertz range, 0.1–3 THz, being equal to the energy of large scale molecular vibrations that are mediated by intermolecular bonds.1 These bonds, which are prevalent in organic materials, have the potential to provide a spectral fingerprint once a data-base is established.Amino acids are an important class of organic material that are the building blocks of proteins required for living tissue. The important biological functions of amino acids are achieved by strong intermolecular bonds. These are formed from the zwitterionic structure, where positive amine and negative carboxyl groups attract between neighbouring molecules.
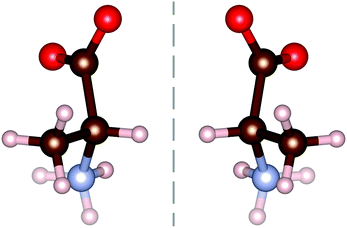
All amino acids, excluding the simplest (glycine), have a mirror symmetry known as chirality. The second simplest amino acid, alanine (C3H7NO2), has these chiral counterparts, as shown in Fig. 1, with the L-form being commonly found within living organisms. L-Alanine has been extensively studied using terahertz spectroscopy,7–11 often in comparison to the D-enantiomer. Very few studies into the racemic compound DL-alanine have been undertaken,4,12–14 all of which focus on the individual enantiomers. Interestingly, DL-alanine still forms the same head to tail amine–carboxyl bonds as its enantiomer constituents.
The molecular structure of DL-alanine is visualised in Fig. 2 which shows the unique crystal structure, where planes of each enantiomer can be seen parallel to the bc-plane. Intermolecular bonds in these planes are very similar to those in the pure enantiomer as they are composed of the same molecules in the same orientation with the same distance between molecules.15 However, intermolecular bonds along the a-axis are unique to the chiral form, as they are between D- and L-molecules.
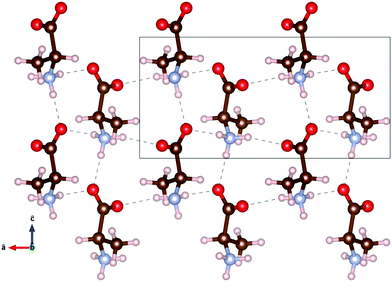 | ||
Fig. 2 1.5 × 2 unit cells of DL-alanine, with the hydrogen bond threshold set to 2.5 Å. The box represents one unit cell. The unit vectors â and ĉ are shown, with the ![[b with combining circumflex]](https://www.rsc.org/images/entities/i_char_0062_0302.gif) unit vector out of the page. Atomic positions and bond lengths, a = 12.0 Å, b = 6.0 Å, c = 5.8 Å, are taken from Nandhini et al.15 unit vector out of the page. Atomic positions and bond lengths, a = 12.0 Å, b = 6.0 Å, c = 5.8 Å, are taken from Nandhini et al.15 | ||
Previous terahertz spectra of DL-alanine4,12–14 have only been reported at room temperature and within limited spectral ranges. Here, both the use of cryogenic temperatures and a wide frequency range of 0.8–4.8 THz have been employed. The temperature dependence of this spectrum and the absorptions within this broader range have been investigated for the first time.
2 Modelling
2.1 Density functional theory
Density functional theory (DFT) modelling was performed with the Crystal17 package.16 Geometry optimisation was performed using the initial geometry from Nandhini et al.15 The B97-3c density functional was used, which has been well tested for molecular crystals.17,18 It incorporates the dispersion, counter-poise and short-range basis set corrections. Modified def-TZVP basis sets19 are used with this functional, named mTZVP.19,20 Very tight convergence criteria were used in the geometry optimisation. The energy convergence tolerance in self-consistent field cycles was 10−12 hartree. The geometry convergence was achieved with the following criteria: RMS energy gradient lower than 10−6 hartree per bohr, maximum energy gradient 2 × 10⁻⁶ hartree per bohr, maximum atomic displacement 4 × 10⁻⁵ bohr and RMS displacement 10−6 bohr. The infrared absorption spectrum was calculated in the harmonic approximation. The intensity of the absorption bands was obtained within the Berry phase approach.21,222.2 Temperature dependence
The temperature dependence of intermolecular absorptions is governed by the atomic potentials, which are anharmonic.11 This means that, as the atoms involved in an intermolecular bond vibrate, their average displacement is proportional to their energy, and hence to the temperature. As temperature rises and atomic displacements increase, the elastic constant of the bonds is reduced. This lowers the frequency of modes resulting in lower energy photons being absorbed. The frequency of a mode shifting to lower values with increasing temperature will be referred to as redshift. This thermal expansion model is the usual explanation for the commonly observed redshift.23The shift in the absorption position with temperature can be fitted with a Bose–Einstein distribution,24 assuming it is entirely mediated by phonons. In this quantum description of vibrational modes, the change in mode energy, ω, with temperature, T, is given by:
 | (1) |
3 Experimental
3.1 Sample preparation
Powdered DL-alanine was purchased from Sigma Aldrich with a purity of ≥99%. This pure powder was compressed into an 0.8 mm thick, 13 mm diameter pellet under 48 MPa without a binding medium. Previous studies of DL-alanine have used binding media, of either polyethylene or magnesium oxide. The use of binding media for pellets of L-alanine has lead to additional features being reported in the terahertz spectrum,25 so their use was avoided for its racemic partner studied here.Single crystals were also investigated as a potential sample form; however only small needle-like crystals26 of the order of 2.0 × 1.0 × 0.5 mm3 have been previously reported.27 Crystals of this size are too small and fragile to be effectively mounted and positioned for temperature dependent measurements. Hence a pure pellet of powder was chosen as the most suitable sample form.
3.2 Raman spectroscopy
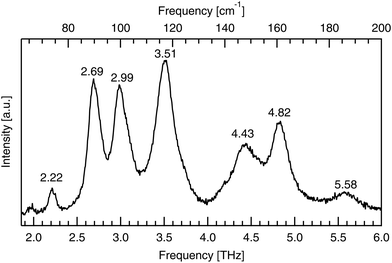
Raman spectroscopy was used to validate the purity of the bought powder. Measurements were taken using a LabRAM HR Evolution spectrometer (Horiba Scientific) in a backscattering configuration, at room temperature with 474 THz laser excitation. Low frequency Raman modes correspond to intermolecular bonds exactly, like infrared-active modes, but have different excitation requirements, according to the different quantum selection rules governing each. The low frequency spectrum seen in Fig. 3 identifies seven peaks between 1.85 and 6.00 THz. These low energy peaks match with the literature as seen in Table 1, as do the higher energy peaks shown in Fig. 4.| This work [THz] | This work [cm−1] | Ref. 28 [cm−1] | Ref. 29 [cm−1] | Ref. 30 [cm−1] |
|---|---|---|---|---|
| a Peak positions extracted from graphs. Spectral range from 1200–1350 cm−1 not reported. | ||||
| 2.22 | 74 | 72 | ||
| 2.69 | 90 | 90 | 89 | |
| 2.99 | 100 | 99 | 98 | |
| 3.51 | 117 | 117 | 119 | 115 |
| 4.43 | 148 | 147 | 149 | |
| 4.82 | 161 | 160 | 159 | 160 |
| 5.58 | 186 | 186 | 180 | |
| 6.84 | 228 | 229 | 259 | |
| 8.47 | 282 | 283 | 286 | |
| 10.05 | 335 | 337 | ||
| 12.21 | 407 | 408 | 412 | 408 |
| 16.26 | 543 | 542 | 547 | 543 |
| 19.33 | 645 | 645 | 645 | 644 |
| 23.07 | 770 | 772 | 771 | 770 |
| 25.51 | 851 | 852 | 854 | 852 |
| 27.62 | 921 | 926 | 921 | 918 |
| 30.40 | 1014 | 1016 | 1015 | 1014 |
| 30.76 | 1026 | 1027 | 1030 | 1030 |
| 33.41 | 1114 | 1115 | 1115 | 1115 |
| 34.23 | 1141 | 1143 | 1141 | 1143 |
| 34.89 | 1164 | 1158 | 1155 | |
| 37.21 | 1241 | 1237 | ||
| 39.20 | 1308 | 1308 | 1307 | |
| 40.68 | 1357 | 1359 | 1356 | |
| 41.38 | 1380 | 1381 | 1380 | |
| 42.35 | 1413 | 1410 | 1413 | 1412 |
| 43.75 | 1459 | 1461 | 1461 | 1460 |
| 44.40 | 1481 | 1481 | 1483 | |
| 45.57 | 1520 | 1518 | 1526 | 1520 |
| 47.79 | 1594 | 1592 | 1595 | 1593 |
| 1618 | 1621 | |||
| 49.57 | 1654 | 1648 | 1653 | |
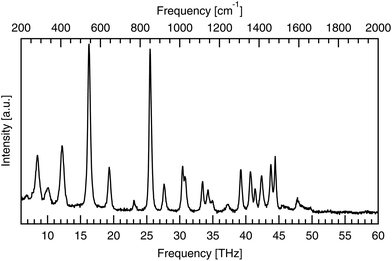 | ||
| Fig. 4 High frequency (6–60 THz) Raman spectra of powdered DL-alanine, with 474 THz laser excitation and a pump power of 8.5 mW incident on the sample. | ||
The low frequency limit of the reported spectra is restricted by the instrumentation used. Lower frequency data still has been previously reported by Aviv et al.,31 who report the same peaks below 6.00 THz as seen here with the addition of another, even lower energy peak at 1.2 THz (40 cm−1). This peak, along with the next two lowest energy features at 2.22 and 2.69 THz, are also visible in the optical terahertz spectrum of DL-alanine, as will be shown in the Results and discussion section.
3.3 X-ray diffraction
To complement the Raman spectroscopy and further confirm the purity of the powder, X-ray diffraction (XRD) was performed using Cu K-α radiation from a first generation Empyrean diffractometer by Malvern Panalytical. The results are shown in Fig. 5 where room temperature measurements are compared to a calculated model based on the structure from Nandhini et al.15 There are no spurious features in the experimental results. This confirms the sample purity. Good agreement is seen between the peaks observed and the model. By a direct comparison between the calculated XRD-pattern from the known structure and the experimental results, the Miller indices of the observed peaks have been assigned.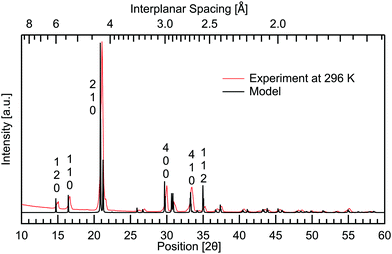 | ||
| Fig. 5 Powder X-ray diffraction of DL-alanine measured at room temperature and the VESTA32 calculated model, constructed using atomic parameters from Nandhini et al.15 Miller indices have been labelled vertically above prominent peaks. | ||
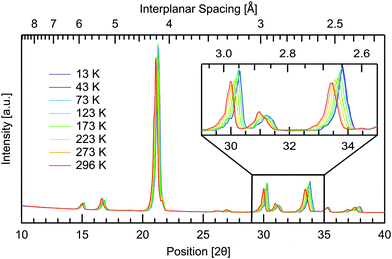
Temperature dependent measurements were also obtained to investigate if and how the crystal structure changes with temperature. A temperature range of 13–296 K was used, spanning the same range as the THz spectra, giving further insight into the changing intermolecular bonds. The results are presented in Fig. 6 where all planes are observed to increase in interplanar spacing with increasing temperature. This shifting is quantified in Table 2. Pairs of parallel planes are observed to shift by a comparable amount, validating the assignment of Miller indices. The largest change is seen in the 131, 331 and 620 planes with 1.12% difference in spacing from cryogenic to room temperature, while the 12![[2 with combining macron]](https://www.rsc.org/images/entities/char_0032_0304.gif) plane undergoes the least shifting with only 0.28% expansion over the temperature range studied. Along with 12
plane undergoes the least shifting with only 0.28% expansion over the temperature range studied. Along with 12![[2 with combining macron]](https://www.rsc.org/images/entities/char_0032_0304.gif) , the 112 and 113 planes also undergo a comparable minimal increase of 0.29%. These three planes are additionally the closest to being parallel with the ab plane. The planes closer to parallel with either the ac or bc planes then show the larger percentage increases in interplanar spacing with temperature. This indicates that the a and b axes are more affected by thermal expansion, as opposed to the c axis of the crystal. Head to tail intermolecular bonds between neighbouring amine and carboxyl groups along the c axis, seen in Fig. 2, may be responsible for the least shifting in this direction.
, the 112 and 113 planes also undergo a comparable minimal increase of 0.29%. These three planes are additionally the closest to being parallel with the ab plane. The planes closer to parallel with either the ac or bc planes then show the larger percentage increases in interplanar spacing with temperature. This indicates that the a and b axes are more affected by thermal expansion, as opposed to the c axis of the crystal. Head to tail intermolecular bonds between neighbouring amine and carboxyl groups along the c axis, seen in Fig. 2, may be responsible for the least shifting in this direction.
| Miller index | 13 K | 296 K | % increase |
|---|---|---|---|
| 1 2 0 | 5.827 | 5.877 | 0.87 |
| 1 1 0 | 5.269 | 5.316 | 0.88 |
| 2 1 0 | 4.166 | 4.212 | 1.11 |
2 0 ![[1 with combining macron]](https://www.rsc.org/images/entities/char_0031_0304.gif) |
4.091 | 4.111 | 0.48 |
2 1 ![[1 with combining macron]](https://www.rsc.org/images/entities/char_0031_0304.gif) |
3.387 | 3.407 | 0.59 |
| 3 1 0 | 3.273 | 3.305 | 0.96 |
| 4 0 0 | 2.948 | 2.978 | 1.03 |
| 4 1 0 | 2.649 | 2.677 | 1.07 |
| 1 1 2 | 2.536 | 2.544 | 0.29 |
2 2 ![[1 with combining macron]](https://www.rsc.org/images/entities/char_0031_0304.gif) |
2.408 | 2.430 | 0.91 |
2 1 ![[2 with combining macron]](https://www.rsc.org/images/entities/char_0032_0304.gif) |
2.372 | 2.396 | 1.03 |
| 3 2 1 | 2.197 | 2.219 | 0.99 |
| 4 2 0 | 2.098 | 2.121 | 1.09 |
| 4 0 2 | 2.066 | 2.077 | 0.53 |
1 2 ![[2 with combining macron]](https://www.rsc.org/images/entities/char_0032_0304.gif) |
2.050 | 2.056 | 0.28 |
4 2 ![[1 with combining macron]](https://www.rsc.org/images/entities/char_0031_0304.gif) |
1.971 | 1.990 | 0.96 |
| 4 1 2 | 1.958 | 1.971 | 0.68 |
| 6 0 1 | 1.869 | 1.889 | 1.06 |
| 1 3 1 | 1.850 | 1.871 | 1.12 |
| 1 1 3 | 1.819 | 1.824 | 0.29 |
5 1 ![[2 with combining macron]](https://www.rsc.org/images/entities/char_0032_0304.gif) |
1.763 | 1.772 | 0.49 |
| 3 3 1 | 1.693 | 1.711 | 1.12 |
| 6 2 0 | 1.647 | 1.665 | 1.12 |
3.4 THz instrumentation
Fourier transform spectroscopy (FTS) and terahertz time domain spectroscopy (THz-TDS) have both been employed here. The specifications of both systems along with the helium flow cryostat used for temperature dependence measurements have already been reported.24 Preliminary TDS measurements in the range of 50–300 K have also been previously reported,33 with a focus on the fundamental mode. That report was limited to a frequency range below 2.5 THz and also limited in the temperatures used. Here a broader temperature range of 8–295 K has been explored for DL-alanine within the spectral range of 0.8–4.8 THz using the FTS system.4 Results and discussion
4.1 Terahertz spectra
A comparison of the spectra from the FTS and TDS systems taken at cryogenic temperatures, as given in Fig. 7, shows the same four absorptions between 0.8–3 THz. Previous work33 confirms no absorptions below 0.8 THz. This comparison between experimental systems shows that the background is much smoother in the FTS system, which has the added effect of making the absorptions more symmetric, hence its use here.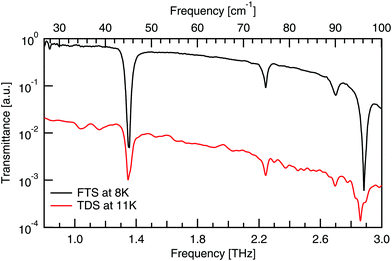 | ||
| Fig. 7 Comparison of FTS and TDS experimental DL-alanine spectrum at cryogenic temperatures. TDS spectrum vertically offset for clarity. | ||
The THz spectra of DL-alanine were taken using the FTS system over a wide temperature range, 8–295 K, and are shown in Fig. 8. A resolution of 0.5 cm−1 was used to record spectra while the sample slowly cooled to base temperature. The THz spectra have been analysed with zero-padding applied, to appear smoother, extending the initial interferograms from 4729 up to 65![[thin space (1/6-em)]](https://www.rsc.org/images/entities/char_2009.gif) 536 points. No adopisation has been used.
536 points. No adopisation has been used.
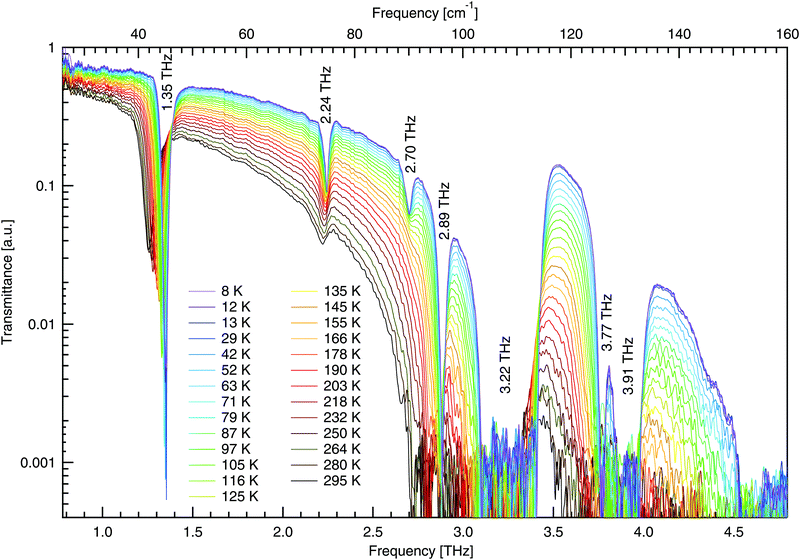 | ||
| Fig. 8 Temperature dependent terahertz transmittance spectra of DL-alanine using FTS. Numerical labels represent the frequency of each mode at 8 K. | ||
The high quality spectra are a feature of the cryogenic temperatures, where thermal vibrations are greatly reduced and the material becomes less absorbing and more transmissive. Spectra on a more transmissive sample will have more signal while background fluctuations remain constant, leading to a larger signal to noise ratio and thus higher quality spectra.
In Fig. 8, four distinct absorptions are identified below 3 THz. The fundamental mode at 1.35 THz is observed to be highly absorbing in comparison to the following three modes. Additionally, there are three modes observed between 3–4.8 THz; however, these are too absorbing for the sample thickness employed and consequently the absorption features hit the noise floor. These three features will not be analysed to the same extent as those below 3 THz due to poor signal to noise ratio, making fitting less reliable. For all absorptions observed, a Gaussian fit has been used to determine the peak position at each temperature. The peak positions are shown in Fig. 9. All features here are observed to redshift with increasing temperature as expected, apart from the mode at 2.70 THz, which blueshifts.
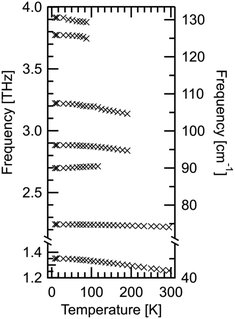 | ||
| Fig. 9 All absorption bands determined using FTS system for DL-alanine. Data is from Table 3. Positions were calculated by Gaussian fits to the spectral data. Statistical fitting uncertainties are too small to be shown on this scale. | ||
4.2 Temperature dependence of frequency
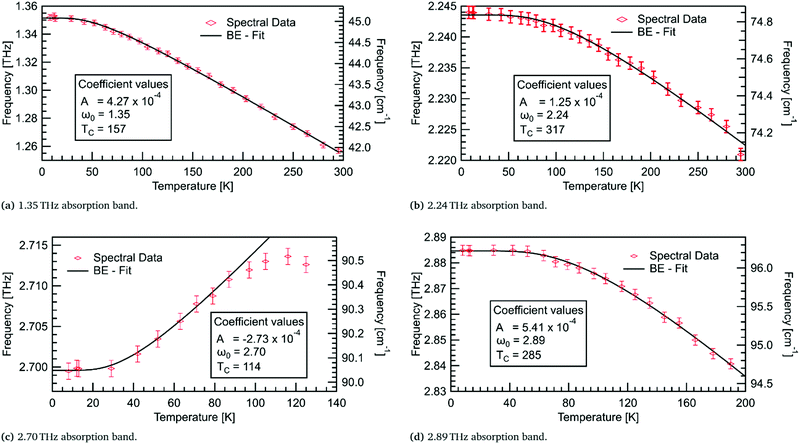
For the four lowest energy absorptions, the peak position against temperature has been fitted using Bose–Einstein statistics in Fig. 10. The first two modes, at 1.35 THz and 2.24 THz, redshift by 0.095 THz and 0.023 THz, respectively, over the full temperature range. The mode at 2.89 THz redshifts by 0.044 THz from 8–190 K. The Bose–Einstein fits are in very good agreement with the three redshifting absorption bands. This indicates that the model is sufficient here, and that these absorptions are entirely mediated by phonons.A prominent feature of the Bose–Einstein fitting is the constant frequency of the mode at low temperatures. The extent of this region, as seen in Fig. 10, is governed by the fitting parameter TC which is related to the ground state energy of the phonons in a particular mode. The modes at 2.24 and 2.89 THz have TC values of ≈300 K, indicating that these modes may share a common phonon bath. The observation of this constant frequency region in all four low energy modes supports the theory of these modes being mediated by phonons.
Contrary to what thermal expansion predicts, the absorption at 2.70 THz blueshifts, by 0.015 THz from 8–116 K, while only initially following a Bose–Einstein fit. The rate of shifting appears to decrease after ≈80 K, before changing to redshifting. Unfortunately, above 125 K this mode is no longer observable. As this behaviour is not well described by either the thermal expansion or phonon model its origin remains undetermined.
An assumption of the Bose–Einstein fitting is that the potential energy surface for the atoms is constant at all temperatures. This assumption is not entirely accurate, yet for the redshifting modes this effect must be negligible due to the accuracy of the fits. However, the absorption at 2.70 THz demonstrates a mode where the potential energy surface may change enough that the Bose–Einstein model no longer fits. This could be due to thermal expansion, where the separation of the molecules with increasing temperature starts to dominate the shifting of the mode. So, initially, we observe blueshifting; but, as the potential energy surface changes due to thermal expansion, it leads to redshifting at higher temperatures. This behaviour is similar to observed shifting in sucrose,34 where deuteration of the hydrogen atoms produced a stronger shifting indicating the importance of hydrogen bonds in this absorption. A precursor to the explosive TNT has also shown this unusual blueshifting behaviour below 100 K,5 with DFT modelling showing a complex interplay of inter- and intra-molecular hydrogen bonds leading to the observed blueshifting. Temperature dependent modelling for DL-alanine is thus desirable to verify the mechanism for the observed blueshifting.
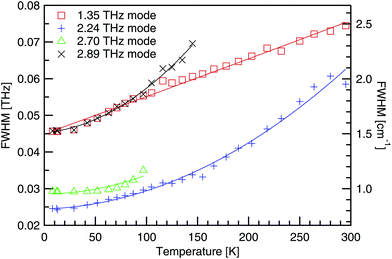
4.3 Temperature dependence of linewidth
The full width at half the maximum height (FWHM) has been determined using a Gaussian fit for the four absorptions below 3 THz, and is shown in Fig. 11. As the temperature decreases, absorptions become deeper and narrower. This is explained by the anharmonic potential where successive energy states are not uniformly separated, but the spacing decreases with increasing energy. At low temperatures the phonon population is restricted to a narrow band of allowed states, as the energy gap to excited states is large. However, as the temperature rises and phonons populate higher and higher energy states, the energy gap to neighbouring states keeps reducing, allowing the phonon population to spread out. As each energy state corresponds to a distinct frequency, absorptions are observed to broaden with increasing temperature.In Fig. 11, quadratic fits have been used, of the form Γ0 + Γ1T + Γ2T2, and the fit parameters are recorded in Table 4. As the quadratic fit shows good agreement, a T2 dependence on the linewidth is implied. Additionally as the number of phonons, n, is proportional to temperature, the broadening has an n2 dependence, as has been shown for α-glycine24 another molecular amino acid crystal.
| Temp. [K] | 1.35 [THz] | 2.24 [THz] | 2.70 [THz] | 2.89 [THz] | 3.22 [THz] | 3.77 [THz] | 3.91 [THz] |
|---|---|---|---|---|---|---|---|
| 8 | 1.352 | 2.244 | 2.699 | 2.885 | 3.222 | 3.774 | 3.914 |
| 12 | 1.352 | 2.244 | 2.700 | 2.885 | 3.223 | 3.774 | 3.915 |
| 13 | 1.351 | 2.244 | 2.700 | 2.885 | 3.222 | 3.774 | 3.914 |
| 29 | 1.351 | 2.244 | 2.700 | 2.885 | 3.219 | 3.773 | 3.914 |
| 42 | 1.349 | 2.244 | 2.702 | 2.885 | 3.218 | 3.772 | 3.898 |
| 52 | 1.348 | 2.243 | 2.703 | 2.885 | 3.216 | 3.769 | 3.894 |
| 63 | 1.345 | 2.243 | 2.706 | 2.883 | 3.213 | 3.767 | 3.886 |
| 71 | 1.342 | 2.243 | 2.708 | 2.880 | 3.208 | 3.765 | 3.884 |
| 79 | 1.340 | 2.243 | 2.709 | 2.879 | 3.201 | 3.758 | 3.882 |
| 87 | 1.338 | 2.242 | 2.711 | 2.878 | 3.198 | 3.746 | 3.878 |
| 97 | 1.335 | 2.242 | 2.712 | 2.876 | 3.197 | ||
| 105 | 1.331 | 2.241 | 2.713 | 2.874 | 3.196 | ||
| 116 | 1.328 | 2.241 | 2.714 | 2.871 | 3.189 | ||
| 125 | 1.326 | 2.240 | 2.713 | 2.868 | 3.176 | ||
| 135 | 1.321 | 2.239 | 2.864 | 3.169 | |||
| 145 | 1.317 | 2.239 | 2.859 | 3.163 | |||
| 155 | 1.314 | 2.237 | 2.857 | 3.159 | |||
| 166 | 1.310 | 2.236 | 2.850 | 3.151 | |||
| 178 | 1.304 | 2.236 | 2.845 | 3.145 | |||
| 190 | 1.300 | 2.235 | 2.841 | 3.137 | |||
| 203 | 1.294 | 2.233 | |||||
| 218 | 1.288 | 2.232 | |||||
| 232 | 1.281 | 2.230 | |||||
| 250 | 1.274 | 2.229 | |||||
| 264 | 1.269 | 2.227 | |||||
| 280 | 1.261 | 2.225 | |||||
| 295 | 1.257 | 2.221 |
| Absorptions [THz] | Γ 0 | Γ 1 | Γ 2 |
|---|---|---|---|
| 1.35 | 0.04493 | 1.011 × 10⁻⁴ | 6.585 × 10⁻⁹ |
| 2.24 | 0.02445 | 8.665 × 10⁻⁶ | 4.087 × 10⁻⁷ |
| 2.70 | 0.02857 | <1 × 10⁻⁹ | 5.147 × 10⁻⁷ |
| 2.89 | 0.04528 | 2.352× 10⁻⁵ | 9.737 × 10⁻⁷ |
4.4 DFT modelling
Numerical modelling has calculated four modes with non-zero intensity below 3.1 THz, which have been assigned to the four observed peaks in Table 5 (for details see the ESI†). A comparison of the experimental and theoretical peaks is seen in Fig. 12. There is very close agreement between the two lowest energy modes. A shift of ≈0.2 THz is seen in the next two low energy absorptions between the observed and calculated spectra. These higher energy modes are assigned with less confidence due to the shifting present. From the experimental results we see that the mode at 2.70 THz blueshifts and the mode at 2.89 THz redshifts. Hence temperature dependent modelling may help to further validate this assignment. Experimentally, if large single crystals of DL-alanine could be grown, polarisation measurements would add further constraints to the mode assignment.| Experimental peaks [THz] | Calculated peaks [THz] | Mode description |
|---|---|---|
| 1.35 | 1.33 | Gliding of molecular planes, in the b-axis direction |
| 2.24 | 2.19 | Gliding of molecular planes, in the c-axis direction |
| 2.70 | 2.95 | Rotation of individual molecules around the c-axis |
| 2.89 | 3.06 | Rocking of molecules, with twisting of the COO− groups |
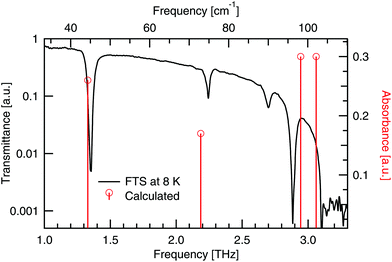 | ||
| Fig. 12 Calculated absorbances (vertical lines) of DL-alanine compared to the experimental transmittance spectrum (full curve) at cryogenic temperatures. | ||
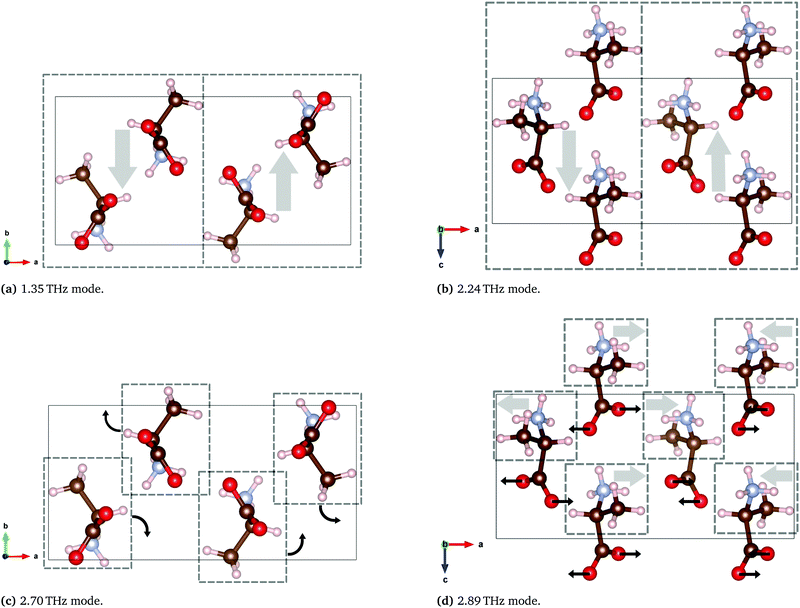 | ||
| Fig. 13 Calculated THz vibrations of DL-alanine using the B97-3c functional. Solid rectangles represent one unit cell and the dashed boxes represent a region with a generally collective motion indicated by the arrows. Animated media files of these four modes are available in the ESI.† | ||
The two lowest energy modes observed in DL-alanine are attributed to the gliding of molecular planes. For the 1.35 THz mode, molecular planes parallel to the bc plane oscillate in the b-axis direction. Similarly for the 2.24 THz mode, molecular planes parallel to the bc plane oscillate in the c-axis direction. Previous DFT modelling of DL-alanine by Fu et al.,14 using the RPBE functional, only investigated the fundamental mode. They found a similar gliding mechanism to be the origin. Here we have experimental results that observe the next three absorptions, which further validates our model, as these are also calculated.
5 Conclusions
A pure pellet of DL-alanine has been used to study its terahertz spectrum. Raman spectroscopy and powder X-ray diffraction have been used to confirm the sample structure and purity. Temperature dependent XRD results also confirmed that the crystal expands in all directions with increasing temperature.The terahertz spectrum of DL-alanine has been explored for the first time over a wide temperature range (8–295 K). Seven unique spectral absorptions have been identified at cryogenic temperatures. Only the first four absorptions are completely resolved with the others being too strong and hitting the noise floor. The temperature dependence of these first four modes has been studied further. Three of these modes redshift and are well described by Bose–Einstein statistics indicating their phonon origin. The other mode blueshifts, a phenomenon seen in molecular crystals with intricate hydrogen bonding. The precise mechanism remains to be determined and will be investigated further.
DFT calculations have been used to identify the vibrations that lead to the first four absorptions. Close correlation between the predicted theoretical modes and the experimental spectra validates these calculations. The modelling shows that large scale molecular vibrations are indeed the cause for the observed low frequency terahertz modes. These are mediated by the intermolecular bonds, some of which are shared with the enantiopure forms of alanine. In the future, a comparison of the intermolecular modes and the molecular vibrations they cause in these various forms of alanine will be investigated, both experimentally and theoretically.
Credit authorship contribution statement
T. J. Sanders: conceptualisation, methodology, formal analysis, data curation, investigation, writing – original draft, writing – review & editing, visualisation. J. L. Allen: conceptualisation, methodology, formal analysis, data curation, investigation, writing – review & editing, visualisation. J. Horvat: conceptualisation, investigation, resources, software, writing – review & editing, visualisation, supervision, project administration. R. A. Lewis: conceptualisation, investigation, resources, writing – review & editing, visualisation, supervision, project administration.Conflicts of interest
There are no conflicts to declare.Acknowledgements
We thank J. Lang of the University of Wollongong for providing the Raman spectroscopic results. We also thank Y. Wang from the University of New South Wales for the XRD data. This work was supported by the Australian Research Council through the Linkage Infrastructure, Equipment and Facilities scheme, grant number LE170100020. Numerical modelling was undertaken with the assistance of resources and services from the National Computational Infrastructure (NCI), which is supported by the Australian Government.References
- A. Matei, N. Dricho, B. Gompf and M. Dressel, Chem. Phys., 2005, 316, 61–71 CrossRef CAS.
- M. R. C. Williams, A. B. True, A. F. Izmaylov, T. A. French, K. Schroeck and C. A. Schmuttenmaer, Phys. Chem. Chem. Phys., 2011, 13, 11719–11730 RSC.
- P. U. Jepsen and S. J. Clark, Chem. Phys. Lett., 2007, 442, 275–280 CrossRef CAS.
- Y. Liu, T. Zhou and J.-C. Cao, Infrared Phys. Technol., 2019, 96, 17–21 CrossRef CAS.
- L. M. Lepodise, J. Horvat and R. A. Lewis, J. Phys. Chem. A, 2015, 119, 263–270 CrossRef CAS PubMed.
- A. D. Squires, A. J. Zaczek, R. A. Lewis and T. M. Korter, Phys. Chem. Chem. Phys., 2020, 22, 19672–19679 RSC.
- Z.-P. Zheng and W.-H. Fan, J. Biol. Phys., 2012, 38, 405–413 CrossRef CAS PubMed.
- S. C. Shen, L. Santo and L. Genzel, Can. J. Spectrosc., 1981, 26, 126–133 CAS.
- J.-P. Yu, C. Li, W.-T. Yi, B.-B. Jin, Y.-F. Liu and L. Jiang, Spectrosc. Spectral Anal., 2018, 38, 386–393 CAS.
- Z. Mita, H. Watanabe and S.-I. Kimura, Infrared Phys. Technol., 2019, 96, 7–9 CrossRef CAS.
- N. Laman, S. S. Harsha, D. Grischkowsky and J. S. Melinger, Biophys. J., 2008, 94, 1010–1020 CrossRef CAS PubMed.
- T. Sakamoto, T. Tanabe, T. Sasaki, Y. Oyama, J.-I. Nishizawa, T. Kawanishi and Y. Hiyama, Malays. J. Biochem. Mol. Biol., 2009, 11, 88–93 Search PubMed.
- M. Yamaguchi, F. Miyamaru, K. Yamamoto, M. Tani and M. Hangyo, Appl. Phys. Lett., 2005, 86, 053903 CrossRef.
- R. Fu, Z. Li, B. Jin, C. Zhang, H. Dai, Y. Xue and J. Chen, Spectrosc. Spectral Anal., 2010, 30, 2023–2026 CAS.
- M. S. Nandhini, R. V. Krishnakumar and S. Natarajan, Acta Crystallogr., 2001, C57, 614–615 Search PubMed.
- R. Dovesi, A. Erba, R. Orlando, C. M. Zicovich-Wilson, B. Civalleri, L. Maschio, M. Rérat, S. Casassa, J. Baima, S. Salustro and B. Kirtman, Wiley Interdiscip. Rev.: Comput. Mol. Sci., 2018, 8, e1360 Search PubMed.
- J. G. Brandenburg, C. Bannwarth, A. Hansen and S. Grimme, J. Chem. Phys., 2018, 148, 064104 CrossRef PubMed.
- S. Grimme, J. Antony, S. Ehrlich and H. Krieg, J. Chem. Phys., 2010, 132, 154104 CrossRef PubMed.
- F. Weigend and R. Ahlrichs, Phys. Chem. Chem. Phys., 2005, 7, 3297–3305 RSC.
- S. Grimme, J. G. Brandenburg, C. Bannwarth and A. Hansen, J. Chem. Phys., 2015, 143, 054107 CrossRef PubMed.
- F. Pascale, C. M. Zicovich-Wilson, F. López Gejo, B. Civalleri, R. Orlando and R. Dovesi, J. Comput. Chem., 2004, 25, 888–897 CrossRef CAS PubMed.
- C. Zicovich-Wilson, F. Pascale, C. Roetti, V. Saunders, R. Orlando and R. Dovesi, J. Comput. Chem., 2004, 25, 1873–1881 CrossRef CAS PubMed.
- Terahertz Spectroscopy, ed. S. L. Dexheimer, CRC Press, Boca Raton, FL, 2008 Search PubMed.
- J. L. Allen, T. J. Sanders, J. Horvat and R. A. Lewis, Spectrochim. Acta, Part A, 2021, 244, 118635 CrossRef CAS PubMed.
- T. J. Sanders, J. L. Allen, M. Large, J. Horvat and R. A. Lewis, 44th International Conference on Infrared, Millimeter, and Terahertz Waves (IRMMW-THz), 2019, pp. 1–2.
- X. Li, K. Xu, H. Li, S. Yao, Y. Li and B. Liang, RSC Adv., 2016, 6, 8395–8405 RSC.
- S. A. M. B. Dhas and S. Natarajan, Mater. Lett., 2008, 62, 2633–2636 CrossRef CAS.
- E. A. Belo, J. A. Lima Jr., P. T. C. Freire, F. E. A. Melo, J. M. Filho, H. N. Bordallo and A. Polian, Vib. Spectrosc., 2010, 54, 107–111 CrossRef CAS.
- Y. Gong and W.-Q. Wen, Spectrosc. Spectral Anal., 2005, 26, 90–93 Search PubMed.
- K. Machida, A. Kagayama and Y. Saito, J. Raman Spectrosc., 1978, 7, 188–193 CrossRef CAS.
- H. Aviv, I. Nemtsov, Y. Mastai and Y. R. Tischler, J. Phys. Chem. A, 2017, 121, 7882–7888 CrossRef CAS PubMed.
- K. Momma and F. Izumi, J. Appl. Crystallogr., 2011, 44, 1272–1276 CrossRef CAS.
- T. J. Sanders, J. L. Allen, M. Large, J. Horvat and R. A. Lewis, 45th International Conference on Infrared, Millimeter, and Terahertz Waves (IRMMW-THz), 2020, pp. 1–2.
- M. Walther, B. M. Fischer and P. Uhd Jepsen, Chem. Phys., 2003, 288, 261–268 CrossRef CAS.
Footnote |
| † Electronic supplementary information (ESI) available: Overview document, numerical calculation output file and videos of the four lowest modes. See DOI: 10.1039/d0cp05432a |
| This journal is © the Owner Societies 2021 |

