
 Open Access Article
 This Open Access Article is licensed under a Creative Commons Attribution-Non Commercial 3.0 Unported Licence
Atom-surface van der Waals potentials of topological insulators and semimetals from scattering measurements†
Anton
Tamtögl
 *a,
Adrian
Ruckhofer
a,
Davide
Campi
b,
William
Allison
c and
Wolfgang E.
Ernst
a
*a,
Adrian
Ruckhofer
a,
Davide
Campi
b,
William
Allison
c and
Wolfgang E.
Ernst
a
aInstitute of Experimental Physics, Graz University of Technology, 8010 Graz, Austria. E-mail: tamtoegl@gmail.com
bTheory and Simulation of Materials (THEOS) and National Centre for Computational Design and Discovery of Novel Materials (MARVEL), École Polytechnique Fédérale de Lausanne, Lausanne CH-1015, Switzerland
cCavendish Laboratory, J. J. Thompson Avenue, Cambridge CB3 0HE, UK
First published on 22nd December 2020
Abstract
The phenomenology of resonant scattering has been known since the earliest experiments upon scattering of atomic beams from surfaces and is a means of obtaining experimental information about the fundamentals of weak adsorption systems in the van der Waals regime. We provide an overview of the experimental approach based on new experimental data for the He–Sb2Te3(111) system, followed by a comparative overview and perspective of recent results for topological semimetal and insulator surfaces. Moreover, we shortly discuss the perspectives of calculating helium–surface interaction potentials from ab initio calculations. Our perspective demonstrates that atom-surface scattering provides direct experimental information about the atom-surface interaction in the weak physisorption regime and can also be used to determine the lifetime and mean free path of the trapped atom. We further discuss the effects of elastic and inelastic scattering on the linewidth and lifetime of the trapped He atom with an outlook on future developments and applications.
 Anton Tamtögl | Anton (Toni) Tamtögl earned his PhD in Physics at Graz University of Technology in 2012. He was thereafter awarded with an Erwin-Schrödinger research fellowship to continue his work at the Cavendish Laboratory in Cambridge, before he returned to Graz where he is currently senior researcher of the exotic surfaces group. His current research is centred on Dirac and 2D material surfaces, in particular their interaction with gases and molecules and the role of energy dissipation on these surfaces in connection with molecular diffusion. |
 Adrian Ruckhofer | Adrian Ruckhofer received his Master's degree from the University of Technology, Graz in 2017. He is currently in the last year of his PhD where he has been investigating various aspects of helium scattering from semimetal and topological insulator surfaces. |
 Davide Campi | Davide Campi received his PhD from the University of Milano-Bicocca, Thereafter, he joined the THEOS (theory and simulation of materials) group at the EPFL Lausanne as a postdoctoral researcher and returned recently as an assistant professor to Milano-Bicocca. His research concentrates on theoretical efforts and approaches for gas-surface interactions and surface dynamical processes. |
 William Allison | William (Bill) Allison has over 40 years of experience in atomic and molecular beam research. He served as a reader in experimental physics at the University of Cambridge until 2018 where his research interests have centred on surface physics and, particularly, gas-surface interactions. |
 Wolfgang E. Ernst | Wolfgang E. Ernst is an emeritus professor of physics at Graz University of Technology. He finished his PhD in physics at TU Hannover in 1977 and obtained his habilitation at Freie Universität Berlin in 1983. From 1990 to 2002 he held the position of a full professor at Penn State University after which he moved to Graz University of Technology, Austria, where he served as professor of physics and director of the Institute of Experimental Physics until 2019. His continuing research interests include fundamental aspects of the electronic and nuclear dynamics in molecules and at surfaces. |
1 Introduction
Since the earliest scattering experiments of atomic beams from surfaces, the phenomenology of resonant scattering and its connection to molecular adsorption at a surface has been known.1,2 Understanding the scattering of atoms and molecules from surfaces forms a central point of many aspects in physical chemistry, including chemical reactions at surfaces and providing the link for an atomistic understanding of heterogeneous catalysis.3–5 Scattering experiments provide access to the atom-surface interaction potential which is the necessary prerequisite for any quantitative description and theoretical treatment of molecular adsorption6 or surface reaction processes. Scattering approaches to chemisorption7,8 and the coordinates relevant to the reaction potential3–5 rely on such treatment.While atomic force microscopy has been used to obtain information about the forces between a single molecule and the surface,9,10 direct experimental information for the weak physisorption regime of the atom-surface interaction potential (in the region of several meV) is only available through atom-surface scattering.11–13 Diffraction of atomic and molecular beams is based on their wave nature with momentum and wavelength being inversely proportional via the de Broglie relation. He atoms with a wavelength of 1.4 Å exhibit an incident energy of only 10 meV.14 As slow neutral particles, they are non-destructive with a classical turning point being at about 2–3 Å above the surface. Their low energy allows to observe effects of the attractive part of the atom-surface potential onto the atomic beam in a similar energy region.
Here we present an overview of the experimental approach in obtaining atom-surface interaction potentials from He atom scattering (HAS) experiments based on the study of selective adsorption resonances (SARs), in which the helium atom briefly gets trapped on the surface. SARs in HAS provide very high accuracy information for the determination of the atom-surface interaction potential12,15 and we present new experimental data for the He–Sb2Te3(111) system and compare it with previous results for binary topological insulators and semimetals. We illustrate the principle in the context of classical HAS and Fourier-transform (FT)-HAS studies. The presented systems have certain aspects in common, with the bulk being non-metallic, while the surfaces exhibit metallic surface states and the corrugation in the repulsive part of the potential being of comparable magnitude (≈0.2–0.6 Å).16,17 Moreover, while significant theoretical effort has been devoted to understanding the lifetime of these effects18,19 experimental information is quite limited and we present temperature-dependent experimental data.
1.1 The atom-surface interaction potential
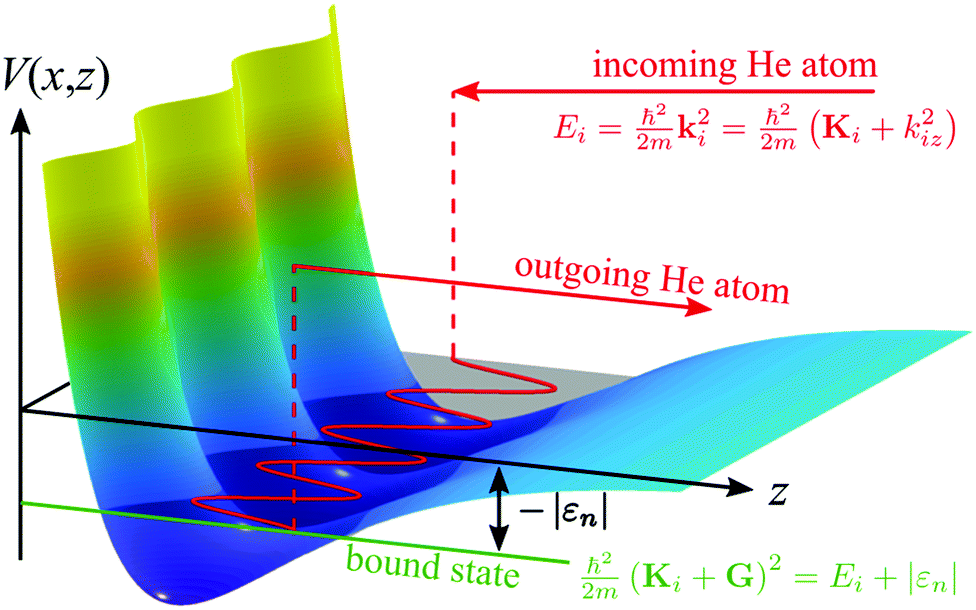
Fig. 1 shows a schematic diagram of the atom-surface scattering processes with elastic scattering and trapping. An atom of mass m arrives at the surface with an incident wavevector ki and kinetic energy and is scattered by the electron cloud at the surface, where the atom interacts with all atoms of the semi-infinite crystal via a total potential V(r). The momentary position of the atom r = (R,z) is expressed in terms of coordinates in the surface plane (capital letters) and normal to it along the z-axis (likewise for the wavevector k = (K,kz), as illustrated in Fig. 1).
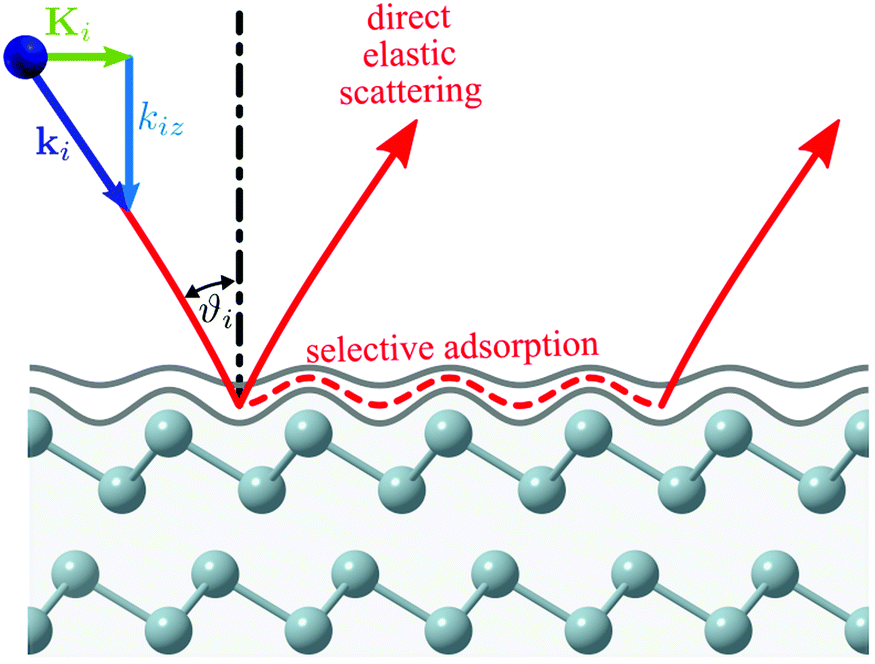 | ||
| Fig. 1 Illustration of the helium-surface scattering process. The incoming He atom can scatter (or diffract) elastically, scatter inelastically (not shown) or enter selective adsorption where it is transiently trapped in one of the energy levels of the potential well. | ||
A precise model of He-surface scattering is rather complicated, due to the extended nature of the interaction with the surface.13,20 Scattering calculations require a realistic He-surface potential and a suitable calculation scheme, for which both empirical and theoretical approaches have been used to establish interaction potentials.13,18 The LiF(001) surface was the first surface on which He diffraction was observed and to date most of the best existing theoretical potentials for He–LiF(001), as well as for other systems, are based on summed pair potentials.13
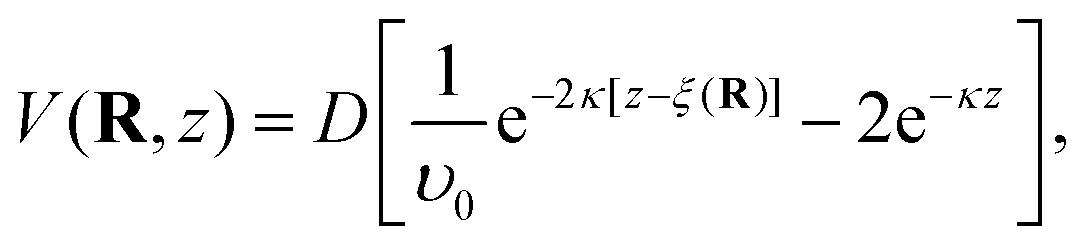
Conventionally the potential V(R,z) is divided into a corrugated short-range repulsive wall and a less corrugated attractive well (typically 5–50 meV) for rare gas atoms. The former arises from the Pauli repulsion of the electrons of the probe atom with the electrons of the surface; the latter is due to dispersion forces resulting from the electrostatic polarisation of the atom induced by the surface charge distribution.
The equipotential surface at which the potential V(R,z) equals the He atom incident energy for the vertical component of motion  is given by
| V(R,z) = Eiz, | (1) |
Classical reflection corresponds to the incident He atom reaching the turning point i.e. the repulsive part of the interaction potential while reflection coming from the long-range attractive part is referred to as quantum threshold reflection.22,23 The effect of the attractive part of the potential onto the incident He atom can be seen as an analogy to refraction for classical scattering from an isolated target. Since only the z-component is important, refraction can also be made visible in the case of fast Ne atoms, if angles close to grazing incidence are used.24
Fig. 2 shows a calculated He-surface interaction potential for Bi(111) (see Computational details in the ESI†). Fig. 2a shows a surface plot, with the potential energy as a function of lateral distance x and distance z with respect to the surface, where the potential rises steeply already at several Ångstroms away from the top-most layer. In Fig. 2b a contour plot with equipotential lines is shown, illustrating that the turning point depends (e.g. for an energy of 10 meV as shown by the red line) on the lateral position x. Since the potential follows the two-dimensional periodicity of the surface layer, it is possible to express the static potential in terms of a Fourier series representation,21 which in turn is useful for scattering calculations.
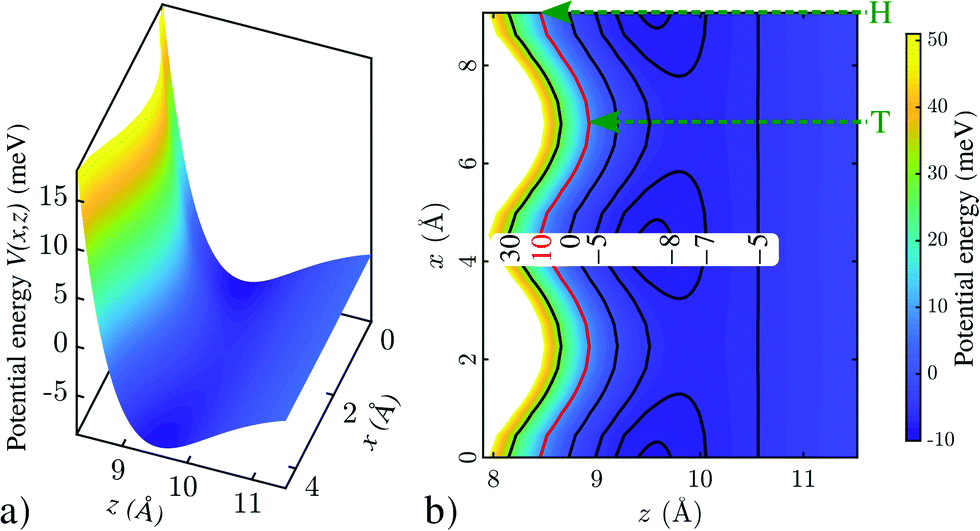 | ||
| Fig. 2 Calculated He-surface interaction potential above a Bi(111) surface. (a) shows a surface plot of V(x,z) while (b) shows a contour plot with several equipotential lines. The potential follows the periodicity of the surface along x and has the general z-dependence shown. As illustrated in (b), the classical turning point (e.g. for an energy of 10 meV as shown by the red line) depends on the lateral position x, occurring at different distances z from the surface for top (T) and hollow (H) sites, respectively. | ||
For scattering calculations, a range of accurate and approximate techniques have been established14,18,25–28 and within the exact quantum mechanical methods the close-coupling (CC) method is nowadays mainly used for scattering calculations.17,29,30 For the calculation of diffraction intensities alone, sometimes simple approximations for the interaction potential can be used and the simplest one is the hard corrugated surface. In the case of graphene (graphite) where the potential is steep and deep the graphene layer on the substrate may be considered to act like a hard wall. The latter is also confirmed in inelastic HAS measurements for metal-supported graphene, where only phonons from the substrate are seen via the electron spill out through the electron–phonon coupling.31 Roughly speaking, if the distance of the classical turning point in the potential with respect to z = 0 is comparable to the He diameter then approximate results may be obtained with the hard corrugated wall. This is confirmed by the calculation of diffraction intensities for graphene on SiC(0001) which are fairly well reproduced using a hard-corrugated-wall model.32
On the other hand, in the case of metallic surfaces (see Fig. 2) the latter should be avoided because the potential is typically both shallow and has a long range component and scattering calculations require a more realistic He-surface interaction potential. Before we come to experimental approaches based on atom-surface scattering experiments in Section 2, we will discuss ab initio approaches for such a potential in Section 1.2 and the characteristics of a few potential shapes in Section 1.3.
1.2 Helium-surface interaction from ab initio calculations
Besides the use of semi-empirical potentials, which are fitted to experimental data, it is possible to generate numerical atom-surface interaction potentials from first-principle calculations. However, a precise description of the He-surface interaction still represents a considerable challenge due to the difficulties in accurately and simultaneously describing the short range repulsive part and the long range van der Waals (vdW) interactions. Various methods, with different degrees of complexity have been used over the years.Very sophisticated protocols combining Moller–Plesset perturbation theory (MP2) with high order corrections computed from coupled-cluster CCSDT(Q) have been proven to provide a good agreement with He scattering experiments for the MgO(100) surface.33,34 Other works used time-dependent density functional response theory to compute the long range dispersion contributions35 obtaining a good description of the interaction of He and Ar on Au(111).36 Accurate interaction energies with noble gases have also been obtained using a self-consistent exact-exchange random phase approximation (EXX/RPA) formalism.37,38 All these methods however, are computationally expensive and often require a careful material-dependant tailoring.
Density functional theory (DFT), on the other hand, is computationally cheap and readily applicable. As such, various flavours of DFT have been used to calculate the He adsorption energies or the HAS diffraction spectra of a broad variety of systems with mixed results.20,39–45 It is known that standard approximations for the exchange–correlation functional in DFT, like the local-density approximation (LDA) and the generalised-gradient approximation (GGA), neglect long-range dispersion effects since they include only local contributions to the electron correlation.
Different methods have been developed to overcome this problem from the addition of semi-empirical or ab initio based long-range corrective terms46–50 to truly non-local functionals.51–53 Such an approach has also been used for the numerical Bi(111) potential shown in Fig. 2, with the full computational details being given in the ESI.† In addition, new theoretical approaches include the implementation of neural networks for molecule-surface scattering54 as well as vdW corrected semilocal density functionals to determine molecule–surface interactions on transition-metal surfaces.45
It is generally recognised that vdW corrected functionals consistently improve the adsorption energies of molecules and noble gases both on insulating and metallic surfaces55,56 and can lead to a good agreement with scattering experiments.57 On the other hand, a recent comparison between experimentally measured and theoretically predicted diffraction probabilities, shows how these functionals can give rise to large overestimations of the corrugation, i.e. despite providing good results for absorption energies the long-distance corrugation of the potential energy surface further away from the surface is overestimated.58 These results highlight the importance of atom-surface scattering experiments as a benchmark for any ab initio treatment of the long range interaction and their contribution in the improvement of those.
1.3 The characteristics of different potentials
Upon scattering from a solid with a closed-shell system such as ionic crystals the static potential V(R,z) can be reduced to a sum of two-body interatomic potentials. However, for semiconducting and metal surfaces the interaction of the He atom with the surface is to a large extent mediated by the conduction electrons and acquires a many-body character.21 For example, the 9-3 potential results from pair-wise summation of the Lennard-Jones potential and describes the correct long-range behaviour but does not reproduce the correct repulsive behaviour and it has been shown that it cannot reproduce the measured SARs in the case of semimetal surfaces.16Instead a combination of two exponential forms for both the repulsive and attractive part, known as the Morse potential, is frequently used due to its algebraic simplicity. The three-dimensional corrugated Morse potential (CMP) as a function of the lateral position R on the surface and the distance z is given by59
 | (2) |
Quantum mechanical arguments suggest an exponential form for the short range Pauli repulsion which is correctly described by the Morse potential. On the other hand, (2) does not have the z−3 long range dependence which is expected by theory.21 Here, the hybrid Morse potential can be used as an improvement of the Morse potential since it exhibits the expected asymptotic long rang behaviour.16
An appropriate potential which considers exponential repulsion and the attractive part according to a power law is the Tang-Toennies potential,60 however, it follows from a summation over pair-potentials which can only be considered accurate for ionic crystals as described above. While the short range repulsion exerted by all surface atoms on the He atom can be considered to be only slightly larger than the two-body repulsion, the joint long range attraction of the surface largely exceeds the summation of pair potentials.21
For the study of SARs the above mentioned potentials are often simplified to the first order Fourier coefficient leading to the lateral surface averaged potential. For surfaces which resemble a hard corrugated wall the latter provides approximate results, however, in terms of (2) it can be seen that such an approximation is only valid for κz ≪ 1, and in order to describe the complete experimental band structure of the He atom in the corrugated surface potential (Section 2.3) higher order Fourier components need to be included which are easily obtained for the CMP.
Since the three-dimensional CMP does not treat correctly the long range attraction, it is not so appropriate for quantum mechanical calculations of inelastic HAS resonances and focusing effects.126 Instead optical potentials have been used previously to study the effect of inelasticity on resonance scattering, e.g. on graphite(0001)61 and for the Si(111)–(1 × 1)H surface.62 However, in SAR studies of the latter system it was noted that a significant corrugation exists in the region of the attractive well which cannot be reproduced by such a potential. The effect is subtle as it does not manifest itself strongly in the diffraction intensities and instead causes a broadening of the resonance features.62
Despite some limitations in using the pure exponential form for the atom-surface potential (2), many useful results can be obtained for conducting surfaces21 and earlier studies have shown that this potential shape reproduces the measured bound states of semimetal and topological insulator surfaces.16,17,29,30 In particular, the CMP greatly simplifies the treatment of several steps within the CC algorithm, allowing for an analytical solution in those cases, which leads to reduced computational costs. The obtained coupling terms are then only valid for the three-dimensional CMP. Hence in order to avoid inconsistencies in the CC calculations and to provide a simple comparison with the atom-surface interaction obtained for similar systems we will restrict the following discussion to the CMP.
Considering also the challenges theorists are facing in describing the vdW interaction correctly, CC calculations in combination with the three-dimensional CMP are clearly a sensitive tool for determining the atom-surface interaction potential, at least in the case of conducting surfaces. Although some functionals have been proven to yield good results for diffraction from alkali metal surfaces,63,64 Ne diffraction57 and physisorption energies in He/metal systems,58 the performance for HAS from conducting surfaces is still under debate.65 As noted by del Cueto et al.,65 up to now none of the available vdW functionals have been proven to yield good He diffraction probabilities, most probably due to the in Section 1.2 described overestimation of the long-distance corrugation which is probed by the He atom.65
1.4 Topological semimetals and insulators
One of the most fascinating aspects when studying surfaces is that their physical and chemical properties can be radically different from those of the corresponding bulk material. The semimetals Bi and Sb are striking examples for these differences with the surfaces being much better metals than the bulk due to the existence of electronic surface states.66–68 There are even more peculiar surface dominated effects when it comes to topological insulators: the material class of topological insulators (TIs) has recently attracted high interest,69–74 due to their unique electronic structure which exhibits protected conducting surface as well as insulating bulk states.75,76 Most previous studies investigated the prominent binary TIs Bi2Te3 and Bi2Se3,70,77 while Sb2Te3 is discussed in fewer works.78Most classic semimetallic elements belong to group 15 of the periodic table, including Sb and Bi. The side view of the typical structures of these semimetals is shown in Fig. 3a, while Fig. 3b shows the structure of the binary TIs. The semimetals Bi and Sb show a typical bilayer structure, with intralayer bonding being mostly covalent, whereas the layers are held together by weaker interactions predominantly of vdW character. The binary TIs such as Sb2Te3 are composed of layered hexagonal structures (Fig. 3b) where quintuple layers (QLs) are weakly bound to each other through weak vdW forces which allow for an easy cleaving of the samples. Consequently, crystal samples of binary TIs are cleaved in situ using a load-lock system79 directly before putting those into the scattering chamber, while the semimetals Bi and Sb are usually prepared by several Ar+-sputtering and annealing cycles. In the case of binary TIs, recent research has also shown the importance of an accurate theoretical description of their layered structure, where the inclusion of vdW corrections is essential for surface dynamics as well as diffusion.80,81
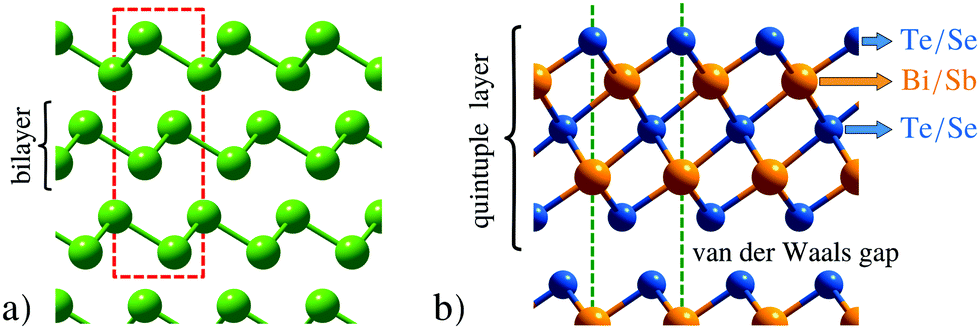 | ||
| Fig. 3 Side view of the structures. (a) The semimetal surfaces Bi(111) and Sb(111) both exhibit a typical bilayer structure with the hexagonal unit cell as red dashed line. (b) The binary topological insulators are composed of quintuple layers with the terminating layer being either Te or Se. The hexagonal unit cell is illustrated by the green dashed lines (which continues to the top and the bottom). | ||
Hence experimental access to the vdW interaction on these surfaces is not only interesting from a fundamental point of view. For example, vertical stacking of different layered materials held together by vdW interactions is emerging as a new scientific approach to achieve desired properties by design. Recent studies have shown that the vdW interactions affect electronic and phonon properties of such structures with consequences for transport and optical applications.30,82 In addition, an accurate description of the atom-surface interaction helps to understand the adsorption of atoms and molecules in the physisorption regime83–85 including modifications of the surface electronic structure via adsorption86–89 and effects relevant for heterogeneous catalysis or sensing applications.90,91
2 Experimental approaches based on gas-surface scattering
Experimental studies of the atom-surface interaction potential based on the mechanism of SARs, provide very high accuracy information for the determination of the atom-surface interaction potential.12,15 Earlier studies of SARs mainly investigated salts with the NaCl structure,11,12,14,15,92–94 semiconductors62 and more recently layered materials such as TIs.17,30,95 In order to determine an accurate three-dimensional atom-surface interaction potential the analysis of SARs has to be combined with quantum mechanical scattering calculations29,31,34 as outlined below.The process of an SAR involves trapping of an impinging He atom on the surface until it scatters with a G-vector or a phonon to leave it again.12,15 A simple semi-classical view of the process is illustrated in Fig. 1: scattering at the resonance condition corresponds to a double scattering event where one part of the incident wave is scattered directly into an open channel, while a fraction undergoes diffractive scattering into an evanescent, resonant state that propagates parallel to the surface. After a short time, a second process scatters the wave into an open channel with subsequent interference between the two scattered components leading to modulations in the outgoing intensity, which can be observed in an experiment.
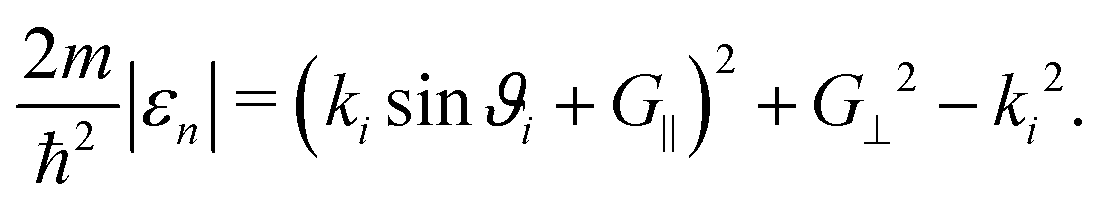
An SAR process occurs when the outgoing wavevector component perpendicular to the surface kfz2 becomes negative which is a kinematically disallowed state. This appears when the difference between the incident energy and the kinetic energy of the atom moving parallel to the surface matches the binding energy εn of an adsorbed atom:11
 | (3) |
 | ||
| Fig. 4 Schematic illustration of a selective adsorption resonance process in the free-atom approximation, with the kinematic conditions for entering a bound state with energy εn. | ||
This semi-classical picture provides insights into the origin of the experimental intensity variations, however, the process can only be fully understood from a quantum standpoint.18 The two key properties in resonant scattering processes are the kinematic condition giving rise to a particular resonance, and the lineshape of the resonance. The former provides information on the energy of the resonant state and thus in the weak corrugation limit, the z-dependence of the laterally averaged potential V0(z) as described in Section 2.1. The lineshape, on the other hand, provides information about the corrugation (see Sections 2.2–2.3) which taken together offers one of the most precise experiments considering physisorption potentials.6
In the free atom approximation, once the He atom has entered a bound state, it can move freely parallel to the surface as illustrated in Fig. 4. It corresponds to a simplification of (3), neglecting the corrugation of the potential: εn is then the nth bound state of the laterally averaged potential, V0(z) (εn in (3) becomes independent of Ki and G). Such an approximation is useful in order to obtain a first “idea” of the potential parameters from the experimental data (see Section 2.1) which can then subsequently be refined using a three-dimensional model potential that is matched to the experimental results.
As further noted by Jardine et al.,13 for weakly corrugated surfaces, the He wavefunctions in the resonant state can be approximated as
| Ψ(K+G),n(R,z) ≈ ϕn(z)exp[ⅈ(K + G)·R], | (4) |
The time spent in the resonant state depends on the lateral corrugation of the potential since the “strength” of diffractive scattering is determined by the corrugation, thus making resonant scattering a useful experimental probe of the three-dimensional atom-surface potential. Resonances involving the ground state are most sensitive to the potential near the minimum, since that position corresponds to the largest weight of ϕ0(z). On the other hand, higher lying states extend further into the vacuum region and are a useful probe of the exact potential shape at larger distances z.13
For accurate studies of corrugated systems, large amounts of high resolution, high quality data are required. According to the kinematic condition (3), one can either vary Ei or the parallel momentum transfer Ki. In a conventional HAS experiment,14 there are three variables: the incident energy, Ei, together with the polar and azimuthal scattering angles, ϑi and φi. Here, the scattering angles correspond to changes of Ki as determined by the scattering geometry.
Often the energy and azimuthal angle are fixed while the polar angle ϑi is varied followed by a simplified analysis based on approximations, such as (4). However, in particular potentials with a large corrugation, derived on the assumption of the free-atom approximation, are inaccurate and the bound-state energies are known to be systematically misplaced. The full picture is analogous to a two-dimensional (2D) band structure of nearly-free particles due to the periodic corrugation of the potential, i.e., in the laterally averaged potential, each bound state gives rise to a 2D sub-band of the overall band structure (see Fig. 5b).11,13,96,97 Hence for an accurate determination of the three-dimensional atom-surface interaction potential, several of the above described experimental variables should be varied, thus providing a larger data set while at the same time solving the elastic scattering problem exactly by using computational methods such as the CC algorithm.
 | ||
| Fig. 5 (a) Illustration of the resonance condition in the free atom approximation, when using an incident beam with a broad energy distribution. (b) Specular intensity for scattering of He from Bi(111) at 150 K, obtained from a FT-HAS measurement. The scattered intensity is plotted as a colour map versus incident energy, Ei, and azimuthal angle, φi, showing a large number of resonant features which disperse across the plot. The superimposed lines show the kinematic conditions in the free atom approximation. | ||
By using Fourier-transform (FT) HAS, a wide range of incident energies can be studied at once, producing large datasets over a wide range of kinematic conditions (see Fig. 5a). In FT-HAS, the spread of energies in the incident beam is intentionally broadened as far as possible (illustrated by the red gradient in Fig. 5a), and the spin-echo principle is then used to analyse the energy distribution of the scattered beam, thus providing energy dependent reflectivity information13,30 as plotted in Fig. 5b for Bi(111): a large number of resonant features can be seen as bright and dark stripes, dispersing across the plot. The advantage of FT-HAS with respect to conventional HAS is, that the energy resolution is unaffected by the spread in the incident beam, and the data taking time depends on the required spectral resolution, rather than the spectral range.13 The superimposed red lines in Fig. 5b according to the kinematic conditions in the free-atom approximation, illustrate that there are significant offsets and shifts with respect to the maxima/minima in the experimental data which can only be reproduced when considering the full three-dimensional potential.
2.1 The laterally averaged potential from diffraction scans
As described above, in order to obtain the laterally averaged potential V0(z), which in turn can be used as a first starting point for the determination of the three-dimensional potential, often only one experimental variable is varied. Such an experiment is e.g. an elastic scan where the sample is rotated around the polar (incident) angle ϑi. The parallel momentum transfer to the surface ΔK = |ΔK|, is then given byΔK = |Kf − Ki| = |ki|[sin(ϑSD − ϑi) − sin![[thin space (1/6-em)]](https://www.rsc.org/images/entities/char_2009.gif) ϑi], ϑi], | (5) |
Following the free-atom approximation we can directly obtain the bound state energies of the laterally averaged potential which assumes a surface without corrugation, V0(z) = D[e−2κz − 2e−κz]. The kinematic condition (3) at certain values of the parallel momentum transfer ΔK needs to be fulfilled, but in the free-atom approximation, the binding energies εn(Ki,G) are considered constant and therefore independent of Ki and G. (3) can then be expressed in terms of the incident angle ϑi and the incident wave vector ki:
 | (6) |
Such an approximation is useful in order to obtain a first idea about the potential parameters. However, the assignment of SARs to a certain bound state energy εn is not always unambiguous due to the manifold of various G-vectors and the known systematic displacement in the free-atom approximation. A more robust approach considers the different curvatures associated with a certain G-vector, either using the FT-HAS technique30 or considering consecutive elastic angular scans in terms of their incident energy.17
By combining many elastic scans along the same azimuthal direction with various incident energies Ei, the scattered intensity as a function of two variables (ϑi,Ei) can be obtained. Hence a similar data set as in the FT-HAS experiment is obtained, although it will be resolution limited to some extent by the apparatus. Such a two-dimensional intensity plot is shown in Fig. 6 for the  azimuth of Sb2Te3(111). The x-axis has been converted from incident angle to parallel momentum transfer according to (5) and the y-axis corresponds to the incident energy Ei while the colour map represents the scattered intensity. The high intensity of the specular and first order diffraction peaks has been omitted for better visibility of the SAR features in the surface plot.
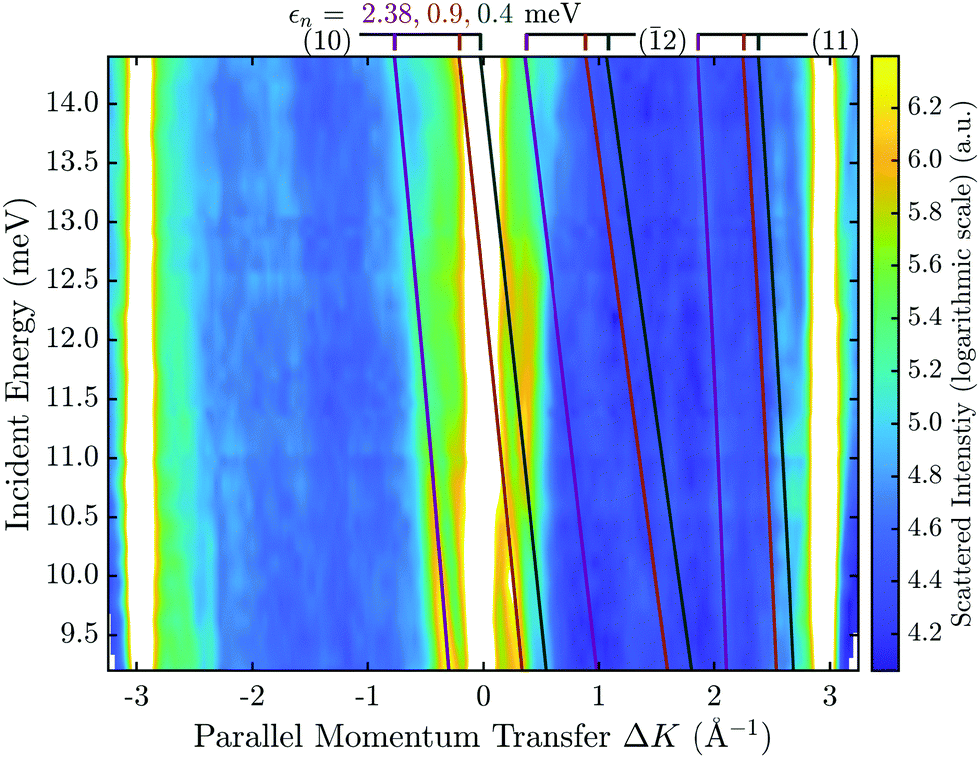 | ||
Fig. 6 Contour plot of the scattered He intensity in dependence of momentum transfer and incident energy along the  azimuth, for the Sb2Te3(111) sample at 113 K. The solid lines are the positions of the SAR features according to the free atom model with the different colours denoting the bound state energies ε1,2,3. The Miller indices of the interacting G-vectors are given in brackets. azimuth, for the Sb2Te3(111) sample at 113 K. The solid lines are the positions of the SAR features according to the free atom model with the different colours denoting the bound state energies ε1,2,3. The Miller indices of the interacting G-vectors are given in brackets. | ||
In order to decrease the linewidth and thus the separation of the SAR features, the sample is typically cooled down (e.g. to 113 K in Fig. 6) for these angular scans. The peak position at a certain ki can now be used to identify the corresponding diffraction channel G and bound state energy εn in the free atom-approximation. The coloured lines represent the kinematic conditions (6) for various εn, with the number in brackets denoting the interacting G-vector. For simplicity only the three most prominent interacting G-vectors, which show stronger intensities, are drawn. Analogous to an FT-HAS scan such as in Fig. 5(b), different G-vectors will give rise to different curvatures, versus incident energy, in these kind of plots, thus allowing for a better assignment of the involved G-vectors and bound states.
Following such an initial analysis for the He–Sb2Te3(111) system, three prominent lines can be attributed to three different bound state energies with the G-vector (10) with 2.38, 0.9 and 0.4 meV. The same measurement as in Fig. 6 was performed along the  azimuthal direction (see ESI†) from which, in addition to confirming the bound state energies along
  an additional bound state at 4.28 meV can be identified.
Finally, the four obtained bound-state energies were fitted to the laterally averaged Morse potential using a least squares method.17 The fit yields a potential with the parameters D = (5.5 ± 0.2) meV for the well depth and κ = (0.76 ± 0.05) Å−1 for the stiffness.
2.2 Surface electronic corrugation
After the determination of the laterally averaged atom-surface interaction potential V0, the surface electronic corrugation ξpp, as it appears in the corrugated potential needs to be considered. In principle, the corrugation determines the fraction of the incident beam which is scattered into diffractive channels and thus the diffraction intensities. Thus, following quantum mechanical scattering calculations the intensities in the angular diffraction scans can be determined98 and compared with the experimental intensities.Calculations of the scattered intensities can be performed using the elastic CC approach in which the time-independent Schrödinger equation is solved. Inserting the Fourier series of the surface potential and the wave function in this equation gives a set of coupled equations for the outgoing waves. These waves are numerically solved for in the CC-algorithm for a finite set of closed channels.18,99 The method of solving the set of coupled equations has been discussed widely in previous publications16,18,29,99,100 and the Fourier ansatz with the corrugation function and the corresponding coupling terms can be found in ref. 16, 29 and 100. The elastic CC-calculations further need to be corrected for the Debye–Waller attenuation, using a previously determined Debye–Waller factor101/surface Debye temperature ΘD (see ESI†).
As a starting point, the potential parameters from the kinematic analysis and an estimated value of the corrugation are used for the elastic CC-calculations. By comparing a data set of several angular scans over the high symmetry directions and at various sample temperatures the value of the corrugation is iteratively improved. The optimisation is usually performed by minimising a measure of the deviation R:
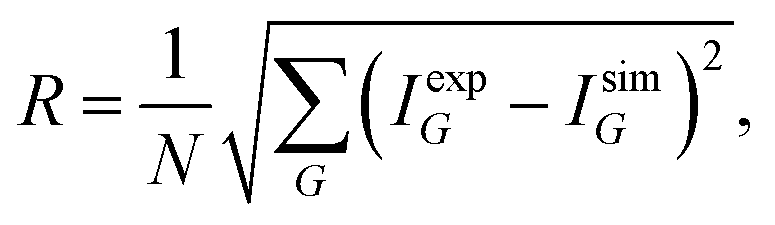 | (7) |
In Fig. 7 an exemplary comparison is depicted for a scan along the  direction of Sb2Te3 with an incident energy of 15.4 meV. The peak areas of the diffraction channels are fitted using Voigt profiles and shown as orange shaded regions, while the obtained values of the peak areas are indicated by the red stars. The calculated scattering intensities are plotted as green rectangles, showing good agreement with the experimentally determined values. Following this optimisation, the best fit value for the peak to peak corrugation of Sb2Te3 in percentage of the lattice constant is found to be ξpp = 5.5%.
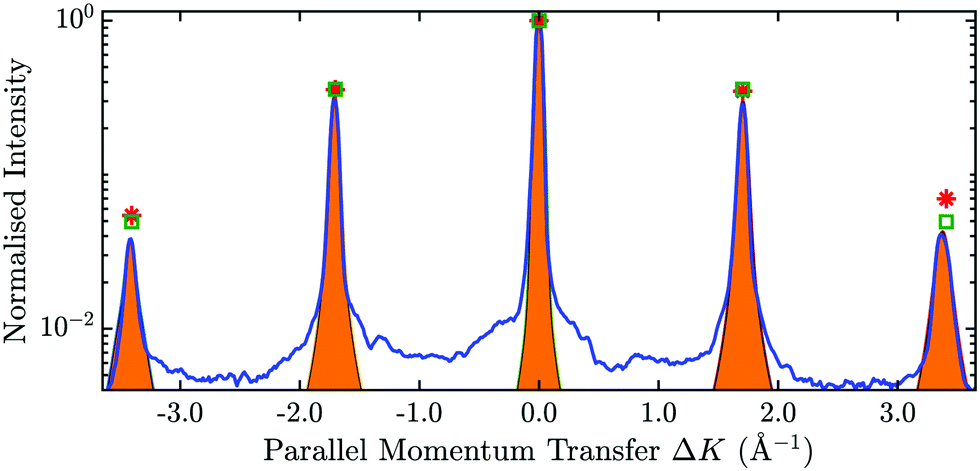 | ||
Fig. 7 The blue line shows the scattered intensity versus the parallel momentum transfer along the  azimuth of Sb2Te3(111). The orange areas show the fitted measured intensities based on a Voigt-profile, resulting in a value displayed as red stars. The green squares correspond to the calculated values based on elastic quantum-mechanical scattering calculations. azimuth of Sb2Te3(111). The orange areas show the fitted measured intensities based on a Voigt-profile, resulting in a value displayed as red stars. The green squares correspond to the calculated values based on elastic quantum-mechanical scattering calculations. | ||
2.3 The three-dimensional potential and quantum-mechanical scattering calculations
Although we have considered the surface electronic corrugation in Section 2.2 based on a comparison of diffraction intensities with quantum-mechanical scattering calculations, the potential parameters D and κ are still those based on the initial analysis following the free-atom approximation. In order to obtain a realistic, three-dimensional atom-surface interaction potential, further refinement of the potential based on the inclusion of larger experimental data sets and a comparison with quantum-mechanical scattering calculations is required as outlined in the following.While an analysis based on the free-atom approximation may be appropriate for “flat” metal surfaces, i.e. with a negligible electronic corrugation,102 surface corrugation is a necessary ingredient for SAR processes to occur. In fact, considering the semi-classical picture, the strength of diffractive scattering both into and out of a resonant state is determined by the corrugation and the “quality” of experimental SAR data will depend on the magnitude of the corrugation.
With increasing corrugation, resonances become stronger since more of the incident wave scatters into the resonant state. On the other hand, a larger corrugation will give rise to a greater deviation from the free-atom model making an analysis solely based on (4) and (6) much more difficult. The analysis of SARs is also affected by the dimensionality of the corrugation function since one-dimensional problems, such as e.g. stepped surfaces,18,19 have a simple band structure, while for systems which exhibit a two-dimensional corrugation there are many more open channels making it more difficult to find “isolated” SAR features. The strong deviation from the simple free-atom like dispersion and the broadening and overlap of SAR features for systems with a large 2-D corrugation makes the analysis much more challenging.103
In order to identify systematic shifts/misplacements due to the corrugation and dispersion in the picture of the three-dimensional interaction potential (see Fig. 5b), quantum mechanical scattering calculations considering the full-dimensional potential need to be used for a comparison. However, reproducing an angular scan, where ϑi is varied is rather difficult to implement in a CC-calculation. Instead it is much easier to follow the variation of the scattered intensity for a specific scattering channel in the CC calculation which is then compared to an experiment where e.g. Ei is varied while ϑi remains fixed in a conventional HAS experiment. The latter corresponds to a single slice at fixed φi of an FT-HAS experiment.
The so-called “drift scan” in a conventional HAS experiment is easily realised by changing  via the nozzle temperature while measuring the scattered intensity. Usually, this is done by monitoring the intensity of the specular channel, since the specular reflection provides the highest signal-to-noise ratio. Various dips and peaks in the drift scans give access to the detailed shape of the potential and can further be compared with the mentioned scattering calculations.
The left-most and the central panel in Fig. 8 show such a measurement (blue line) taken at 113 K for Sb2Te3, with several features that can be attributed to SAR processes. The dash-dotted light green line shows the CC calculation while the dark green curves were convoluted with a Gaussian function to account for an apparative broadening of the natural linewidths.17 By adjusting the parameters of the initial potential and comparing the position of the features (in terms of ki) from the scattering calculations with the experimental data it allows for a refinement of the potential parameters.
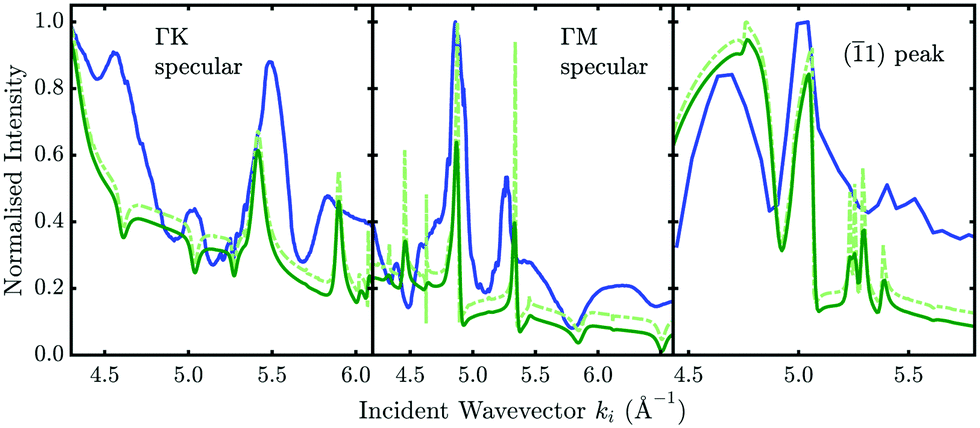 | ||
Fig. 8 Normalised scattered intensity of the diffraction peaks versus incident wavevector ki. The blue curve shows the measured Sb2Te3 data at 113 K with the solid green curve corresponding to the elastic CC-calculations corrected by the Debye–Waller factor according to the optimised three-dimensional potential. The dash-dotted curve has been convoluted with a Gaussian to account for the experimental/beam broadening. The so-called drift scans are plotted (from left to right) for the  specular, the specular, the  specular and the ( specular and the (![[1 with combining macron]](https://www.rsc.org/images/entities/char_0031_0304.gif) 1) diffraction peak, respectively. 1) diffraction peak, respectively. | ||
A more detailed description of the analysis of such drift scan spectra, including the adaptation of a corresponding R-factor and additional experimental effects such as nozzle flow corrections and surface terraces can be found in ref. 17. The scattered intensity of the (1) diffraction peak at a momentum transfer of ΔK = −3 Å−1 as shown in the right-most panel of Fig. 8 can also be analysed in the same manner. However, the fact that the position of the diffraction peak will shift with ϑi complicates such a measurement – hence the number of experimental points is much smaller compared to measurements at specular position. Nonetheless, several SAR features are again very well reproduced with the elastic CC-calculations using the same potential.
The final potential parameters following this kind of analysis and iterative optimisation can be found in Table 1. Therefore, once the potential parameters D and κ have been optimised, the corrugation ξpp is further improved by following the procedure of comparing the diffraction intensities as discussed in Section 2.2.
Finally, it should be noted that inelastic effects cannot be reproduced within the scheme of elastic CC-calculations, meaning that in addition to apparative broadening effects it is not possible to resemble the actual shape of the whole measured drift spectrum based on elastic calculations. One can clearly see that, e.g. for the measurement along the  azimuth, the peaks at 4.6 and 5.0 Å−1 occur as dips in the calculation which can possibly be explained by inelastic events that turn maxima into minima and vice versa.104,105 We can however obtain an estimate of the influence of inelastic events based on a comparison of how the broadening of SAR features changes when changing the sample temperature (see Section 4.1)
2.4 Linewidth and lifetime of SARs
As outlined in Section 2.3, corrugation is a necessary ingredient for SARs to occur and as the corrugation increases the resonances become stronger, as more of the incident wave scatters into the resonant state. However, at the same time resonances will become simultaneously broader since the resonance lifetime decreases through stronger scattering out of the resonant state.13Consequently, the broadening of SAR features in experimental measurements is related to the lifetime of the He atom in that particular bound state. The usual approach is to determine the external linewidth from e.g. an angular scan which has to be corrected with respect to resolution aspects of the apparatus, in order to obtain the actual internal/natural linewidth.18,106
However, in the few experimental studies available up to now, there is some ambiguity about how to obtain the corresponding lifetime from the measured linewidth which shall be clarified at this point. The lifetime follows from the uncertainty principle which is based on the standard deviations and therefore one should use the half-width at half-maximum (HWHM): following the uncertainty principle, the relation in terms of lifetime is a consequence of the Fourier theorem i.e. in classical wave mechanics the uncertainty of the angular frequency times the uncertainty in time is  . Following the derivation of response functions within the theory of time-dependent perturbations,21 an SAR exhibits a Lorentzian lineshape which decays according to exp(−t/τ), where τ is the lifetime. From the corresponding HWHM Γ of the Lorentzian it follows Γ = ℏ/τ and hence the experimental broadening can be used to determine the lifetime τ.
On the other hand, upon using the angular broadening of SARs in diffraction scans, those tend to be fitted with Gaussian functions since it makes a subtraction of the experimental broadening (being the sum of two Gaussians) to obtain the internal linewidth easier and the uncertainty in doing that is usually negligible. Following this approach, the SAR features in several diffraction scans are fitted with a Gaussian function which is then corrected for the effects of the angular resolution of the apparatus as well as the energy spread in the beam (see ref. 17 for further details). The HWHM Δεn of the Gaussian then yields the natural linewidth which is related to the lifetime τ of the bound state via τn = ℏ/Δεn.18,21
Moreover, using the lifetime, the distance that the He atom travels parallel to the surface can be estimated. Based on the parallel momentum K‖ = kisinϑi + G‖, where G‖ is the parallel component of the interacting G-vector, the velocity of the He atom parallel to the surface can be determined which together with the corresponding lifetime τn yields the travel distance Ln.
3 A comparison for semimetals and TIs
In the following, we provide a comparison of the He-surface interaction potential of binary TIs as well as of single-elemental Bi(111) and Sb(111).17,30,99,100 The determined potential parameters for the well depth D, stiffness κ and surface electronic corrugation ξpp are summarised in Table 1. All quantities have been determined based on HAS experiments, assuming a corrugated Morse potential following the approach presented in this perspective.Single elemental Sb(111) exhibits the most shallow potential well depth with D = 4.28 meV and the smallest stiffness κ = 0.39 Å−1, while at the same time, the value for the corrugation is the largest, with ξpp = 13.7% of the surface lattice constant. In comparison, single elemental Bi(111) exhibits the deepest potential well depth, possibly due to a larger polarisability of Bi compared to the other elements, giving rise to stronger vdW interactions and thus a deeper potential well. The latter also seems to transfer to the well depth of the binary TIs containing the element as described below.
In Fig. 9 the laterally averaged Morse potentials for all three binary TIs are plotted, based on the parameters from Table 1. The different well depths can be clearly seen in the potential energy values at zero distance from the surface. Bi2Se3 exhibits the deepest well depth among these binary TIs (D = 6.54 meV), but at the same time the smallest stiffness κ = 0.58 Å−1. Taken together it means that the laterally averaged potential of Bi2Se3 contains the largest number of bound states with a total of seven states with ε5 and ε6 being quite close to zero i.e. to the threshold condition. The well depth of Sb2Te3 is the most shallow one within the group of binary TIs and as the only binary TI without Bi in the compound this may be due to the influence of the heavier Bi atoms in the other two compounds (Bi2Se3 and Bi2Te3) with respect to the attractive part of the potential – i.e. the large polarisability of Bi as mentioned above.
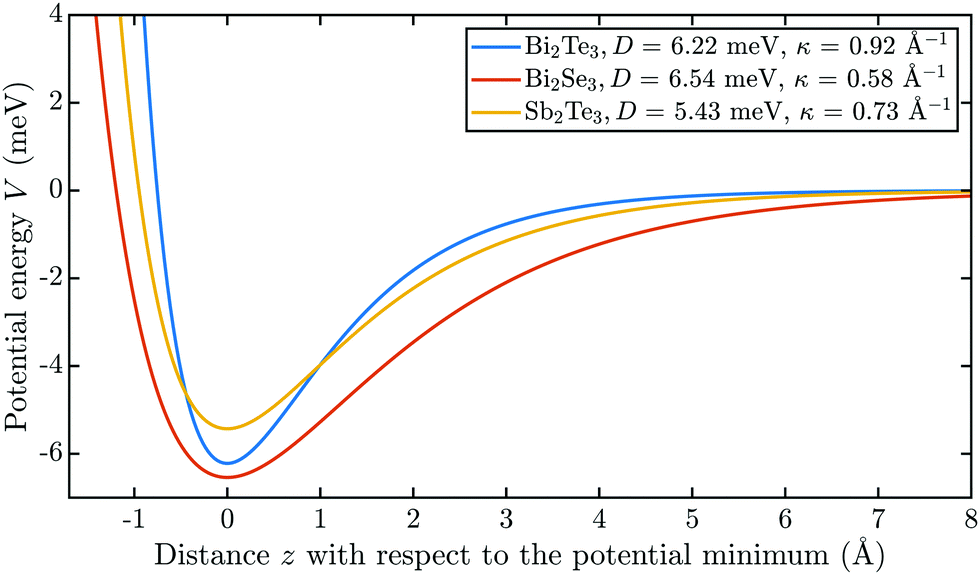 | ||
| Fig. 9 Comparison of the laterally averaged potentials V0(z) for the binary TIs based on the determined corrugated Morse potentials in Table 1. | ||
While some properties of the single-elemental group 15 semimetals (Bi,Sb) seem to transfer to the binary compounds, the uppermost layer of these binary TIs is either Se or Te (see Fig. 3b). Since the Se atoms are “smaller” compared to Te, the He atoms may get closer to the surface and might therefore experience stronger effects from the heavier Bi elements in the second atomic layer. The latter would make the Bi2Se3 interaction potential deeper compared to the Bi2Te3 potential with the terminating Te layer as is indeed the case according to Table 1.
These simple trends in terms of the atom-surface interaction well depth and stiffness seem to work upon comparison of the group 15 semimetals and the compounds forming the binary TIs, however, other data suggests that they cannot easily be extended to other groups across the periodic table. For example, for the layered material 2H-MoS2(0001), a He-surface potentital with a well depth D = 13.6 meV and stiffness κ = 1.15 Å−1 had recently been reported.95
4 The linewidth and lifetime of resonances
While several theoretical efforts have been devoted to studies of the lifetime of SAR effects18,19,107–109 and we will compare our findings with a few of those, experimental studies about the lifetimes of SARs are particularly scarce, with the exception of the He–LiF(001) system,106 a stepped copper surface110 and a few preceding studies of semimetal and TI surfaces.16,17The natural linewidths, corresponding lifetimes and travel distances for all four bound states of the He–Sb2Te3(111) potential are listed in Table 2. As expected, the lower the bound state (higher binding energies) the broader the natural linewidth Δεn yielding a shorter corresponding lifetime.13 As follows from (4), for bound states lying just below the threshold, the majority of the weight in ϕn(z) lies well away from the repulsive wall. Hence higher lying bound states couple weakly to the repulsive lateral corrugation: the He atom will remain longer in that particular state since the probability of scattering “out” of the bound state is smaller and the SAR exhibits a long lifetime and a narrow width in energy. In contrast, the lower lying bound states are broader, reflecting greater coupling to the repulsive corrugation.
| Bound state | ε n (meV) | Δεn (meV) | τ n (ps) | L n (Å) |
|---|---|---|---|---|
| ε 0 | 4.27 | 0.29 | 3.1 | 13 |
| ε 1 | 2.37 | 0.165 | 4.5 | 34 |
| ε 2 | 1.02 | 0.11 | 6.2 | 44 |
| ε 3 | 0.23 | 0.055 | 12.2 | 86 |
In comparison with other binary TIs, the internal linewidths for Bi2Se3 are very similar to the here reported values for Sb2Te3. The bound state ε2 = 2.3 meV for Bi2Se3 exhibits a lifetime of τ2 = 4.4 ps‡ and thus exhibits a very similar lifetime as the bound state ε1 in the case of Sb2Te3 (Table 2), which occurs at a similar binding energy. The same holds for Bi2Te3, where upon analysis of the angular scan for 3He scattering,30 a lifetime of about 15 ps for ε2 ≈ 0.3 meV is obtained.
The distances Ln, travelled parallel to the surface are also reported in Table 2 for Sb2Te3. Naturally, longer lifetimes in Table 2 correspond to longer distances travelled parallel to the surface with the longest lifetime in the case of Sb2Te3 (12.2 ps) corresponding to a travel length of 86 Å. The travel distances of bound states with similar energies among the binary TIs are again quite similar, e.g. ε1 for Sb2Te3 in Table 2 is in good agreement with the 36 Å for ε2 in the case of Bi2Se3. In fact the travel distances are also close to previous works of different systems. E.g. for LiF(001) L1 = 17 Å is found§ for the ε1 = 2.46 meV bound state at room temperature, whereupon we obtain L1 = 25 Å for ε1 when measured at room temperature (Table 3).
| Bound state | Δεn (meV) | τ n (ps) | L n (Å) | α τ (10−3 K−1) |
|---|---|---|---|---|
| ε 0 | 0.32 | 2.3 | 19 | 2.0 |
| ε 1 | 0.19 | 3.4 | 25 | 1.7 |
| ε 2 | 0.14 | 4.8 | 35 | 1.7 |
| ε 3 | 0.08 | 8.2 | 58 | 2.8 |
In addition to elastic and defect scattering, inelastic processes involving phonon scattering will further limit the lifetime, which becomes more important at elevated temperatures62 and will be further discussed below. The natural linewidth of a resonance will usually be given by the sum of elastic and inelastic processes, so that for the corresponding lifetime τ−1 = τel−1 + τinel−1 holds.
The longest travel distance L3 = 86 Å for Sb2Te3 implies that the crystal surface can be regarded as being perfect over this range. To put this in context, the angular broadening of the specular peak gives rise to an estimate (lower limit) for the quality of the crystal. For Sb2Te3 the domain sizes are larger than 500 Å while for Bi2Se3 and Bi2Te3 values of ≈1000 Å were found.17,98 Hence considering the travel distances it follows that inelastic effects must have a large influence on scattering out of the bound states, even for the cooled samples.
Even though SARs are certainly not the method of choice for the determination of crystal qualities we will in the following attempt to compare our findings with other methods such as scanning probe microscopy measurements. In general there seems to be a consensus that the cleavage of single crystals as well as the growth of thin films gives rise to terraces which are separated by one QL steps (≈1 nm high),111,112 though sub-QL steps have also been reported in some cases.113 The step height can also be determined from HAS measurements upon intensity oscillations with varying beam energy and comparable results have been obtained for Bi2Se3 single crystals.17 The overall size of individual terraces is generally reported to range between 100 nm to 1 μm.111 These can be readily compared with the domain sizes from the angular broadening of the HAS specular peak and are in good agreement with the above mentioned sizes.
In addition, there is experimental evidence coming from scanning tunneling microscopy that the surfaces of Sb2Te3114 and Bi2Te3115 but also similar materials such as PdTe2116 and PtTe2117 contain a substantial number of point defects with a characteristic clover shape, separated not more than 10 nm. While we do not expect that single point defects would have an influence on the mentioned width of the specular peak, these could possibly scatter the He atom out of the bound state and thus reduce the travel length. On the other hand, in Landau level spectroscopy of Sb2Te3 films grown by molecular beam epitaxy, a mean free path of about 80 nm is found in accordance with comparable terrace sizes114 which is again in very good agreement with the longest travel length of 86 Å reported for the highest bound state of the cooled Sb2Te3 sample. Hence while the travel length may be reduced due to inelastic scattering at single point defects, the contribution of inelastic phonon scattering channels to the lifetime is best discussed upon considering temperature dependent measurements as done in the following.
4.1 Elastic and inelastic contributions
The comparison in terms of the travel distances between several binary TIs shows that for similar materials but different potentials the travel distances are quite similar. Together with the much larger estimated domain sizes it follows that inelastic effects must in general play an important role. In fact it has already been noted quite early for SARs when scattering from graphite, that an appreciable amount must come from inelastic processes.118 Moreover, calculations of the corrugation in the example of Bi(111), where the inelastic CC gives a smaller corrugation with 6.3% of the lattice constant29 compared to the value from the elastic CC in Table 1 already imply the importance of inelastic phonon scattering and these should also be included in future studies.While elastic and defect scattering should be independent of the temperature, higher surface temperatures will give rise to an increase of inelastic (phonon) scattering events which will in turn significantly decrease the lifetimes. Table 3 shows the lifetimes for Sb2Te3, obtained at room temperature. In addition the temperature dependence of the linewidths of the 3He–Bi2Te3(111) and the 3He–Bi(111) system are shown in the ESI,† illustrating clearly an increased broadening with increasing temperature.
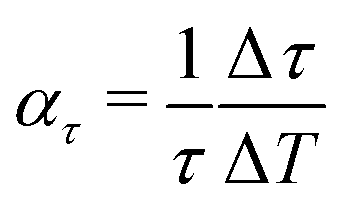
Comparing the lifetimes for Sb2Te3 at T = 113 K (Table 2) and T = 296 K (Table 3) shows that the lifetimes are by a factor of about 1.5 larger at low temperature. Assuming a linear increase with temperature, the effect is largest for the lowest bound state yielding Δτ/ΔT ≈ 0.02 ps K−1, although the changes relative to the lifetime at room temperature 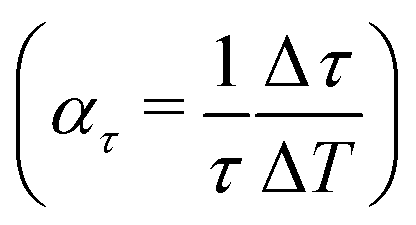 , as shown in the last column of Table 3 are comparable within the uncertainties.
The increase of phonon scattering with temperature can be compared to an earlier work of the stepped Cu(115) surface by Armand et al.110 and temperature dependent changes of the resonance peak width reported therein. Following the analysis for Sb2Te3 we obtain a value of ≈1 × 10⁻⁴ rad K−1 for the FWHM of the ε1 bound state and the (0) vector which is larger than for the bound states of the Cu(115) system with (1–2) × 10−5 rad K−1. Note however, that the interaction potential of Cu(115) is possibly closer to a 1D case as described above and for a stepped surface one expects a much shorter lifetime compared to flat surfaces based on elastic scattering channels alone.19 At the same time, the temperature dependence of the natural linewidths of molecular hydrogen adsorbed on Cu(001) shows a similarly strong temperature dependence108 compared to Sb2Te3(111). Thus we conclude that at least for the here presented binary TIs, surface imperfections only have a small influence on the linewidth of SARs and a large contribution comes from inelastic phonon scattering effects.
Actual quantitative statements of how the linewidths should change with temperature have not been addressed in any detail up to now. Some previous attempts to include phonon scattering effects in the description of SARs are based on a Debye–Waller theory. As shown for SARs on graphite, including a Debye–Waller factor may account for phonon scattering processes to some extend,104 but at specific incident energies the method becomes inadequate for the description of inelastic effects on the experimental resonance lineshapes.119,120 Moreover, the He–C(0001) potential is both steep and deep11 and thus closer to the situation of a hard wall potential in comparison to the here presented potentials.
In reality the temperature dependent population of the phonon states changes with the Einstein–Bose distribution, and hence phonon states are less populated at lower temperatures which therefore minimises the scattering probability. On the other, due to the heavy elements present in the here presented semimetals and TIs, the acoustic phonon modes will already be completely occupied even for the low temperature measurements (see ESI†). In this context it is also interesting to note that the temperature dependence in Table 3 is comparable for all binding energies, in contrast to the trend for the (absolute) linewidth, where higher lying bound states exhibit a weaker coupling and thus a longer lifetime. It suggests that the relative importance of phonon scattering contributions is larger for the higher lying bound states.
5 Conclusion and outlook
Studying the position, shape and width of selective adsorption resonances provides a powerful route for an experimental determination of the attractive part of the helium-surface potential, and hence an exceptionally sensitive test of any corresponding theory with one of the most precise sources of information about physisorption potentials. While recent experimental approaches for the study of van der Waals interactions based on atomic force microscopy measurements via pulling a single molecule10 and Xe-functionalised tips121 have achieved broad attention, resonance effects in atom-surface scattering, as an approach to study the vdW interaction at the surfaces have not been appreciated up to date.Within this perspective we have presented the experimental approach in observing effects of the attractive atom-surface interaction potential in gas-surface scattering experiments. While the great majority of recent experiments have concentrated on measuring resonance positions in order to determine an effective, laterally averaged potential our approach shows that experimental data can be used together with quantum mechanical scattering calculations to obtain an exact three-dimensional atom-surface potential. We have further shown that for the surfaces of semimetals and binary topological insulators a few general trends in terms of the atom-surface interaction well depth and stiffness exist.
A short view on recent ab intio approaches for the calculation of He-surface interaction potentials shows that it remains still difficult to accurately and simultaneously describe both the short range repulsive and the long range vdW part. It highlights the importance of atom-surface scattering experiments as a benchmark for ab initio treatments, in particular in terms of improving treatments of the long range interaction part.
Finally, we provide also experimental data about a number of so far much less studied features, namely the lifetime of SARs. Despite some general guidelines about the occurrence of maxima and minima in SARs122 the linewidth and lifetime of SARs remain an elusive subject. E.g. if inelastic effects are considered in calculations, those are often based on the assumption of a flat surface.123 Recent works have shown that the interaction of a particle with a vibrating corrugated surface can be described theoretically124,125 and the linewidths of SARs can also be studied within the formalism of inelastic close-coupled calculations. Such an additional analysis could show whether elastic or inelastic phonon scattering channels are mainly responsible for the lifetime of bound states. It would further allow to establish whether indeed the lifetimes of SARs on topological insulator surfaces are mainly limited due to inelastic effects as found in our experimental study.
With this perspective, we hope that the herein presented experimental approach and data will stimulate further research with respect to quantum studies of the trapping of light particles on surfaces.
Conflicts of interest
There are no conflicts to declare.Acknowledgements
We would like to thank G. Benedek for many helpful discussions. Our earlier works on the subject benefited in particular from the works and discussions with P. Kraus and S. Miret-Artés. The authors are grateful for financial support by the FWF (Austrian Science Fund) within the project P29641-N36 and NAWI Graz. A. T. acknowledges also financial support within the FWF project J3479-N20. We would like to thank Henriette E. Lund and Martin Bremholm for the synthesis of the samples, Marco Bianchi for his advice and help in terms of the sample preparation, and Philip Hofmann as well as the aforementioned colleagues for many helpful discussions and additional characterisations of the samples.References
- R. Frisch and O. Stern, Z. Phys., 1933, 84, 430–442 CrossRef CAS.
- J. E. Lennard-Jones and A. F. Devonshire, Proc. R. Soc. London, Ser. A, 1936, 156, 6–28 CAS.
- G.-J. Kroes and C. Díaz, Chem. Soc. Rev., 2016, 45, 3658–3700 RSC.
- G. B. Park, B. C. Krüger, D. Borodin, T. N. Kitsopoulos and A. M. Wodtke, Rep. Prog. Phys., 2019, 82, 096401 CrossRef CAS.
- Y. Alkoby, H. Chadwick, O. Godsi, H. Labiad, M. Bergin, J. T. Cantin, I. Litvin, T. Maniv and G. Alexandrowicz, Nat. Commun., 2020, 11, 3110 CrossRef CAS.
- L. W. Bruch, R. D. Diehl and J. A. Venables, Rev. Mod. Phys., 2007, 79, 1381–1454 CrossRef CAS.
- O. Bünermann, H. Jiang, Y. Dorenkamp, A. Kandratsenka, S. M. Janke, D. J. Auerbach and A. M. Wodtke, Science, 2015, 350, 1346 CrossRef.
- H. Jiang, M. Kammler, F. Ding, Y. Dorenkamp, F. R. Manby, A. M. Wodtke, T. F. Miller, A. Kandratsenka and O. Bünermann, Science, 2019, 364, 379–382 CrossRef CAS.
- C. Wagner, N. Fournier, V. G. Ruiz, C. Li, K. Müllen, M. Rohlfing, A. Tkatchenko, R. Temirov and F. S. Tautz, Nat. Commun., 2014, 5, 5568 CrossRef CAS.
- L. M. Woods, D. A. R. Dalvit, A. Tkatchenko, P. Rodriguez-Lopez, A. W. Rodriguez and R. Podgornik, Rev. Mod. Phys., 2016, 88, 045003 CrossRef.
- H. Hoinkes, Rev. Mod. Phys., 1980, 52, 933–970 CrossRef CAS.
- A. P. Jardine, S. Dworski, P. Fouquet, G. Alexandrowicz, D. J. Riley, G. Y. H. Lee, J. Ellis and W. Allison, Science, 2004, 304, 1790 CrossRef CAS.
- A. Jardine, H. Hedgeland, G. Alexandrowicz, W. Allison and J. Ellis, Prog. Surf. Sci., 2009, 84, 323 CrossRef CAS.
- D. Farías and K.-H. Rieder, Rep. Prog. Phys., 1998, 61, 1575 CrossRef.
- D. J. Riley, A. P. Jardine, S. Dworski, G. Alexandrowicz, P. Fouquet, J. Ellis and W. Allison, J. Chem. Phys., 2007, 126, 104702 CrossRef CAS.
- P. Kraus, M. Mayrhofer-Reinhartshuber, C. Gösweiner, F. Apolloner, S. Miret-Artés and W. E. Ernst, Surf. Sci., 2014, 630, 208–215 CrossRef CAS.
- A. Ruckhofer, A. Tamtögl, M. Pusterhofer, M. Bremholm and W. E. Ernst, J. Phys. Chem. C, 2019, 123, 17829–17841 CrossRef CAS.
- A. Sanz and S. Miret-Artés, Phys. Rep., 2007, 451, 37–154 CrossRef.
- M. I. Hernández, J. Campos-Martínez, S. Miret-Artés and R. D. Coalson, Phys. Rev. B: Condens. Matter Mater. Phys., 1994, 49, 8300–8309 CrossRef.
- N. Jean, M. I. Trioni, G. P. Brivio and V. Bortolani, Phys. Rev. Lett., 2004, 92, 013201 CrossRef CAS.
- G. Benedek and J. P. Toennies, Atomic Scale Dynamics at Surfaces, Springer Berlin Heidelberg, Berlin, Heidelberg, 2018 Search PubMed.
- B. S. Zhao, W. Zhang and W. Schöllkopf, Sci. Adv., 2016, 2, e1500901 CrossRef.
- G. Rojas-Lorenzo, J. Rubayo-Soneira, S. Miret-Artés and E. Pollak, Phys. Rev. A, 2020, 101, 022506 CrossRef CAS.
- M. Debiossac, P. Roncin and A. G. Borisov, J. Phys. Chem. Lett., 2020, 11, 4564–4569 CrossRef CAS.
- R. Guantes, A. Sanz, J. Margalef-Roig and S. Miret-Artés, Surf. Sci. Rep., 2004, 53, 199–330 CrossRef CAS.
- A. S. Sanz and S. Miret-Artés, J. Chem. Phys., 2005, 122, 014702 CrossRef CAS.
- J. M. Moix, E. Pollak and W. Allison, J. Chem. Phys., 2011, 134, 024319 CrossRef.
- A. R. Alderwick, A. P. Jardine, W. Allison and J. Ellis, Surf. Sci., 2018, 678, 65–71 CrossRef CAS.
- P. Kraus, A. Tamtögl, M. Mayrhofer-Reinhartshuber, F. Apolloner, C. Gösweiner, S. Miret-Artés and W. E. Ernst, J. Phys. Chem. C, 2015, 119, 17235–17242 CrossRef CAS.
- A. Tamtögl, M. Pusterhofer, M. Bremholm, E. M. Hedegaard, B. B. Iversen, P. Hofmann, J. Ellis, W. Allison, S. Miret-Artés and W. E. Ernst, Surf. Sci., 2018, 678, 25–31 CrossRef.
- A. Tamtögl, E. Bahn, J. Zhu, P. Fouquet, J. Ellis and W. Allison, J. Phys. Chem. C, 2015, 119, 25983–25990 CrossRef.
- M. Debiossac, A. Zugarramurdi, Z. Mu, P. Lunca-Popa, A. J. Mayne and P. Roncin, Phys. Rev. B, 2016, 94, 205403 CrossRef.
- R. Martínez-Casado, D. Usvyat, L. Maschio, G. Mallia, S. Casassa, J. Ellis, M. Schütz and N. M. Harrison, Phys. Rev. B: Condens. Matter Mater. Phys., 2014, 89, 205138 CrossRef.
- R. Martínez-Casado, D. Usvyat, G. Mallia, L. Maschio, S. Casassa, J. Ellis, M. Schütz and N. M. Harrison, Phys. Chem. Chem. Phys., 2014, 16, 21106–21113 RSC.
- K. Pernal, R. Podeszwa, K. Patkowski and K. Szalewicz, Phys. Rev. Lett., 2009, 103, 263201 CrossRef.
- M. Liao, R. Grenier, Q.-D. To, M. P. de Lara-Castells and C. Léonard, J. Phys. Chem. C, 2018, 122, 14606–14614 CrossRef CAS.
- N. L. Nguyen, N. Colonna and S. de Gironcoli, Phys. Rev. B: Condens. Matter Mater. Phys., 2014, 90, 045138 CrossRef.
- M. T. Vahdat, D. Campi, N. Colonna, L. F. Villalobos, N. Marzari and K. V. Agrawal, J. Mater. Chem. A, 2020, 8, 17747–17755 RSC.
- M. B. Nardelli, Solid State Commun., 1996, 97, 215–219 CrossRef CAS.
- A. Schüller, H. Winter, M. S. Gravielle, J. M. Pruneda and J. E. Miraglia, Phys. Rev. A: At., Mol., Opt. Phys., 2009, 80, 062903 CrossRef.
- M. Minniti, C. Díaz, J. L. F. Cuñado, A. Politano, D. Maccariello, F. Martín, D. Farías and R. Miranda, J. Phys.: Condens. Matter, 2012, 24, 354002 CrossRef CAS.
- M. P. de Lara-Castells, H. Stoll and A. O. Mitrushchenkov, J. Phys. Chem. A, 2014, 118, 6367–6384 CrossRef CAS.
- A. A. Tamijani, A. Salam and M. P. de Lara-Castells, J. Phys. Chem. C, 2016, 120, 18126–18139 CrossRef CAS.
- G. Zhang, X. Xiang, F. Yang, L. Liu, T. Tang, Y. Shi and X. Wang, Phys. Chem. Chem. Phys., 2016, 18, 15711–15718 RSC.
- S. Adhikari, H. Tang, B. Neupane, A. Ruzsinszky and G. I. Csonka, Phys. Rev. Mater., 2020, 4, 025005 CrossRef CAS.
- S. Grimme, J. Comput. Chem., 2004, 25, 1463–1473 CrossRef CAS.
- S. Grimme, J. Comput. Chem., 2006, 27, 1787–1799 CrossRef CAS.
- S. Grimme, J. Antony, S. Ehrlich and H. Krieg, J. Chem. Phys., 2010, 132, 154104 CrossRef.
- A. Tkatchenko and M. Scheffler, Phys. Rev. Lett., 2009, 102, 073005 CrossRef.
- C. Díaz, Y. Wang and F. Martín, in Encyclopedia of Interfacial Chemistry, ed. K. Wandelt, Elsevier, Oxford, 2018, pp. 1–9 Search PubMed.
- M. Dion, H. Rydberg, E. Schroeder, D. Langreth and B. Lundqvist, Phys. Rev. Lett., 2004, 92, 246401 CrossRef CAS.
- K. Berland, V. R. Cooper, K. Lee, E. Schrtöder, T. Thonhauser, P. Hyldgaard and B. I. Lundqvist, Rep. Prog. Phys., 2015, 78, 066501 CrossRef.
- R. Sabatini, T. Gorni and S. de Gironcoli, Phys. Rev. B: Condens. Matter Mater. Phys., 2013, 87, 041108 CrossRef.
- B. Kolb, X. Luo, X. Zhou, B. Jiang and H. Guo, J. Phys. Chem. Lett., 2017, 8, 666–672 CrossRef CAS.
- D.-L. Chen, W. A. Al-Saidi and J. K. Johnson, J. Phys.: Condens. Matter, 2012, 24, 424211 CrossRef.
- J. P. Prates-Ramalho, J. R. B. Gomes and F. Illas, RSC Adv., 2013, 3, 13085–13100 RSC.
- M. del Cueto, A. S. Muzas, G. Füchsel, F. Gatti, F. Martín and C. Díaz, Phys. Rev. B, 2016, 93, 060301 CrossRef.
- M. del Cueto, R. J. Maurer, A. A. Taleb, D. Farías, F. Martín and C. Díaz, J. Phys.: Condens. Matter, 2019, 31, 135901 CrossRef.
- G. Armand and J. Manson, J. Phys., 1983, 44, 473–487 CrossRef CAS.
- S. H. Patil, K. T. Tang and J. P. Toennies, J. Chem. Phys., 2002, 116, 8118–8123 CrossRef CAS.
- K. Wolfe-Brannon and J. H. Weare, Phys. Rev. B: Condens. Matter Mater. Phys., 1981, 24, 5753–5762 CrossRef CAS.
- F. E. Tuddenham, H. Hedgeland, J. Knowling, A. P. Jardine, D. A. MacLaren, G. Alexandrowicz, J. Ellis and W. Allison, J. Phys.: Condens. Matter, 2009, 21, 264004 CrossRef CAS.
- A. S. Muzas, F. Gatti, F. Martín and C. Díaz, Nucl. Instrum. Methods Phys. Res., Sect. B, 2016, 382, 49–53 CrossRef CAS.
- M. del Cueto, A. S. Muzas, F. Martín and C. Díaz, Nucl. Instrum. Methods Phys. Res., Sect. B, 2020, 476, 1–9 CrossRef CAS.
- M. del Cueto, A. S. Muzas, T. J. Frankcombe, F. Martín and C. Díaz, Phys. Chem. Chem. Phys., 2019, 21, 15879–15887 RSC.
- P. Hofmann, Prog. Surf. Sci., 2006, 81, 191–245 CrossRef CAS.
- A. Tamtögl, P. Kraus, M. Mayrhofer-Reinhartshuber, G. Benedek, M. Bernasconi, D. Dragoni, D. Campi and W. E. Ernst, npj Quantum Mater., 2019, 4, 28 CrossRef.
- P. Hofmann, M. M. Ugeda, A. Tamtögl, A. Ruckhofer, W. E. Ernst, G. Benedek, A. J. Martínez-Galera, A. Stróżecka, J. M. Gómez-Rodríguez, E. Rienks, M. F. Jensen, J. I. Pascual and J. W. Wells, Phys. Rev. B, 2019, 99, 035438 CrossRef CAS.
- M. Z. Hasan and C. L. Kane, Rev. Mod. Phys., 2010, 82, 3045–3067 CrossRef CAS.
- X.-L. Qi and S.-C. Zhang, Rev. Mod. Phys., 2011, 83, 1057–1110 CrossRef CAS.
- Y. Ando, J. Phys. Soc. Jpn., 2013, 82, 102001 CrossRef.
- M. Z. Hasan, S.-Y. Xu and G. Bian, Phys. Scr., 2015, T164, 014001 CrossRef.
- A. Bansil, H. Lin and T. Das, Rev. Mod. Phys., 2016, 88, 021004 CrossRef.
- B. Bradlyn, L. Elcoro, J. Cano, M. G. Vergniory, Z. Wang, C. Felser, M. I. Aroyo and B. A. Bernevig, Nature, 2017, 547, 298–305 CrossRef CAS.
- Y. L. Chen, J. G. Analytis, J.-H. Chu, Z. K. Liu, S.-K. Mo, X. L. Qi, H. J. Zhang, D. H. Lu, X. Dai, Z. Fang, S. C. Zhang, I. R. Fisher, Z. Hussain and Z.-X. Shen, Science, 2009, 325, 178–181 CrossRef CAS.
- J. E. Moore, Nature, 2010, 464, 194–198 CrossRef CAS.
- Y. Xia, D. Qian, D. Hsieh, L. Wray, A. Pal, H. Lin, A. Bansil, D. Grauer, Y. S. Hor, R. J. Cava and M. Z. Hasan, Nat. Phys., 2009, 5, 398 Search PubMed.
- H. Zhang, C.-X. Liu, X.-L. Qi, X. Dai, Z. Fang and S.-C. Zhang, Nat. Phys., 2009, 5, 438 Search PubMed.
- A. Tamtögl, E. A. Carter, D. J. Ward, N. Avidor, P. R. Kole, A. P. Jardine, J. Ellis and W. Allison, Rev. Sci. Instrum., 2016, 87, 066108 CrossRef.
- A. Tamtögl, D. Campi, M. Bremholm, E. M. J. Hedegaard, B. B. Iversen, M. Bianchi, P. Hofmann, N. Marzari, G. Benedek, J. Ellis and W. Allison, Nanoscale, 2018, 10, 14627–14636 RSC.
- A. Tamtögl, M. Sacchi, N. Avidor, I. Calvo-Almazán, P. S. M. Townsend, M. Bremholm, P. Hofmann, J. Ellis and W. Allison, Nat. Commun., 2020, 11, 278 CrossRef.
- P. Rodriguez-Lopez, W. J. M. Kort-Kamp, D. A. R. Dalvit and L. M. Woods, Nat. Commun., 2017, 8, 14699 CrossRef CAS.
- M. M. Otrokov, E. V. Chulkov and A. Arnau, Phys. Rev. B: Condens. Matter Mater. Phys., 2015, 92, 165309 CrossRef.
- T. Förster, P. Krüger and M. Rohlfing, Phys. Rev. B: Condens. Matter Mater. Phys., 2015, 91, 035313 CrossRef.
- A. D. Pia, S. Lisi, O. D. Luca, D. A. Warr, J. Lawrence, M. M. Otrokov, Z. S. Aliev, E. V. Chulkov, R. G. Agostino, A. Arnau, M. Papagno and G. Costantini, ChemPhysChem, 2018, 19, 2405–2410 CrossRef CAS.
- D. Hsieh, Y. Xia, D. Qian, L. Wray, J. H. Dil, F. Meier, J. Osterwalder, L. Patthey, J. G. Checkelsky, N. P. Ong, A. V. Fedorov, H. Lin, A. Bansil, D. Grauer, Y. S. Hor, R. J. Cava and M. Z. Hasan, Nature, 2009, 460, 1101–1105 CrossRef CAS.
- L. A. Wray, S.-Y. Xu, Y. Xia, D. Hsieh, A. V. Fedorov, Y. S. Hor, R. J. Cava, A. Bansil, H. Lin and M. Z. Hasan, Nat. Phys., 2011, 7, 32–37 Search PubMed.
- E. Wang, P. Tang, G. Wan, A. V. Fedorov, I. Miotkowski, Y. P. Chen, W. Duan and S. Zhou, Nano Lett., 2015, 15, 2031–2036 CrossRef CAS.
- G. Benedek, S. Miret-Artés, J. R. Manson, A. Ruckhofer, W. E. Ernst and A. Tamtögl, J. Phys. Chem. Lett., 2020, 11, 1927–1933 CrossRef CAS.
- L. M. Schoop, F. Pielnhofer and B. V. Lotsch, Chem. Mater., 2018, 30, 3155–3176 CrossRef CAS.
- D. Kong, W. Dang, J. J. Cha, H. Li, S. Meister, H. Peng, Z. Liu and Y. Cui, Nano Lett., 2010, 10, 2245–2250 CrossRef CAS.
- D. Eichenauer and J. P. Toennies, Surf. Sci., 1988, 197, 267–276 CrossRef CAS.
- G. Benedek, G. Brusdeylins, V. Senz, J. G. Skofronick, J. P. Toennies, F. Traeger and R. Vollmer, Phys. Rev. B: Condens. Matter Mater. Phys., 2001, 64, 125421 CrossRef.
- M. Debiossac, A. Zugarramurdi, P. Lunca-Popa, A. Momeni, H. Khemliche, A. G. Borisov and P. Roncin, Phys. Rev. Lett., 2014, 112, 023203 CrossRef CAS.
- G. Anemone, A. A. Taleb, G. Benedek, A. Castellanos-Gomez and D. Farías, J. Phys. Chem. C, 2019, 123, 3682–3686 CrossRef CAS.
- W. E. Carlos and M. W. Cole, Phys. Rev. B: Condens. Matter Mater. Phys., 1980, 21, 3713–3720 CrossRef CAS.
- J. Manson and G. Armand, Surf. Sci., 1983, 126, 681–688 CrossRef CAS.
- A. Tamtögl, P. Kraus, N. Avidor, M. Bremholm, E. M. J. Hedegaard, B. B. Iversen, M. Bianchi, P. Hofmann, J. Ellis, W. Allison, G. Benedek and W. E. Ernst, Phys. Rev. B, 2017, 95, 195401 CrossRef.
- P. Kraus, A. Tamtögl, M. Mayrhofer-Reinhartshuber, G. Benedek and W. E. Ernst, Phys. Rev. B: Condens. Matter Mater. Phys., 2013, 87, 245433 CrossRef.
- M. Mayrhofer-Reinhartshuber, P. Kraus, A. Tamtögl, S. Miret-Artés and W. E. Ernst, Phys. Rev. B: Condens. Matter Mater. Phys., 2013, 88, 205425 CrossRef.
- A. Tamtögl, M. Mayrhofer-Reinhartshuber, P. Kraus and W. E. Ernst, Surf. Sci., 2013, 617, 225–228 CrossRef.
- T. Andersson, P. Linde, M. Hassel and S. Andersson, J. Chem. Phys., 2006, 124, 114703 CrossRef CAS.
- D. J. Riley, A. P. Jardine, G. Alexandrowicz, H. Hedgeland, J. Ellis and W. Allison, J. Chem. Phys., 2008, 128, 154712 CrossRef CAS.
- J. S. Hutchison, Phys. Rev. B: Condens. Matter Mater. Phys., 1980, 22, 5671–5678 CrossRef CAS.
- S. Miret-Artés, Surf. Sci., 1996, 366, L735–L741 CrossRef.
- G. Brusdeylins, R. B. Doak and J. P. Toennies, J. Chem. Phys., 1981, 75, 1784–1793 CrossRef CAS.
- M. D. Stiles and J. W. Wilkins, Phys. Rev. B: Condens. Matter Mater. Phys., 1988, 37, 7306–7325 CrossRef CAS.
- M. Persson, L. Wilzén and S. Andersson, Phys. Rev. B: Condens. Matter Mater. Phys., 1990, 42, 5331–5334 CrossRef CAS.
- M. Hernández, S. Miret-Artés, P. Villarreal and G. Delgado-Barrio, Surf. Sci., 1992, 274, 21–34 CrossRef.
- G. Armand, J. Lapujoulade and J. R. Manson, Phys. Rev. B: Condens. Matter Mater. Phys., 1989, 39, 10514–10518 CrossRef.
- L. He, X. Kou and K. L. Wang, Phys. Status Solidi RRL, 2013, 7, 50–63 CrossRef CAS.
- P. Ngabonziza, R. Heimbuch, N. de Jong, R. A. Klaassen, M. P. Stehno, M. Snelder, A. Solmaz, S. V. Ramankutty, E. Frantzeskakis, E. van Heumen, G. Koster, M. S. Golden, H. J. W. Zandvliet and A. Brinkman, Phys. Rev. B: Condens. Matter Mater. Phys., 2015, 92, 035405 CrossRef.
- S. Borisova, J. Krumrain, M. Luysberg, G. Mussler and D. Grützmacher, Cryst. Growth Des., 2012, 12, 6098–6103 CrossRef CAS.
- Y. Jiang, Y. Wang, M. Chen, Z. Li, C. Song, K. He, L. Wang, X. Chen, X. Ma and Q.-K. Xue, Phys. Rev. Lett., 2012, 108, 016401 CrossRef.
- S. Kim, M. Ye, K. Kuroda, Y. Yamada, E. E. Krasovskii, E. V. Chulkov, K. Miyamoto, M. Nakatake, T. Okuda, Y. Ueda, K. Shimada, H. Namatame, M. Taniguchi and A. Kimura, Phys. Rev. Lett., 2011, 107, 056803 CrossRef.
- S. Das, A. S. Amit, A. Sirohi, L. Yadav, S. Gayen, Y. Singh and G. Sheet, Phys. Rev. B, 2018, 97, 014523 CrossRef CAS.
- H. Zheng, Y. Choi, F. Baniasadi, D. Hu, L. Jiao, K. Park and C. Tao, 2D Mater., 2019, 6, 041005 CrossRef CAS.
- D. Wesner, G. Derry, G. Vidali, T. Thwaites and D. Frankl, Surf. Sci., 1980, 95, 367–379 CrossRef CAS.
- P. Cantini, S. Terreni and C. Salvo, Surf. Sci., 1981, 109, L491–L496 CrossRef CAS.
- V. Celli, A. Marvin and G. Benedek, Surf. Sci., 1984, 148, 54–57 CrossRef CAS.
- S. Kawai, A. S. Foster, T. Björkman, S. Nowakowska, J. Björk, F. F. Canova, L. H. Gade, T. A. Jung and E. Meyer, Nat. Commun., 2016, 7, 11559 CrossRef CAS.
- K. L. Wolfe and J. H. Weare, Phys. Rev. Lett., 1978, 41, 1663–1666 CrossRef CAS.
- M. Persson, Phys. Rev. B: Condens. Matter Mater. Phys., 1987, 36, 7870–7882 CrossRef CAS.
- Z. Medina and B. Jackson, J. Chem. Phys., 2008, 128, 114704 CrossRef.
- L. W. Bruch, F. Y. Hansen and B. Dammann, Phys. Rev. B, 2017, 95, 214303 CrossRef.
- A. Ruckhofer, S. Halbritter, H. E. Lund, A. J. U. Holt, M. Bianchi, M. Bremholm, G. Benedek, P. Hofmann, W. E. Ernst and A. Tamtögl, Inelastic helium atom scattering from Sb2Te3(111): phonon dispersion, focusing effects and surfing, Phys. Chem. Chem. Phys., 2021 Search PubMed.
Footnotes |
| † Electronic supplementary information (ESI) available. See DOI: 10.1039/d0cp05388k |
| ‡ Note that here we use the HWHM from ref. 17 where originally the values were obtained for the full width at half maximum. |
| § Note that ref. 106 used the relation τn = h/Δεn with the Planck constant h. Therefore, the travel lengths Ln were recalculated using ℏ. |
| This journal is © the Owner Societies 2021 |