
AC versus DC field effects on the crystallization behavior of a molecular liquid, vinyl ethylene carbonate (VEC)
Daniel M.
Duarte
 ab,
Ranko
Richert
c and
Karolina
Adrjanowicz
*ab
ab,
Ranko
Richert
c and
Karolina
Adrjanowicz
*ab
aInstitute of Physics, University of Silesia, 75 Pulku Piechoty 1a, 41-500 Chorzow, Poland. E-mail: kadrjano@us.edu.pl
bSilesian Center for Education and Interdisciplinary Research (SMCEBI), 75 Pulku Piechoty 1, 41-500 Chorzow, Poland
cSchool of Molecular Sciences, Arizona State University, Tempe, Arizona 85287, USA
First published on 9th December 2020
Abstract
Using electric fields to control crystallization processes shows a strong potential for improving pharmaceuticals, but these field effects are not yet fully explored nor understood. This study investigates how the application of alternating high electric fields can influence the crystallization kinetics as well as the final crystal product, with a focus on the possible difference between alternating (ac) and static (dc) type fields applied to vinyl ethylene carbonate (VEC), a molecular system with field-induced polymorphism. Relative to ac fields, static electric fields lead to more severe accumulation of impurity ions near the electrodes, possibly affecting the crystallization behavior. By tuning the amplitude and frequency of the electric field, the crystallization rate can be modified, and the crystallization outcome can be guided to form one or the other polymorph with high purity, analogous to the findings derived from dc field experiments. Additionally, it is found that low-frequency ac fields reduce the induction time, promote nucleation near Tg, and affect crystallization rates as in the dc case. Consistency is also observed for the Avrami parameters n derived from ac and dc field experiments. Therefore, it appears safe to conclude that ac fields can replicate the effects seen using dc fields, which is advantageous for samples with mobile charges and the resulting conductivity.
Introduction
The study of crystallization plays an essential role in materials science and technology. The reason is that numerous physicochemical or mechanical properties of various materials depend on the degree of crystallinity, polymorphism, grain size, or crystal quality.1,2 Furthermore, understanding how to control the promotion or suppression of certain crystallization outcomes is essential for numerous applications. Applying an electric field is one of the methods to achieve this,3 and understanding the crystallization process of samples subjected to electric fields can lead to improved control of the crystalline product.There are several interesting effects that have been observed when applying an electric field during crystallization. Examples are a reduced nucleation time,4–12 increased nucleation rate,8,12 enlarged crystal size,4,10,12,13 and controlled polymorphic outcome.11,14–17 Guiding the crystallization behavior with the use of an external electric field might affect the nucleation and crystal growth process, thus leading to a completely different crystalline structure. Such phenomena are relevant for a wide range of compounds, such as pharmaceuticals, food products, and other chemicals. Recently,11 for the first time, it has been studied the crystallization behavior of a single component glass-forming liquid, vinyl ethylene carbonate (VEC), under high static (DC) electric field. This study has demonstrated that the dc field might affect the crystallization of a neat low-molecular-weight van der Waals liquid in a qualitative fashion. For example, the crystallization time is shortened and/or a completely new polymorphic form of the tested material can be obtained. The use of high fields in polar liquids results in field-induced orientations of the constituents18,19 as well as the modification of thermodynamics potentials,20–22e.g., free energy and entropy. It was also suggested that high electric fields could be used targeted crystallization into different polymorphs. Therefore, field-induced crystallization is a powerful tool for materials engineering and pharmaceutical industries.23,24
Likewise, for a DC case,11 the crystallization of VEC in the presence of alternating (AC) electric fields should facilitate changes in the crystallization patterns. Some of these aspects were demonstrated by us recently.25 Interestingly, it was found that the crystallization behavior depends on both the magnitude and the frequency of the applied electric field. With increasing the magnitude of the ac field or lowering the frequency, the crystallization was observed to become faster.
The present study aims to investigate in more detail the crystallization tendency of VEC in the presence of alternating (AC) electric fields and compare obtained results with that observed when using dc-fields. In order to facilitate such comparison, we have followed the same experimental protocols, which allow us to get insight into various aspects of the field-assisted crystallization. Our results point to the electric field promoting the formation of polar crystallites, whose concentration in the final material can be controlled by the frequency and the amplitude of the electric field. At low frequencies and high electric fields (ac), the crystallization behavior of VEC turns out to coincide with that observed in the presence of static fields (dc). Therefore, this work shows that both electrical fields (ac and dc) provide an interesting strategy to obtain novel materials and control the crystallization outcome for numerous molecular systems. The clear advantage of ac-fields is the reduction or elimination of space charge buildup and its impact on the crystallization outcome, which is inevitable when applying static fields for extended periods of time.
Experimental
The sample material, 4-vinyl-1,3-dioxolan-2-one or vinyl ethylene carbonate (VEC, 99% purity, CAS number 4427-96-7), was purchased from Sigma-Aldrich and used as received. VEC is a vinyl derivative of the model glass-forming liquid propylene carbonate (PC),26 which is a highly polar and low-molecular-weight van der Waals liquid with a large dipole moment (μ = 4.76 D).27 It has been referred to as ‘vinyl-PC’. The sample was loaded into a high-field capacitor cell described in detail in previous publications.11,25,28,29 Parallel discs of stainless-steel (SS) or titanium (Ti) served as electrodes, with the disc pair being separated by a Teflon ring of 25 or 50 μm thickness. The active inner electrode surface area is of 7 mm radius. For the d = 25 μm, the geometric capacitance is Cgeo = ε0πr2/d = 54.5 pF. By comparing the observed permittivity, ε = ε′ − iε′′, with reference data, the actual electrode separations were determined to be 20 and 53 μm. In order to assess possible electrode surface effects, some experiments were done using highly polished stainless-steel electrodes, while others were done using titanium electrodes with a somewhat rougher surface texture. Varying the gap between the electrodes helps to gauge the effect of electrode polarization. A Novocontrol Quatro system was used to control the temperature of the sample cell.Large ac electric fields were achieved by using a Trek PZD-700 high-voltage amplifier that boosts the output voltage of a Solartron SI-1260 gain-phase analyzer by a factor of 200. The current was determined from the voltage drop across a calibrated RC-shunt connected to the analyzer via a buffer amplifier that supports voltages up to 500 Vp. The role of this buffer amplifier is to protect the equipment from sample failure. In this configuration, the dielectric response of the sample can be measured within the frequency range from 30 mHz to 200 kHz at low fields and between 30 mHz to 120 kHz for fields up to 240 kV cm−1. All voltage and field amplitudes are reported as root-mean-square (RMS) values. More information about the system can be found elsewhere.29 All fields intended to affect the crystallization of VEC were around (and above) E ≈ 80 kV cm−1, while the amplitudes of the alternating fields used to measure dielectric permittivity only were kept below 16 kV cm−1, which is a factor of 25 lower in terms of nonlinear (∼E2) effects. Fields much below 80 kV cm−1 that are used only to measure the permittivity (without affecting the crystallization) are notified in the following parts also as E ≈ 0 kV cm−1, regardless of their actual value.
Results and discussion
To gain a detailed understanding of the effect of the ac-field on the crystallization, we have performed sets of experiments by following three different protocols. They are schematically shown in Fig. 1. Note that they are identical to the protocols used to investigate the effect of the dc-field on the crystallization of VEC. One advantage of using ac rather than dc fields is that persistent accumulation of charges at the electrodes is avoided, which could be a source of heterogeneous nucleation. | ||
| Fig. 1 Overview of the experimental protocols used to study the effect of frequency and magnitude of the ac field on the crystallization behavior of VEC. Protocols ‘A’ and ‘B’ were used to evaluate the ac field effect on the ongoing crystallization and nucleation rate. Protocol ‘C’ was followed to favor the formation of only the high-field polymorph as the optimal temperature range for nucleation of the low-field polymorph is located close to Tg. Each experiment starts at the equilibrium liquid state (1) at T = 243 K ≈ Tm + 15 K, and takes the sample to point (3), where the temperature is held at Tc = 198 K. Protocols ‘A’ and ‘B’ insert cooling to point (2) at T = 163 K (Tg − 8 K), or either T = 173 K (Tg + 1 K). In contrast, the temperature in protocol ‘C’ is never lower than Tc = 198 K. Crystallization occurs during the time interval tcry, step 3 → 4. Finally, the melting behavior is recorded during heating from Tc = 198 K back to T = 243 K, step 4 → 5. | ||
With the use of dielectric spectroscopy, the crystallization progress can be monitored by analyzing changes in the real part of the dielectric permittivity. In such a case, the increase in the crystal volume fraction with respect to the total volume of the sample can be estimated by using the following expression:
 | (1) |
A. Field amplitude effect
The first type of experiment aims to show the effect of ac fields when applied during the ongoing crystallization of VEC that started without an electric field. To that end, we have followed protocol ‘A’ as outlined in Fig. 1. In the absence of the high field, the sample was cooled down with a rate of approx. 10 K min−1 to 163 K, i.e., below the glass transition temperature (Tg = 172 K). Except for a few minutes needed for temperature stabilization, there is no waiting time at T = 163 K. We introduce this step to promote the nucleation of the ordinary crystal. As we don’t know what the nucleation curve looks like for VEC and at which temperature the nucleation rate is the most effective, we cool to below Tg and then heat back up so that along the way we will ultimately cross the regime of nucleation.Subsequently, the sample was heated up at a rate of approx. 5 K min−1 to the selected crystallization temperature, Tc = 198 K, at which the structural relaxation timescale is τα ≈ 10−6 s. Then, the sample is allowed to crystallize spontaneously for some time, and only after the liquid volume fraction has dropped to approx. 20%, the high ac-field was switched on. The ac-field was switched off again when approximately one-half of the total volume fraction had crystallized.
The data in Fig. 2 show the corresponding changes in the dielectric permittivity recorded at 1 Hz for different field magnitudes, 30, 80 and 130 kV cm−1 that were turned on during the ongoing crystallization. It is easily recognized that when the electric field is applied, the crystallization accelerates immediately, provided the field amplitude is sufficiently high. Furthermore, with the increasing the field magnitude, the rate of crystallization increases. The dielectric data presented in Fig. 2 demonstrates that with increasing the field magnitude, from 30 to 130 kV cm−1, the net rate of crystallization also increases systematically. In Fig. 3, we show the features corresponding to Fig. 2, but now in terms of the volume fraction of the crystalline material as a function of time. For the sake of clarity, Fig. 3 includes the results obtained for low-fields. It can be seen that the increase of the field magnitude from 15 to 30 kV cm−1 has almost no effect on the crystallization progress. On the other hand, in the presence of 80 kV cm−1, the crystallization rate accelerates considerably. This trend does not change even when the ac field is switched off again, see Fig. 3b.
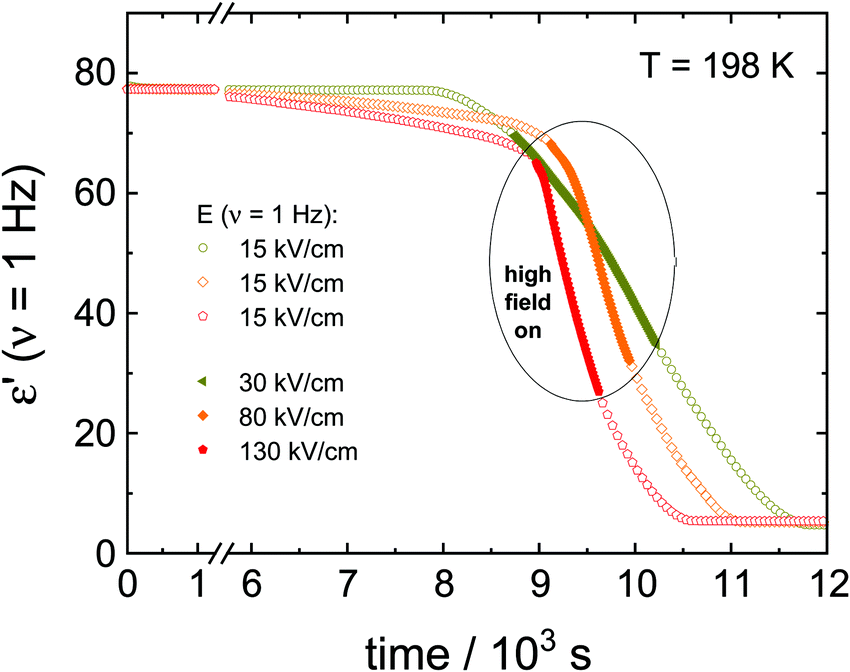 | ||
| Fig. 2 Time evolution of dielectric permittivity ε′ at ν = 1 Hz upon crystallization of VEC at Tc = 198 K. Different ac fields, 30, 80, and 130 kV cm−1, were switched on and off once the liquid volume fraction drops by approx. 20% and 55–60%, respectively. | ||
 | ||
| Fig. 3 Time-evolution of the crystal volume fraction, Vcry/Vtotal, recorded at Tc = 198 K for VEC. Panel (a) includes results collected when the ac-field of 15 kV cm−1 was applied throughout of the crystallization process and when it was temporarily raised up to 30 kV cm−1, (b) compares results for low-field case (<1 kV cm−1), 15 kV cm−1 and when increasing the field magnitude to 80 kV cm−1 only within Vcry/Vtotal changing from 0.2 to 0.6. | ||
We conclude that nucleation rather than crystal growth rate is primarily altered when using high amplitude ac fields. If the growth rate itself were accelerated by the electric field, then one expects that rate to decrease again when the field is removed, but that is not observed. This observation also implies that the nucleation curve, J(T), for the field-induced crystals extends into the T = 198 K range, which is not the case for the ordinary polymorph. Thus, our present finding is in line with the effects seen when a dc-bias instead of an ac field was used to induce changes in the crystallization behavior.11
B. High field timing
To further illustrate how an ac-field promotes crystallization of VEC, we have also switched it on/off at different stages of the ongoing crystallization process, as can be seen in Fig. 4. Note that the field magnitude (E = 80 kV cm−1) and its frequency (ν = 5.62 Hz) are the same in each case. For the case in which spontaneous crystallization had formed already about 20% of the ordinary crystal, turning on the electric field has no considerable effect on the ongoing crystallization (see diamonds in Fig. 4a). On the other hand, applying the ac field during the induction period (the time prior to the onset of crystallization) activates crystallization immediately. The same effect is observed when the sample is exposed to the ac field just after reaching Tc = 198 K (see squares in Fig. 4a). Subsequent heating of the crystalline material obtained in this way gives back two melting events, as illustrated in Fig. 4b. The melting point detected at a lower temperature (Tm2 = 208.5 K) corresponds to polymorphic form ‘2’ generated only in the presence of an ac field, while (Tm1 = 227 K) refers to the ordinary zero-field crystal. The melting curves presented in Fig. 4b suggest a near 100% volume fraction of the low-temperature polymorph for the crystals obtained in the course of the crystallization shown in Fig. 4a. Melting at Tm2 recovers practically the static permittivity, ε′ = εs, the value characteristic for the pure liquid state as indicated by the dashed gray line. This may be the expected outcome when the ac field is applied during the (low field) induction period. Interestingly, however, this holds even for the case where the field had been applied only after a considerable amount of the ordinary polymorph ‘1’ had already been formed (see diamonds in Fig. 4a). Therefore, under these conditions, the ac field is capable of converting the more stable polymorph ‘1’ into the field-induced polymorph ‘2’.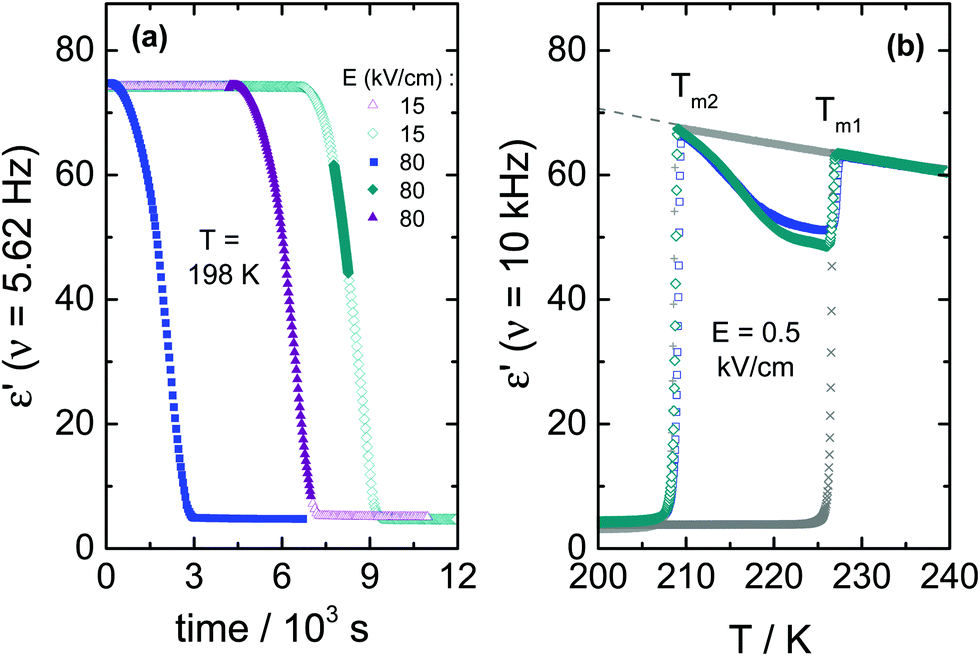 | ||
| Fig. 4 (a) Isothermal crystallization of VEC at Tc = 198 K exposed to an ac field of E = 80 kV cm−1 at a frequency of ν = 5.62 Hz switched on at the different stages of the crystallization process, as indicated by solid symbols; (b) evolution of the dielectric permittivity at ν = 10 kHz as a function of temperature measured on heating of the crystalline material obtained in the preceding step. At the same conditions, in the absence of a high field, only the ordinary form of VEC is obtained, see crosses. Melting curves were measured at very low fields (E = 0.5 kV cm−1) and at a fixed frequency of ν = 10 kHz. | ||
The decrease of the ε′ values above Tm2 signifies the recrystallization of the sample, which leads to the formation of ordinary, low-field crystals. From a previous study,11 we know that following this protocol and in the absence of any high field, only the high-temperature polymorph is generated, i.e., the ordinary crystal structure that melts at Tm1 = 227 K (see crosses in Fig. 4b). The recrystallization observed for T > Tm2 is only possible because nuclei of the ordinary polymorph are already present, as their nucleation rate at T > 198 K is negligible. Their volume fraction has to be too small to be detected in terms of ε′ < εs at T = Tm2, but sufficiently large to allow for effective crystal growth for Tm2 < T < Tm1.
It is interesting to note that the melting curves of Fig. 4b are virtually identical, regardless of when the ac field has been applied during the (field-free) induction time or crystallization process. We conclude that not only does the ac field open a very effective pathway to forming the field-induced polymorph melting at Tm2, but this polymorph ‘2’ is also formed at the expense of the polymorph ‘1’ volume fraction. Field amplitude and frequency will be decisive factors in such experiments.
C. Effect on nucleation
In the next step, we have studied the effect of the ac-field on the nucleation process at temperatures where crystal growth is exceedingly slow. To this end, we applied the protocol ‘B’, as outlined in Fig. 1b. Based on the previous investigations,11,25 we know that the optimal temperature region for nucleation of the ordinary VEC crystals is located in the vicinity of the glass transition temperature, Tg. On the other hand, the crystal growth is favored around 30 K above Tg. Therefore, in this experiment, the sample was cooled down to 173 K (= Tg + 2 K). At this temperature, it was subjected to an alternating electric field operating with different amplitudes and frequencies, for either 1 hour or 15 minutes. Then, the temperature was increased up to Tc = 198 K, and the crystallization progress was followed using dielectric spectroscopy, that is, by analyzing the drop of the dielectric permittivity ε′ at 10 kHz with time.The crystallization behavior of VEC at Tc is presented in Fig. 5 for those cases when the ac-field was applied for 1 hour at T = 173 K. As a reference, we also show the results for the sample annealed at 1 hour in the absence of an ac-field. As can be seen, when the nucleation process was carried out at the ac-field of 130 kV cm−1 with ν = 30 mHz, there is a slight difference in the crystallization curves compared to the low-field case. The increase of the field amplitude from 130 kV cm−1 up to 180 kV cm−1 also has very little effect on the crystallization rate. However, the effect of the high field at E = 130 kV cm−1 becomes more pronounced when decreasing the frequency of the ac field from 30 mHz to 10 mHz. To understand the frequency effect, we consider the position of the 10 and 30 mHz cases relative to the loss peak frequency (νmax) of the structural α-relaxation. The inset of Fig. 5 shows that at T = 173 K, the structural relaxation process has a peak maximum located at νmax = 60 mHz. It looks that the field-effect on the crystallization progress is more effective when decreasing the frequency of the ac-field much below νmax. Thus, the onset frequency below which the crystallization rate at Tc = 198 K is systematically affected by the ac field is expected to be orders of magnitude below that characterizing molecular reorientation in polar liquids. Indeed, it was found to match with the time scale of the reorientation of much bigger structures like the crystal nuclei.25 Therefore, the crystallization behavior of such polar molecular systems can be affected by a high ac field only below a certain frequency ν ≪ νmax. Provided this frequency condition is met, the increase of the ac field amplitude can accelerate the crystallization rate.
 | ||
| Fig. 5 Time-dependent changes in the dielectric permittivity ε′ at frequency ν = 10 kHz recorded upon crystallization of VEC at Tc = 198 K. Prior to these measurements, samples were annealed at T = 173 K in the presence of an ac field: E = 130 kV cm−1 (ν = 0.03 Hz and ν = 0.01 Hz), E = 180 kV cm−1 (ν = 0.03 Hz) and E = 0 kV cm−1. The inset shows the α-loss maximum at T = 173 K measured within the linear response regime. The arrows identify the frequencies used for high-field experiments. | ||
After complete crystallization, the melting behavior of the materials obtained in the course of the curves of Fig. 5 was identified via scanning T from 198 K to 245 K with a constant heating rate of 1 K min−1 (step 4 → 5, protocol ‘B’ shown in Fig. 1b). The corresponding dielectric results are presented in Fig. 6. We observe that the frequency of the ac-field affects not only the rate of crystallization but also the final crystallization product. For the nucleation carried out at T = 173 K in the presence of E = 130 kV cm−1 at ν = 10 mHz, only the high-field polymorph is formed, with no signatures of the recrystallization to the ordinary, zero-field crystals. We obtained the same result earlier when the sample was exposed to a dc-bias field.11 On the other hand, with E = 130 kV cm−1 and ν = 30 mHz, it appears impossible to nucleate the high-field form at 173 K and, therefore, only the ordinary (low-field) VEC crystals are formed.
 | ||
| Fig. 6 Temperature dependence of the dielectric permittivity ε′ (at ν = 10 kHz) recorded upon heating of VEC crystals generated at Tc = 198 K by following protocol B; (a) melting curves recorded for samples nucleated for 1 hour at T = 173 K in the presence of an ac field: E = 130 kV cm−1 (ν = 0.03 Hz and ν = 0.01 Hz), E = 180 kV cm−1 (ν = 0.03 Hz) and E = 0 kV cm−1; (b) melting curves recorded for samples nucleated at T = 173 K with a fixed ac-field of E = 180 kV cm−1 and frequency ν = 10 mHz for either 15 minutes or 1 hour. Data were measured in the linear response regime, at a heating rate of 1 K min−1. | ||
Up to this point, only cases associated with 1 hour annealing time at 173 K have been discussed. Now, we wish to assess if the time of applying high-field close to Tg affects the crystallization outcome. The curves in Fig. 6b compare the melting curves of the final products obtained using protocol ‘B’ after 15 and 60 minutes annealing at T = 173 K in the presence of 180 kV cm−1 at ν = 10 mHz. The pure low-field polymorph was obtained in both situations and, by observation of the melting curves, there are no significant differences in the final product. Consequently, durations beyond 15 minutes of applying the ac-field close to Tg do not have an impact concerning the crystal structure.
From these experiments based on protocol ‘B’, it is obvious that an alternating electric field can guide the nucleation process away from forming the ordinary crystal structure ‘1’ and towards the new field-induced polymorph ‘2’. Given the right field conditions, i.e., high amplitude and sufficiently low frequency, the preference for nucleating the low-melting polymorph ‘2’ is extremely high, as no recrystallization is observed after melting at Tm2 = 208.5 K. Again, the field not only produced the polymorph ‘2’ nuclei but also prevent the nucleation of polymorph ‘1’, which does occur in the absence of a field. The very-low-frequency case of 10 mHz yields results consistent with analogous experiments using a dc field.11
D. Frequency dependence
For the comparison of ac and dc type fields, it is important to realize that there is a marked frequency dependence for the effects obtained with ac fields. To emphasize this, we show the crystallization kinetics as a function of the frequency for a fixed amplitude of the ac-field using data obtained via protocol ‘C’. In this case, the liquid sample was cooled down to the selected crystallization temperature, Tc = 198 K, which is about 27 K above Tg. At this temperature, the time scale of structural relaxation reaches τα ≈ 10−6 s. Then, the ac field was applied to induce the crystallization, following the protocol depicted in Fig. 1c. By keeping the field magnitude constant at E = 80 kV cm−1, we investigated the frequency dependence of the ac field on the crystallization kinetics of the liquid under test, VEC. We have analyzed the evolution of the dielectric permittivity with time at various frequencies. The raw dielectric data presented in Fig. 7a demonstrates that the crystallization speeds up as the ac field frequency decreases. The impact of the frequency is very amazing because after crossing a certain and very sharp threshold, the crystallization will not occur even after a few days waiting. We have pointed out this issue in our recent paper,25 here changes in the dielectric response of the sample due to crystallization are reported as the volume fraction of crystalline material, Vcry/Vtotal. | ||
| Fig. 7 (a) Time evolution of dielectric permittivity ε′ at Tc = 198 K upon time-dependent measurements of VEC with the ac electric field of E = 80 kV cm−1 at different frequencies: 56.2, 562 mHz, 5.62, 17.8, 56.2, 100 Hz and 10 kHz. Solid lines refer to data fitting to the stretched exponential function; (b) variation of ε′, at ν = 10 kHz, recorded on heating (with a rate of 1 K min−1) of the crystalline material obtained in the preceding step, measured in the absence of a high ac field. | ||
After crystallization, the heating scan from T = 198 K to 245 K was performed to verify the composition of the crystalline material generated in the presence of ac-field. The corresponding melting curves are presented in Fig. 7b. In the low-frequency range, applying an ac-field of 80 kV cm−1 induces the formation of the low-temperature polymorph of VEC. The use of dc fields will also generate the high-field polymorph that melts at a temperature of about 20 K below that of the ordinary crystal.11 However, as the frequency of the ac-field approaches the characteristic threshold of ν = 17.8 Hz at T = 198 K, the final product is a mixture of the low-melting polymorph and the standard form. It is worth to note that the frequency of approximately ν ≈ 18 Hz corresponds to that associated with the alignment of the small crystal nuclei in electric fields.25
As with the nucleation results at T = 173 K discussed in Section C, we see again at Tc = 198 K that only below a certain frequency threshold can the ac-field alter the crystallization behavior of this polar molecular liquid. As a result, only frequencies below that threshold will be expected to compare with the dc results. It is not the absolute frequency that is relevant, but its value relative to the loss peak frequency, νmax, that characterizes the structural relaxation time and viscosity at a given temperature. Also analogous to the nucleation at a low temperature of T = 173 K, field-induced nucleation at Tc = 198 K can lead to the low-melting crystal structure with high polymorph purity, as indicated by the lack of recrystallization above Tm2 for the ν ≤ 5.62 Hz cases in Fig. 7b.
E. Crystallization kinetics
Two key parameters than can describe the crystallization kinetics are the characteristic crystallization time τcry and the Avrami parameter n. The latter provides information about the dimensionality and geometry of the growing crystals.30 We determine both from the fitting of the crystallization curves with the use of the Avrami equation | (2) |
The resulting dependencies of τcry on frequency ν and the field amplitude E at Tc = 198 K are collected for the tested compound in Fig. 8a and b, respectively. The evolution of the Avrami parameter n plotted as a function of frequency and amplitude of the ac-electric field is given in Fig. 9a and b, respectively. From the results compiled in Fig. 8, it is clear that the τcry(ν) dependence has a sigmoidal curve with the two plateaus located at the high and low-frequency limits. When the ac field magnitude is fixed, the most pronounced changes are observed at the frequency range around 20–50 Hz. This is at least five orders of magnitude lower than the νmax corresponding to the loss peak of the α-process, which characterizes molecular reorientation in liquids. When using an ac-field frequency, which is above the transition frequency region, the crystallization times are very long. Instead, for frequencies that are located below this transition, the crystallization rate eventually saturates and approaches the value characteristic for the static dc-field (ν = 0 Hz). The use of different electrode materials, which in the present case are more rough titanium and highly polished stainless-steel, results in almost the same crystallization times. The characteristic frequency dependence is also seen when increasing the sample volume achieved by changing the electrode separation from 20 to 53 μm. The data of Fig. 8b show that increasing the field magnitude enhances the rate of crystallization, just like decreasing the field frequency. This ease of crystallization at higher amplitudes it due to the alteration of the potential energy of the molecules after them align with the electric field, contributing to form small nuclei that will facilitate effective crystal growth.
 | ||
| Fig. 8 The characteristic time of crystallization for VEC plotted as a function of (a) frequency at E = 80 kV cm−1 and E = 61 kV cm−1; (b) amplitude of the ac-field at fixed frequency ν = 56.2 Hz. Different electrode materials (SS vs. Ti) and different spacings d between the electrodes were used to discriminate possible electrode effects. The corresponding DC data were added for comparison. | ||
 | ||
| Fig. 9 Dependence of the Avrami parameter n for VEC as a function of (a) frequency at E = 80 kV cm−1 and E = 61 kV cm−1; (b) amplitude of the ac-field at fixed frequency ν = 56.2 Hz and ν = 0.1 Hz. Different electrode materials (SS vs. Ti) and different spacings d between the electrodes were used to discriminate possible electrode effects. The corresponding DC data were added for comparison. | ||
In order to observe the distinct changes in crystallization when the sample is exposed to high fields of varying magnitude, its frequency should be taken from the characteristic frequency transition region, as presented in Fig. 8a. When the frequency of the ac-field is remote from that corresponding to the reorientation frequency of the polar crystal nuclei, the effect of the ac field on crystallization is strongly diminished. For 56.2 Hz, the two limiting values of τcry are at E = 0 kV cm−1 and above E = 150 kV cm−1, see Fig. 8b. At this magnitude of the field, the crystallization of VEC is accelerated by a factor of ten compared with the zero-field case. The discrepancy between τcry values seen in Fig. 8b for ac and dc experiments is only due to the high frequency (ν = 56.2 Hz) of the ac-field relative to the low-frequency limit established in Fig. 8a only for ν ≤ 5.62 Hz. Apart from this offset between ac and dc field data, the slope with which log(τcry) changes with field magnitude is very similar for the ac and dc cases.
Using high fields, one can influence not only the crystallization time but also how the molecular systems are arranged in the crystalline structure. The Avrami parameter n can capture such features. However, one should remember that the electric field forces a particular orientation of the crystallites, on the condition that the crystal nuclei suspended in the liquid are polar. The evolution of the Avrami parameter n as a function of frequency and field amplitude is presented in Fig. 9a and b, respectively. The results indicate that the morphology of growing crystals is very sensitive to both parameters. Found at either low fields or high frequencies, the value n ≈ 3.6 signifies a spherical growth of the crystallites with sporadic nucleation events. In contrast, with decreasing the frequency or increasing the field magnitude, the Avrami parameter drops down to approximately n ≈ 1.5, which suggests that the crystallites adopt a more rod-like morphology and grow from instantaneously formed nuclei. For comparison, we also show the dependence of the Avrami parameter n on the dc bias field. Amazingly, they both fall onto the same pattern of behavior.
Conclusions
In this work, we have explored the effect of an ac electric field on the crystallization behavior of the polar molecular liquid, VEC. We have applied three experimental protocols that aim to focus on different aspects of the crystallization process. From the results, we deduce that a high electric field favors the formation of the new polymorph with lower melting temperature while at the same time impede the growth of the ordinary zero-field form. Supportive of this effect are a high field amplitude and a frequency of the ac field that allows for the reorientation of crystallites so that their free energy can be lowered by the field. Moreover, varying the field amplitude and frequency facilitates control over the crystallization time and the morphology of the growing crystals. Both parameters of the Avrami equation, the crystallization time (τcry) and the exponent (n) depend on frequency and field magnitude in a sigmoidal fashion, indicating limiting behavior for high amplitudes/low frequencies and for low amplitudes/high frequencies.Interestingly, the low-frequency/high-field limiting values of τcry and n were found to be consistent with those obtained from the dc-bias experiments (ν = 0 Hz). Thus, both ac and dc electric fields can be used to tune and control the crystallization behavior of such materials. The field-induced changes in crystallization outcome will occur only for polar molecular systems that form crystal nuclei with lowered free energy due to the presence of the electrical field. With this condition fulfilled, sufficiently high field amplitudes can modify the crystallization kinetics and favor the formation of the new polymorphs. With the right protocol and field parameters, crystalline materials with very high polymorph purity could be obtained.
The knowledge of how to control the crystallization behavior is of great importance in material engineering and pharmaceutical applications, as different crystal structures will change the final product properties. Thus, the use of high ac-fields provides a new approach to modify the crystallization patterns and even promote or suppress specific polymorphs. This study outlines the potential routes to explore and the key parameters that should be considered to take advantage of the field effects on crystallization. Unfortunately, we are not able to carry out further studies of VEC's unique high-field polymorph due to its low melting point, which prevents ex situ structure studies at room temperature.
Conflicts of interest
There are no conflicts to declare.Acknowledgements
Part of this work was supported by the National Science Foundation under Grant No. DMR-1904601. Financial support from the National Science Centre within the framework of the SONATA BIS project (Grant No. 2017/26/E/ST3/00077) is greatly acknowledged.References
- A. Lendlein and S. Kelch, Angew. Chem., Int. Ed., 2002, 41, 2034 CrossRef CAS.
- J. Haleblian and W. McCrone, J. Pharm. Sci., 1969, 58, 911–929 CrossRef CAS PubMed.
- G. J. Evans, Mater. Lett., 1984, 2, 420–423 CrossRef CAS.
- M. Taleb, C. Didierjean, C. Jelsch, J. Mangeot, B. Capelle and A. Aubry, J. Cryst. Growth, 1999, 200, 575–582 CrossRef CAS.
- C. N. Nanev and A. Penkova, J. Cryst. Growth, 2001, 232, 285–293 CrossRef CAS.
- C. N. Nanev and A. Penkova, Colloids Surf., A, 2002, 209, 139–145 CrossRef CAS.
- A. Moreno and G. Sazaki, J. Cryst. Growth, 2004, 264, 438–444 CrossRef CAS.
- H. Koizumi, K. Fujiwara and S. Uda, Cryst. Growth Des., 2009, 9, 2420–2424 CrossRef CAS.
- T. K. Walter, C. F. da G. Ferreira, J. Iulek and E. M. Benelli, ACS Omega, 2018, 3, 8683–8690 CrossRef CAS PubMed.
- G. Sazaki, A. Moreno and K. Nakajima, J. Cryst. Growth, 2004, 262, 499–502 CrossRef CAS.
- K. Adrjanowicz, M. Paluch and R. Richert, Phys. Chem. Chem. Phys., 2018, 20, 925–931 RSC.
- H. Koizumi, Y. Tomita, S. Uda, K. Fujiwara and J. Nozawa, J. Cryst. Growth, 2012, 352, 155–157 CrossRef CAS.
- M. I. Al-haq, E. Lebrasseur, H. Tsuchiya and T. Torii, Crystallogr. Rev., 2007, 13, 29–64 CrossRef CAS.
- G. Di Profio, M. T. Reijonen, R. Caliandro, A. Guagliardi, E. Curcio and E. Drioli, Phys. Chem. Chem. Phys., 2013, 15, 9271 RSC.
- J. E. Aber, S. Arnold, B. A. Garetz and A. S. Myerson, Phys. Rev. Lett., 2005, 94, 145503 CrossRef PubMed.
- C. Parks, A. Koswara, H.-H. Tung, N. Nere, S. Bordawekar, Z. K. Nagy and D. Ramkrishna, Cryst. Growth Des., 2017, 17, 3751–3765 CrossRef CAS.
- K. Kotsuki, S. Obata and K. Saiki, Langmuir, 2014, 30, 14286–14291 CrossRef CAS PubMed.
- E. Gattef and Y. Dimitriev, Philos. Mag. B, 1979, 40, 233–242 CAS.
- E. Gattef and Y. Dimitriev, Philos. Mag. B, 1981, 43, 333–343 CAS.
- D. Kashchiev, J. Cryst. Growth, 1972, 13–14, 128–130 CrossRef CAS.
- D. Kashchiev, Philos. Mag., 1972, 25, 459–470 CrossRef CAS.
- J. O. Isard, Philos. Mag., 1977, 35, 817–819 CrossRef CAS.
- A. Y. Lee, D. Erdemir and A. S. Myerson, Annu. Rev. Chem. Biomol. Eng., 2011, 2, 259–280 CrossRef CAS PubMed.
- J. Bauer, S. Spanton, R. Henry, J. Quick, W. Dziki, W. Porter and J. Morris, Pharm. Res., 2001, 18, 859–866 CrossRef CAS PubMed.
- D. M. Duarte, R. Richert and K. Adrjanowicz, J. Phys. Chem. Lett., 2020, 11, 3975–3979 CrossRef CAS PubMed.
- A. Jedrzejowska, K. L. Ngai and M. Paluch, J. Phys. Chem. A, 2016, 120, 8781–8785 CrossRef CAS PubMed.
- A. Jedrzejowska, Z. Wojnarowska, K. Adrjanowicz, K. L. Ngai and M. Paluch, J. Chem. Phys., 2017, 146, 094512 CrossRef.
- S. Roy and R. Richert, Biochim. Biophys. Acta, Proteins Proteomics, 1844, 2014, 323–329 Search PubMed.
- U. Pathak and R. Richert, Colloid Polym. Sci., 2014, 292, 1905–1911 CrossRef CAS.
- M. Avrami, J. Chem. Phys., 1940, 8, 212–224 CrossRef CAS.
| This journal is © the Owner Societies 2021 |