A chemically consistent rate constant for the reaction of nitrogen dioxide with the oxygen atom†
Yan
Li
 a,
Sandra
Javoy
 b,
Remy
Mevel
 *c and
Xuefei
Xu
 *a
*a
aCenter for Combustion Energy, Department of Energy and Power Engineering, and Key Laboratory for Thermal Science and Power Engineering of Ministry of Education, Tsinghua University, Beijing 100084, China. E-mail: xuxuefei@tsinghua.edu.cn
bUniversity of Orléans, Department of Chemistry, 1, Rue de Chartres, BP 6759, 45067 Orléans Cedex 02, France
cCenter for Combustion Energy, School of Vehicle and Mobility, and State Key Laboratory for Automotive Safety and Energy, Tsinghua University, Beijing 100084, China. E-mail: mevel@mail.tsinghua.edu.cn
First published on 17th December 2020
Abstract
In the present study, a chemically consistent rate constant for the reaction between nitrogen dioxide and the oxygen atom has been obtained by combining low-temperature experimental data from the literature and new high-temperature quantum chemical calculations. The expression for our rate constant is kNO2+O=NO+O2= 2.589 × 10¹⁵T−1.035![[thin space (1/6-em)]](https://www.rsc.org/images/entities/char_2009.gif) exp(−226/RT) + 4.242 × 10¹⁶T−0.861exp(−50
exp(−226/RT) + 4.242 × 10¹⁶T−0.861exp(−50![[thin space (1/6-em)]](https://www.rsc.org/images/entities/char_2009.gif) 917/RT) cm3 mol−1 s−1, where R = 8.314 J mol−1 K−1, and is valid over the temperature range T = 221 to 3000 K. The effect of the inclusion of the new rate constant on the prediction of three detailed reaction models from the literature has been studied using (i) new experimental oxygen atom profiles obtained in a shock tube during nitrogen dioxide pyrolysis, and (ii) published shock tube and jet-stirred reactor data for H2–NOx mixtures with and without dioxygen. The impact of the new rate constant on the sensitivity coefficients and reaction pathways has also been analyzed under some conditions. Overall, the predictive capability of the reaction models were improved. The present study suggests that our chemically consistent rate constant should be included in detailed reaction models for combustion applications.
917/RT) cm3 mol−1 s−1, where R = 8.314 J mol−1 K−1, and is valid over the temperature range T = 221 to 3000 K. The effect of the inclusion of the new rate constant on the prediction of three detailed reaction models from the literature has been studied using (i) new experimental oxygen atom profiles obtained in a shock tube during nitrogen dioxide pyrolysis, and (ii) published shock tube and jet-stirred reactor data for H2–NOx mixtures with and without dioxygen. The impact of the new rate constant on the sensitivity coefficients and reaction pathways has also been analyzed under some conditions. Overall, the predictive capability of the reaction models were improved. The present study suggests that our chemically consistent rate constant should be included in detailed reaction models for combustion applications.
1 Introduction
Nitrogen dioxide (NO2) is a well known pollutant originating from combustion processes. It participates in ozone formation in urban and suburban areas.1 The kinetics of nitrogen dioxide is also relevant to the combustion of solid propellants and energetic materials which are characterized by chemical structures with one or several nitro groups.2 Nitrogen dioxide could also be attractive as an auto-ignition promoter of hydrogen–oxygen mixtures since its addition induces a strong reduction of the auto-ignition delay time in the second explosion limit region.3–5 The strong impact of NO2 addition in reducing the ignition delay-time was also demonstrated for methane–oxygen mixtures based on the study of Mathieu et al..6 In addition to practical propulsion applications, the chemistry of nitrogen dioxide is relevant to more fundamental subjects since a number of mixtures such as CH3NO2(–O2), H2–NO2/N2O4, CH4–NO2/N2O4 and C2H6–NO2/N2O4 exhibit a double cellular structure while detonating.7–10 The thermal decomposition of nitrogen dioxide leads to the formation of NO and O11 and numerous studies are available for the high-temperature rate constant of this reaction.11–16 On the contrary, the reaction of atomic oxygen with NO2 has been much less investigated at high temperatures11,17 and most studies have been performed in the low-18–23 and intermediate-temperature24 ranges. It has been shown previously that the reactions of the oxygen atom with nitrous oxide (N2O) need to be accurately known to describe the dynamics of nitrous oxide based mixtures.25 A similar impact may be expected for the reactions between NO2 and the oxygen atom.The present work aims at (i) obtaining a chemically consistent rate constant for the reaction between nitrogen dioxide and oxygen atom over a wide range of temperatures, and (ii) understanding the impact of the rate constant update on the prediction of recently established detailed reaction models for combustion applications.
2 Methods and materials
2.1 Rate constant calculation
We performed dynamics calculations for the NO2 + O = NO + O2 reaction using the canonical variational transition-state theory (CVT)26–29 to obtain accurate high-temperature (3000 K > T > 1000 K) rate constants in the high-pressure limit, based on the potential energy surface obtained by the TPSSh30,31 density functional combined with the MG3S32 basis set, which is the same as the 6-311+G(2df,2p) basis set for N and O.We chose the TPSSh/MG3S method for geometry, electronic energy, and frequency calculations because it has the best performance on barrier prediction for this reaction in a variety of Kohn–Sham (KS) model chemistries as compared to high-level benchmark calculations using the composite method W3X-L.33 The tested KS model chemistries are TPSSh/MG3S and the combinations of M08-HX34 and MN1535,36 exchange–correlation functionals with the MG3S and aug-cc-pVTZ37,38 basis sets. The T1 diagnostic39 calculated using the CCSD40,41/MG3S method based on TPSSh/MG3S geometry shows that the transition state of this reaction (T1 = 0.049) has an inherently moderate multi-configurational character, and hence a multi-reference method is needed for accurate barrier prediction. The W3X-L method offers an accurate approximation to the all-electron scalar-relativistic CCSDT(Q)/CBS energy by a combination of valence-electron nonrelativistic CCSD(T)/CBS, core-valence correlation contribution, scalar relativistic effects, and a series of post-CCSD(T) treatments. These post-CCSD(T) terms include the [CCSDT-CCSD(T)] and the [CCSDT(Q)-CCSDT] components to account for higher-order excitation effects, and hence, the W3X-L method can provide accurate electronic energies for the system with a moderate multi-reference character. Using the W3X-L method based on the TPSSh/MG3S geometries, we obtained the best estimation of the forward barrier for the NO2 plus O reaction, which is a negative barrier, −9.83 kJ mol−1. As shown in Table 1, only the TPSSh/MG3S method predicts a negative barrier as the W3X-L method does, with a deviation of only 3.42 kJ mol−1 from the best estimation, which is accurate enough for high-temperature rate constant calculations. The other tested KS model chemistries significantly overestimate the barrier by 19.3–36.5 kJ mol−1. Note that all the barriers discussed here are classical barriers with zero-point-energies (ZPEs) excluded. The calculated high-temperature rate constants are listed in Table S1 of the ESI.†
| V ≠f | UD | |
|---|---|---|
| M08-HX/MG3S | 26.71 | 36.54 |
| M08-HX/aug-cc-pVTZ | 26.67 | 36.50 |
| MN15/MG3S | 9.89 | 19.72 |
| MN15/aug-cc-pVTZ | 9.43 | 19.26 |
| TPSSh/MG3S | −6.41 | 3.42 |
| W3X-L//TPSSh/MG3S | −9.83 | 0 |
We carried out all the density functional calculations using the Gaussian 09 package42 with the MN-GFM43 module and the W3X-L calculations using the Molpro 2015 software package.44 The CVT dynamics calculations were performed using the Polyrate 201645 and Gaussrate 17 programs.46 In the dynamics calculations, ZPEs and partition functions were calculated with the vibrational frequencies scaled by a scaling factor of 0.984.
2.2 Experimental technique
The experimental setup and the method used to obtain new experimental data to study the effect of the inclusion of the new rate constant are presented in this section.Nitrous oxide–argon mixtures were prepared from mono-component gas cylinders containing either N2O or Ar. Nitrogen dioxide–argon mixtures were prepared from a mixture containing 1% of NO2 in pure argon. High purity gases were employed. The partial pressure method was used to prepare the mixtures. The mixture preparation apparatus was vacuumed to less than 1 × 10⁻⁵ Pa using a turbo-molecular pump. The N2O and NO2 contents ranged between 1 and 15 ppmv and between 5 and 40.1 ppmv, respectively. For the NO2–Ar mixtures, the mixture composition as well as its stability under ambient conditions were checked using a Fourier transform infra-red spectrometer. The mixture composition was found to be in good agreement with the expected composition obtained using the partial pressure method, within the uncertainty of the initial NO2–Ar blend. The stability of the mixtures containing nitrous oxide was verified in a previous work by the authors.47
The optical detection technique used for measuring the O atom concentration was an emission line absorption method. A microwave-excited discharge lamp that contained a flowing mixture of 1% O2 in He maintained at a pressure of 1.4 kPa was used as the light source. This lamp consisted of a 2.45 GHz microwave generator operated at the 100 W power level. A vacuum ultraviolet (UV) monochromator was used to isolate the O triplet wavelength, 130.5 nm, and a solar blind photomultiplier was used to convert vacuum UV photons. The operating conditions were chosen to minimize noise and reflected power without significant loss of signal strength. The absorption measurements were made behind a reflected shock front through two thin MgF2 windows located 10 mm from the end wall. Details about the O atoms and nitrogen oxide calibrations are presented hereafter.
For the calibration of oxygen atom measurements, the thermal decomposition of highly Ar-diluted nitrous oxide (N2O) at high temperature was employed. Under these conditions, the decomposition is fast and both recombination and secondary reactions are unimportant so that a constant O atom concentration is achieved. Pyrolysis experiments were performed with mixtures containing 1 to 15 ppmv of N2O in Ar, in the temperature and pressure ranges of 1882–3976 K and 168–555 kPa, respectively. Fig. 1 presents the evolution of the light absorption as a function of the O-atom concentration. The experimental data could be fitted by the following fourth order polynomial:
 | (1) |
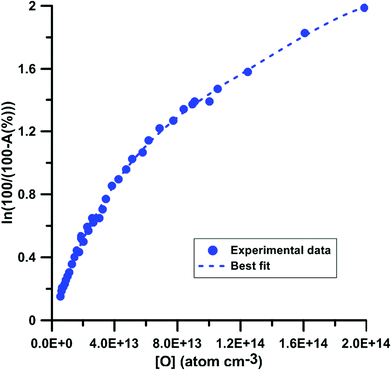 | ||
| Fig. 1 Calibration of absorption by O atoms at 130.5 nm. Experiments were performed using N2O–Ar mixtures. The experimental conditions were XN2O = 1–15 ppmv; T = 1882–3976 K and P = 168–555 kPa. | ||
It was shown previously53–57 in a variety of chemical systems that ARAS measurements could be disturbed by interference absorption by the reactant and/or intermediate species. To account for these perturbations, the absorption cross-sections of NO2 and NO at 130.5 nm were measured over a range of concentrations and thermodynamic conditions. Fig. 2 and 3 display the evolution of the Napierian logarithm of the normalized absorption inverse as a function of concentration for NO2 and NO, respectively. Also shown are the results from Nakayama et al.52 and Watanabe58 respectively for the cross-sections of NO2 and NO. Cross-sections of 10 ± 2 × 10⁻¹⁸ cm2 per molecule for NO2 and of 3.2 ± 0.5 × 10⁻¹⁸ cm2 per molecule for NO were measured. The present measurements and those from the literature, 14 ± 4 × 10⁻¹⁸ cm2 per molecule for NO252 and 3.0 ± 0.3 × 10⁻¹⁸ cm2 per molecule for NO,58 appear to be in agreement within the experimental uncertainties.
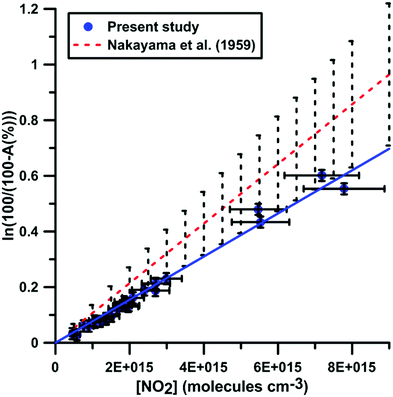 | ||
| Fig. 2 Calibration of absorption by NO2 at 130.5 nm. Experiments were performed using NO2–Ar mixtures. The experimental conditions were XNO2 = 552 ppmv; T = 289–874 K and P = 6.7–178 kPa. The black dashed lines represent the uncertainty bar of the data from ref. 52. | ||
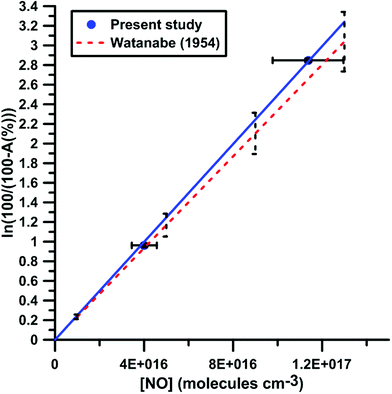 | ||
| Fig. 3 Calibration of absorption by NO at 130.5 nm. Experiments were performed with NO–Ar mixtures. The experimental conditions were XNO = 9960 ppmv; T = 291–901 K and P = 16–142 kPa. The black dashed lines represent the uncertainty bar of the data from ref. 58. | ||
2.3 Combustion modeling
Based on the recent study of Kovacs et al.,59 which evaluated the performance of 16 detailed reaction models against a comprehensive database for H2–O2–NOx mixtures, we have selected the three most reliable reaction models: (i) Glarborg et al.,60 (ii) Nakamura et al.,61 and (iii) Zhang et al.62 For each model, the impact of replacing the original rate constant of the reaction NO2 + O = NO + O2 by the rate constant we calculated has been investigated. The data we employed for assessing this impact include the new data we presently obtained during NO2 pyrolysis, as well as shock tube data3,63,64 from the literature obtained for H2–NO2(–O2) mixtures. We also examined the impact of the rate constant update using jet-stirred data65 obtained for H2–NO–O2 mixtures. For the new data we obtained during NO2 pyrolysis, the interference of NO and NO2 at the absorption wavelength of oxygen atom did not enable us to directly extract reliable oxygen atom concentration. Consequently, we compared the experimental total absorption at 130.5 nm with the calculated one which is obtained by | (2) |
The shock tube data were modeled using the Cantera package66 considering either an adiabatic constant volume or an adiabatic variable-volume reactor model. The variable-volume reactor model was employed when a facility-dependent pressure rise was indicated in the original paper. The jet-stirred reactor data were modeled using the PSR code67 from Chemkin II.68 Since the jet-stirred experiments are performed at a constant pressure, the PLOG formalism included in the selected reaction models does not pose an issue although Chemkin II cannot handle such a formalism. Reaction models which include the rate constant at the correct pressure were created using the PLOG-replace utility, freely available on the website of the Combustion Chemistry Center of Galway.
3 Results and discussion
In this section, we are successively presenting the updated rate constant for the NO2 + O = NO + O2 reaction and its effect on the predictions by three recent reaction models of several fundamental combustion parameters obtained in various mixtures containing NOx. Indeed, when updating a detailed reaction model, it is important to verify that its performances are at least not deteriorated if not significantly improved. In general, the figures were selected to illustrate the most significant effects. Given the large amount of data we modeled, we cannot show systematically the results obtained for the three reaction models. However, we have included additional modeling results in the ESI.†3.1 Rate constant update
We have collected the available rate constant data for the NO2 + O = NO + O2 reaction from the kinetic database of NIST. The studies performed before 1970 were not considered. Fig. 4 shows the available rate constant in an Arrhenius plot along with those obtained in the present study. Most of the studies were performed in the low-temperature range and studies at high temperatures are rather scarce. At low temperature, most experimental studies are consistent with each other with a value of around 6 × 1012 cm3 mol−1 s−1 at 298 K. The CVT rate constants are about two times lower than these experimental data in the low-temperature region. Considering that the CVT calculations are highly sensitive to the accuracy of the potential energy surface at low temperatures but are less affected at high temperatures, we decided to jointly use the experimental low-temperature data and our CVT high-temperature results. Thus, by combining the low-temperature study of Estupiñán et al.21 (221–425 K, see Table S2 of the ESI†) and our high-temperature rate constant calculation (1000–3000 K, see Table S1 of the ESI†), we obtained a complex temperature dependence with a decreasing rate constant as temperature increases up to approximately 1000 K and an increasing rate constant as temperature increases above 1000 K which can be described by | (3) |
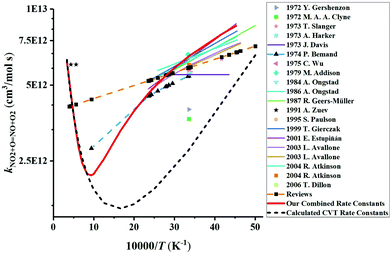 | ||
| Fig. 4 Comparison of the available rate constants for the reaction NO2 + O = NO + O2. Experimental studies: 2006 T. Dillon;69 2001 E. Estupiñán;21 1999 T. Gierczak;70 1995 S. Paulson;20 1991 A. Zuev;17 1987 R. Geers-Müller;71 1986 A. Ongstad;72 1984 A. Ongstad;22 1979 M. Addison;73 1975 C. Wu;74 1974 P. Bemand;24 1973 T. Slanger;18 1973 A. Harker;23 1973 J. Davis;75 1972 Y. Gershenzon;76 1972 M. A. A. Clyne;77 2003 L. Avallone;78 2004 R. Atkinson;79 Reviews.79–85 The calculated CVT rate constants are our dynamics calculation results. The red solid line plots the final rate constants used in the modeling which corresponds to the combined results of the high-temperature CVT data and low-temperature experimental data from Estupiñán et al.21 | ||
Only one theoretical study has been previously performed for the reaction NO2 + O = NO + O2. Fig. 5 compares the rate constant computed by Zhao et al.86 with the one we have calculated. Zhao et al.86 computed the reaction rate constant under the framework of transition state theory (TST) based on the electronic structure calculations using the CCSD/6-311++G**//B3LYP/6-311++G** method, which shows that they corrected the single point energies of key reaction species using the single-reference CCSD/6-311++G** method based on the B3LYP/6-311++G** optimized geometries. However, as we mentioned early, this reaction is a strong electron correlation system, whose wavefunction has a moderate multi-reference character, and thus the single-reference CCSD method will overestimate the reaction barrier. They obtained a positive forward barrier of 16.19 kJ mol−1, which is 22.6 kJ mol−1 higher than the value (−6.41 kJ mol−1) we obtained using the TPSSh/MG3S method and 26.02 kJ mol−1 higher than our best estimate obtained using the W3X-L method. Therefore, Zhao et al. significantly underestimated the rate constants compared to the present calculations and experimental data. For example, the rate constant of 4.29 × 1011 cm3 mol−1 s−1 they obtained at 2300 K is over one order of magnitude lower than our value (4.52 × 1012 cm3 mol−1 s−1) and the experimental value (6.03 × 1012 cm3 mol−1 s−1) obtained by Zuev et al.,17 which are the only available experimental data above 2000 K. Their rate constant at 300 K is 5.06 × 107 cm3 mol−1 s−1, over five orders of magnitude lower than 6 × 1012 cm3 mol−1 s−1 obtained in most experimental studies. More importantly, because of this positive barrier, they predicted a positive temperature dependence of the rate constant at low temperatures, which is in disagreement with the experimental observations.
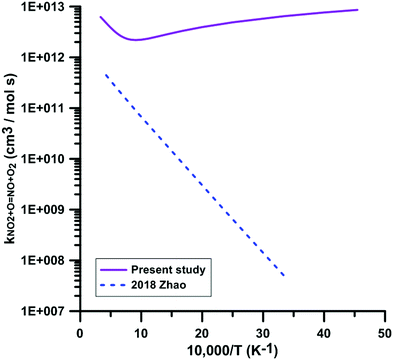 | ||
| Fig. 5 Comparison of the theoretical rate constants for the reaction NO2 + O = NO + O2. 2018 Zhao.86 | ||
Fig. 6 compares the rate constants included in the reaction models of Glarborg, Nakamura, and Zhang, with the one obtained in the present study. The temperature-dependence of the rate constants included in the reaction models is consistent with the experimental data in the low-temperature range. However, in the high-temperature range, the temperature-dependence is opposite to the one we obtained in our calculations. This leads to a discrepancy of as high as 3.6 times between the rate constant we obtained and the rate constant included in Glarborg's model at a temperature of 3000 K. A large discrepancy is also observed between our rate constant and the one included in Zhang's model since at temperatures in the range 800–1300 K, our rate constant is approximately one third that of Zhang's model. The rate constant included in the model of Glarborg et al. corresponds to the rate constant measured by Bemand et al.87 over the temperature range 298–1055 K. The rate constant included in Nakamura's model comes from the rate constant review of Tsang and Herron.84 The rate constant recommended by Tsang and Herron is based on experimental data obtained at low temperatures and it is stated that the temperature dependence of this rate constant must be very low given the large branching ratio between the exchange channel, i.e. NO2 + O = NO + O2, and the addition channel, i.e. NO2 + O = NO3. As seen from the Atkinson et al. review79 and the kinetics database of NIST, the rate constant of the addition channel has been studied only at temperatures below 400 K. An important fall-off behavior was emphasized at atmospheric pressure. At 300 K, the high-pressure limit of the rate constant of the addition channel is approximately twice that of the exchange channel. The rate constant included in the model of Zhang et al. is the rate constant recommend by Tsang and Herron multiplied by 1.5. From this comparison and the examination of the sources of the rate constants included in the models, we conclude that these rate constants are not chemically consistent for the modeling of combustion chemical kinetics.
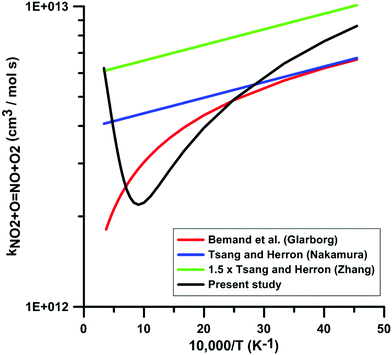 | ||
| Fig. 6 Comparison of the rate constants for the reaction NO2 + O = NO + O2 included in the three selected reaction models with the one derived from combining low-temperature experimental data from the literature21 and new high-temperature quantum calculations. | ||
3.2 Nitrogen dioxide pyrolysis
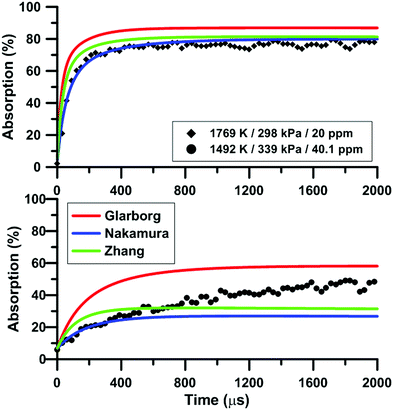
Fig. 7 compares the total absorption profiles during NO2 pyrolysis predicted by the three reaction models we have selected. The experimental profiles are shown as symbols. It is noted that (i) the results shown in Fig. 7 were obtained without any modification of the reaction models; and (ii) the experimental signals were post-treated using a Savitzky–Golay filter to remove some noise.55 At low temperatures, significant discrepancies are observed between the predictions of the models. For example, at 1492 K, the model of Glarborg predicts a total absorption that is twice larger than that of Zhang's model. At high temperatures, the predictions of the models converge although the shape of the profiles can be somehow different during the first part of the experiment.Fig. 8 illustrates the effect of temperature on the total absorption during NO2 pyrolysis. The effect of the update of the rate constant of the reaction NO2 + O = NO + O2 on the predictions of the model of Nakamura is also shown. As temperature increases, faster and faster increase of the total absorption is observed. At the highest temperature, the total absorption rapidly reaches a plateau. Above 2000 K, the total absorption profiles are similar to the one shown in Fig. 8 for T = 2019 K. Overall, the original model of Nakamura under-estimates the rate of increase as well as the long term value of the absorption. On the contrary, the updated model of Nakamura predicts these two features better. At the highest temperature, the effect of the reaction rate update becomes rather weak and the updated reaction model over-estimates the absorption value within the plateauing period. This is due to the lower importance of the reaction NO2 + O = NO + O2 in the high-temperature range. A similar behavior was observed for the model of Zhang whereas for the Glarborg model, the reaction rate constant update has an opposite effect, i.e. it induces a slightly lower rate of increase at early times and lower plateauing value at long times.
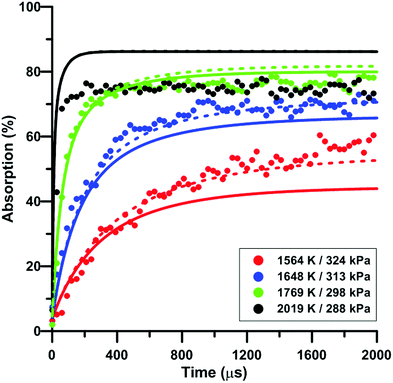 | ||
| Fig. 8 Effect of temperature on the total absorption during NO2–Ar mixture pyrolysis. Solid lines: Nakamura model. Dashed lines: updated Nakamura model. Conditions: XNO2 = 20 ppm. | ||
Fig. 9 illustrates the effect of pressure on the total absorption during NO2 pyrolysis. The effect of the update of the rate constant of the reaction NO2 + O = NO + O2 on the predictions of the model of Zhang is also shown. Similar to the temperature increase, the pressure increase induces a higher rate of total absorption increase at early times and a higher long term plateau. The lower consumption rate of oxygen atom induced by the rate constant update tends to worsen the prediction of the experimental total absorption using the model of Zhang. A similar behavior was observed for the model of Nakamura whereas slightly better predictions were induced by the update in the model of Glarborg.
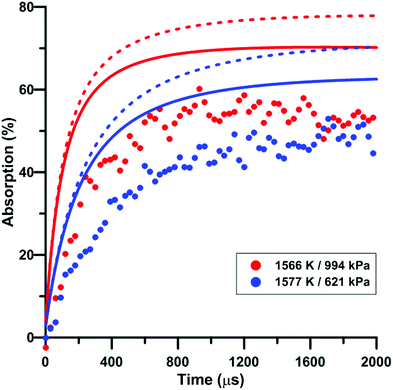 | ||
| Fig. 9 Effect of pressure on the total absorption during NO2–Ar mixture pyrolysis. Solid lines: Zhang model. Dashed lines: updated Zhang model. Conditions: XNO2 = 5 ppm. | ||
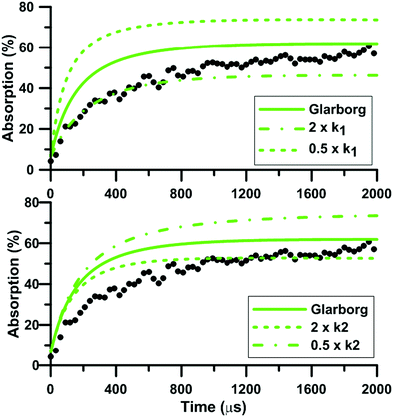
During NO2 pyrolysis, the two most sensitive reactions are R1: NO2(+M) = NO + O(+M) and R2: NO2 + O = NO + O2. Such a behavior is typically observed in ARAS experiments. This is because the reactant decomposition reaction is largely controlling the rate of production of the transient species which are measured.88Fig. 10 shows the effect on the predictions of the updated Glarborg's model of multiplying and dividing the rate constants of R1 and R2 by two. It is seen that both reactions have a strong influence on the predicted total absorption profiles. Reaction (1) controls both the early time rate of increase and the long term value of total absorption. Reaction (2) has more impact on the final plateau value of the total absorption. The impact of the reaction rate constants change is stronger at low temperature, see the ESI.† The fact that both reactions (1) and (2) have strong impact on the absorption profile prevented us from extracting experimentally the rate constant of R2. Nevertheless, our high-accuracy quantum calculation enabled us to propose a consistent rate constant and, overall, improved the predictive capability of the reaction models we have selected under NO2 pyrolysis conditions. It is noted that the rate constants used in the three reaction models for the thermal decomposition of NO2 are not the same. In both Glarborg's and Zhang's models, the reaction is declared in the backward direction, i.e. NO + O + M = NO2 + M, and has a Troe formalism. In the Glarborg's model, the rate parameters for N2 as the third body come from the review of Tsang and Herron84 but a specific expression for the low-pressure limit is employed for Ar as the third body.89 In Zhang's model, the expression recommended by Tsang and Herron is also employed with a collision efficiency for Ar equal to 0.6. The rate constant included in the model of Nakamura is for the forward direction. It is given as a second-order rate constant, and seems to be consistent with the values of Troe14 and of Hiraoka and Hardwich.15 Comparing the low-pressure rate constants in the temperature range 1500–2500 K, the values in Glarborg's and in Zhang's models agree within 9%. As for Nakamura's model, the rate constant for NO2 decomposition is twice lower than the one in Glarborg's model at 1500 K. This discrepancy reduces to 8% at 2500 K.
3.3 Hydrogen oxidation by nitrogen dioxide
We selected experimental shock tube data for H2–NO2–Ar mixtures from the literature63,64 to determine the impact of the update of the rate constant of the reaction NO2 + O = NO + O2 under oxidative conditions. Fig. 11 shows the delay-time predicted by the original and updated models of Zhang. The rate constant update induces a decreased competition for oxygen atom consumption between NO2 + O = NO + O2 and the chain branching reaction O + H2 = OH + H. This leads to an increase of the overall reactivity but does not modify significantly the global activation energy of the oxidation process. It is noted that the rate constants used for the O + H2 = OH + H reaction in the three models are significantly different at temperature below 1500 K but are within 25% at temperatures above 1500 K. Glarborg's model includes the rate constant recommended in the review of Baulch et al.90 whereas both Nakamura's and Zhang's models include the rate constant measured by Sutherland et al.91 These rate constants are in overall agreement with other experimental48 and optimized92 values in the high-temperature range, i.e. T > 1500 K. However, at lower temperatures, significant discrepancies can be observed. Table 2 summarizes the impact of the rate constant update on the predicted delay-times and normalized OH* peak heights. The predictions of the model of Glarborg are the least modified whereas those of the models of Nakamura and Zhang are the most impacted. Overall, the rate constant update tends to improve the predictions of all the reaction models.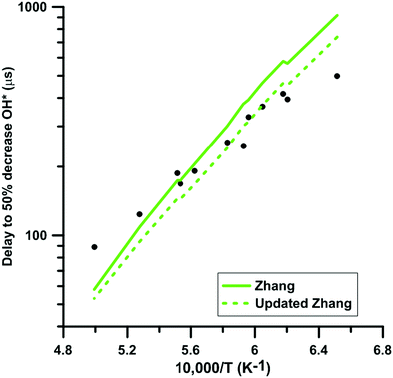 | ||
| Fig. 11 Effect of the rate constant update on the time to half decrease of OH* signal in H2–NO2–Ar mixtures. Conditions: XH2 = 0.222%; XNO2 = 0.392%; P = 105–124 kPa. Experimental data taken from ref. 63. | ||
| Delay OH* | Peak height OH* | Delay H2O | |
|---|---|---|---|
| Glarborg | 25.8 | 42.7 | 24.8 |
| Updated Glarborg | 24.4 | 41.7 | 23.1 |
| Nakamura | 72.5 | 43.3 | 64.6 |
| Updated Nakamura | 60.2 | 40.2 | 58.9 |
| Zhang | 28.9 | 37.6 | 26.8 |
| Updated Zhang | 18.5 | 32.2 | 19.5 |
Fig. 12 shows the influence of the rate constant update on the H2O and OH* temporal profiles predicted by the models of Zhang and of Nakamura, respectively. This figure gives an overview of the models prediction before and after the update of the rate constant for the reaction NO2 + O = NO + O2. In both cases, the overall shape of the profiles is not modified but the reactivity is slightly increased. Again, this change of reactivity is attributed to the decreased competition between NO2 + O = NO + O2 and O + H2 = OH + H.
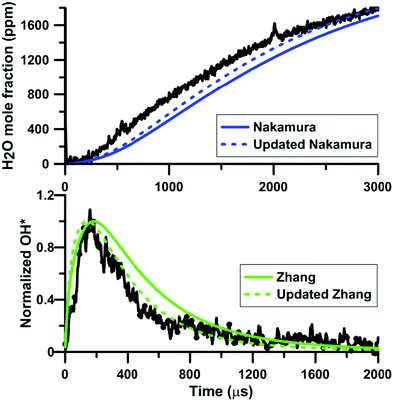 | ||
| Fig. 12 Effect of the rate constant update on the H2O and OH* profiles in H2–NO2–Ar mixtures. Conditions for the top plot: XH2 = 0.222%; XNO2 = 0.375%; T = 1441 K; P = 112 kPa. Conditions for the bottom plot: XH2 = 0.222%; XNO2 = 0.392%; T = 1612 K; P = 123 kPa. Experimental data taken from ref. 63 and 64. | ||
In addition, we have examined the impact of the rate constant update on the sensitivity coefficients on H2O and OH* concentration. The sensitivity coefficient for the ith reaction was defined as Ci = ∂![[thin space (1/6-em)]](https://www.rsc.org/images/entities/char_2009.gif) ln[j]/∂
ln[j]/∂![[thin space (1/6-em)]](https://www.rsc.org/images/entities/char_2009.gif) ln
ln![[thin space (1/6-em)]](https://www.rsc.org/images/entities/char_2009.gif) ki, where [j] is the concentration of the jth chemical species, and ki is the rate constant of the ith reaction. For this analysis, we have employed the model of Zhang whose predictions are the most affected by the update. These results are shown in Fig. 13. It is noted that only the reactions which demonstrate the highest and lowest sensitivity coefficients are shown in Fig. 13. For the sensitivity coefficients of H2O concentration, the values are only slightly affected by the update and no change of sign was observed. The reaction NO2 + O = NO + O2 is not within the 10 most sensitive reactions anymore after the rate constant update is applied. Before the update is applied, the coefficient for this reaction is weakly negative. For OH* concentration, the sensitivity coefficients are not significantly modified by the rate constant update. The reaction NO2 + O = NO + O2 demonstrates an important negative coefficient both before and after the reaction rate constant update.
ki, where [j] is the concentration of the jth chemical species, and ki is the rate constant of the ith reaction. For this analysis, we have employed the model of Zhang whose predictions are the most affected by the update. These results are shown in Fig. 13. It is noted that only the reactions which demonstrate the highest and lowest sensitivity coefficients are shown in Fig. 13. For the sensitivity coefficients of H2O concentration, the values are only slightly affected by the update and no change of sign was observed. The reaction NO2 + O = NO + O2 is not within the 10 most sensitive reactions anymore after the rate constant update is applied. Before the update is applied, the coefficient for this reaction is weakly negative. For OH* concentration, the sensitivity coefficients are not significantly modified by the rate constant update. The reaction NO2 + O = NO + O2 demonstrates an important negative coefficient both before and after the reaction rate constant update.
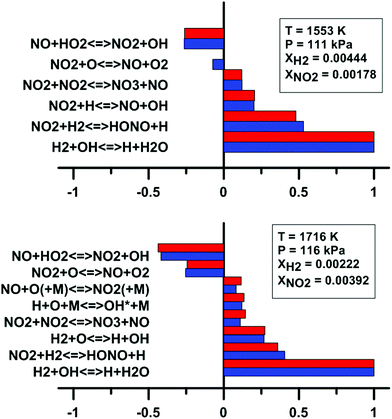 | ||
| Fig. 13 Effect of the rate constant update on the normalized sensitivity coefficients on H2O (top) and OH* (bottom) in H2–NO2–Ar mixtures. Blue: Zhang model. Red: updated Zhang model. Based on experimental conditions taken from ref. 63 and 64. | ||
It is noted that we also examined the effect of the reaction rate constant update on the ignition delay-time obtained by Mathieu et al.3 for H2–O2–NO2–Ar mixtures and on the species profiles obtained by Mueller et al.93 in a flow reactor for H2–NO2–O2–N2 mixtures. No significant changes were observed in the predictions of the three reaction models we have selected.
3.4 Hydrogen oxidation by nitrogen oxide and dioxygen
We have also verify the impact of the update of the rate constant of the reaction NO2 + O = NO + O2 on the modeling of species profile obtained in a jet-stirred reactor by Dagaut and Dayma65 for H2–NO–O2–N2 mixtures. Fig. 14 compares the predicted H2 and H2O profiles of the original and updated models of Zhang. Overall, the simulated profiles were not much modified by the rate constant update although an increased reactivity was observed under some conditions. It is noted that the modifications induced for the models of Glarborg and Nakamura were even smaller than those for the model of Zhang. At 800 K, which is the temperature at which half of the H2 is consumed, the net rate of consumption of H2 and the net production rate of H2O are increased by 11%. It is due to the more than twice lower rate constant for the reaction NO2 + O = NO + O2 in the updated Zhang's model. This induces a reduced competition between NO2 + O = NO + O2 (rate of production is decreased by 53%) and H2 + O = H + OH which is the second contributor to H2 consumption. In addition, the OH production rate is increased and the hydroxyl radical preferentially reacts with H2, H2 + OH = H + H2O, which is the main reaction for H2 consumption and H2O production.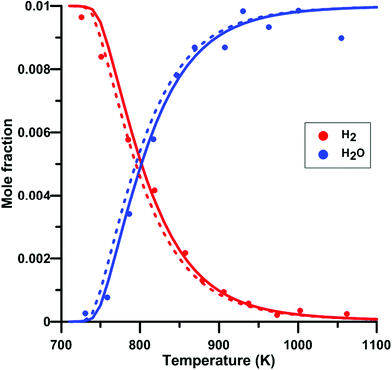 | ||
| Fig. 14 Effect of model update on the H2 and H2O profiles in a H2–NO–O2–N2 mixture in a jet-stirred reactor. Conditions: XH2 = 0.01; XO2 = 0.05; XNO2 = 245 ppm; N2: balance; residence time is 0.24 s; P = 101 kPa. Solid lines: Zhang's model. Dashed lines: updated Zhang model. Experimental data taken from ref. 65. | ||
4 Conclusions
In the present study, low-temperature experimental data from the literature and new high-temperature quantum calculations were combined to obtain a chemically consistent rate constant in the temperature range 221–3000 K for the reaction NO2 + O = NO + O2. The rate constant demonstrates a negative temperature-dependence in the low-temperature range and a positive dependence in the high-temperature range. This is in contrast to the rate constants used in many detailed reaction models in which only a negative temperature-dependence is included. Updating the rate constant of the reaction NO2 + O = NO + O2 in three recent reaction models enables the improvement of their predictive capabilities of the total absorption at 130.5 nm during NO2 pyrolysis. In addition, the predictions for other experimental data obtained for H2–NO2–Ar mixtures were also improved for the three models. In particular, in the low-temperature range of the shock tube data, the predicted ignition delay-times obtained for the updated models were decreased due to the reduced competition between NO2 + O = NO + O2 and H2 + O = OH + H. In the future, the impact of this rate constant update on the prediction of various kinetics targets during the oxidation of hydrocarbon by NO2 should be investigated. We recommend our updated rate constant to be included in existing and future detailed reaction models in order to improve their chemical consistency.Conflicts of interest
The authors have no conflicts to declare.Acknowledgements
This work was partly supported by the National Natural Science Foundation of China (91841301 and 21973053). The numerical part of the present study was performed at Tsinghua University whereas the experimental part was performed at ICARE-CNRS Orléans. The authors are grateful to Pr Guillaume Dayma for his help with the FTIR experiments. The authors also thank Dr Clayton Mulvihill for providing his shock tube data.References
- J. Seinfeld and S. Pandis, Atmospheric chemistry and physics, From air pollution to climate change, John Wiley & Sons, Inc, Canada, 1998, p. 1326 Search PubMed.
- A. Osmont, L. Catoire, I. Gokalp and V. Yang, Combust. Flame, 2007, 151, 262–273 CrossRef CAS.
- O. Mathieu, A. Levacque and E. Petersen, Proc. Combust. Inst., 2013, 34, 633–640 CrossRef CAS.
- M. Slack and A. Grillo, Investigation of hydrogen-air ignition sensitized by nitric dioxide, National aeronautics and space administration technical report, 1977 Search PubMed.
- M. Slack and A. Grillo, Combust. Flame, 1978, 31, 275–283 CrossRef CAS.
- O. Mathieu, J. Pemelton, G. Bourque and E. Petersen, Combust. Flame, 2015, 162, 3053–3070 CrossRef CAS.
- H. Presles, D. Desbordes, M. Guirard and C. Guerraud, Shock Waves, 1996, 6, 111–114 CrossRef.
- F. Joubert, D. Desbordes and H. Presles, Combust. Flame, 2008, 152, 482–495 CrossRef CAS.
- F. Joubert, PhD thesis, Université de Poitiers, 2001.
- D. Davidenko, R. Mével and G. Dupré, Shock Waves, 2011, 21, 85–99 CrossRef.
- W. Tsang and R. Hampson, J. Phys. Chem. Ref. Data, 1986, 15, 1087–1280 CrossRef CAS.
- M. Rohrig, E. L. Petersen, D. F. Davidson and R. K. Hanson, Int. J. Chem. Kinet., 1997, 29, 483–493 CrossRef CAS.
- H. Endo, K. Glaenzer and J. Troe, J. Phys. Chem., 1979, 83, 2083–2090 CrossRef CAS.
- J. Troe, Berichte der Bunsengesellschaft fur physikalische Chemie, 1969, 73, 144–147 CAS.
- H. Hiraoka and R. Hardwick, J. Chem. Phys., 1963, 39, 2361–2365 CrossRef CAS.
- W. A. Rosser and H. Wise, J. Chem. Phys., 1956, 24, 493–494 CrossRef CAS.
- A. Zuev and A. Starikovskii, Khim. Fiz., 1991, 10, 190–199 CAS.
- T. Slanger, B. Wood and G. Black, Int. J. Chem. Kinet., 1973, 5, 615–620 CrossRef CAS.
- F. Kaufman and J. Kelso, Symp. (Int.) Combust., 1958, 7, 53–56 CrossRef.
- S. Paulson, J. Orlando, G. Tyndall and J. Calvert, Int. J. Chem. Kinet., 1995, 27, 997–1008 CrossRef CAS.
- E. Estupiñán;, J. Nicovich and P. Wine, J. Phys. Chem. A, 2001, 105, 9697–9703 CrossRef.
- A. Ongstad and J. Birks, J. Chem. Phys., 1984, 81, 3922 CrossRef CAS.
- A. Harker and H. Johnston, J. Phys. Chem., 1973, 77, 1153–1156 CrossRef CAS.
- P. Bemand, M. Clyne and R. Watson, J. Chem. Soc., Faraday Trans. 2, 1974, 70, 564–576 RSC.
- S. Javoy, R. Mével and C. E. Paillard, Int. J. Chem. Kinet., 2009, 41, 357–375 CrossRef CAS.
- B. Garrett and D. Truhlar, J. Chem. Phys., 1979, 70, 1593–1598 CrossRef CAS.
- B. Garrett and D. Truhlar, J. Chem. Phys., 1979, 83, 1052–1079 CrossRef CAS.
- B. Garrett and D. Truhlar, J. Chem. Phys., 1979, 83, 3058 Search PubMed.
- B. Garrett and D. Truhlar, J. Chem. Phys., 1983, 87, 4553 Search PubMed.
- J. Tao, J. Perdew, V. Staroverov and G. Scuseria, Phys. Rev. Lett., 2003, 91, 146401 CrossRef PubMed.
- J. Perdew, J. Tao, V. Staroverov and G. Scuseria, J. Chem. Phys., 2004, 120, 6898–6911 CrossRef CAS PubMed.
- B. Lynch, Y. Zhao and D. Truhlar, J. Phys. Chem. A, 2003, 107, 1384–1388 CrossRef CAS.
- B. Chan and L. Radom, J. Chem. Theory Comput., 2015, 11, 2109–2119 CrossRef CAS PubMed.
- Y. Zhao and D. Truhlar, J. Chem. Theory Comput., 2008, 4, 1849–1868 CrossRef CAS PubMed.
- H. Yu, X. He, S. Li and D. Truhlar, Chem. Sci., 2016, 7, 5032–5051 RSC.
- H. Yu, X. He, S. Li and D. Truhlar, Chem. Sci., 2016, 7, 6278–6279 RSC.
- T. Dunning, J. Chem. Phys., 1989, 90, 1007–1023 CrossRef CAS.
- R. Kendall, T. Dunning and R. Harrison, J. Chem. Phys., 1992, 96, 6796–6806 CrossRef CAS.
- T. Lee and P. Taylor, Int. J. Quantum Chem., 1989, 36, 199–207 CrossRef.
- P. Knowles, C. Hampel and H. Werner, J. Chem. Phys., 1993, 112, 3106–3107 CrossRef.
- P. Knowles, C. Hampel and H. Werner, J. Chem. Phys., 2000, 99, 5219–5227 CrossRef.
- M. J. Frisch, G. W. Trucks, H. B. Schlegel, G. E. Scuseria, M. A. Robb, J. R. Cheeseman, G. Scalmani, V. Barone, B. Mennucci, G. A. Petersson, H. Nakatsuji, M. Caricato, X. Li, H. P. Hratchian, A. F. Izmaylov, J. Bloino, G. Zheng, J. L. Sonnenberg, M. Hada, M. Ehara, K. Toyota, R. Fukuda, J. Hasegawa, M. Ishida, T. Nakajima, Y. Honda, O. Kitao, H. Nakai, T. Vreven, J. A. Montgomery, Jr., J. E. Peralta, F. Ogliaro, M. Bearpark, J. J. Heyd, E. Brothers, K. N. Kudin, V. N. Staroverov, R. Kobayashi, J. Normand, K. Raghavachari, A. Rendell, J. C. Burant, S. S. Iyengar, J. Tomasi, M. Cossi, N. Rega, J. M. Millam, M. Klene, J. E. Knox, J. B. Cross, V. Bakken, C. Adamo, J. Jaramillo, R. Gomperts, R. E. Stratmann, O. Yazyev, A. J. Austin, R. Cammi, C. Pomelli, J. W. Ochterski, R. L. Martin, K. Morokuma, V. G. Zakrzewski, G. A. Voth, P. Salvador, J. J. Dannenberg, S. Dapprich, A. D. Daniels, Ö. Farkas, J. B. Foresman, J. V. Ortiz, J. Cioslowski and D. J. Fox, Gaussian-09 Revision D.01, Gaussian Inc., Wallingford CT, 2009 Search PubMed.
- Y. Zhao, R. Peverati, K. Yang and D. Truhlar, MN-GFM (Version 6.7), University of Minnesota, Minneapolis, 2011 Search PubMed.
- H. Werner, P. Knowles, G. Knizia, M. Manby, F. R. Schutz, P. Celani, T. Korona, R. Lindh, A. Mitrushenkov, G. Rauhut, K. Shamasundar, T. Adler, R. Amos, A. Bernhardsson, A. Berning, D. Cooper, M. Deegan, A. Dobbyn, F. Eckert, E. Goll, C. Hampel, A. Hesselmann, G. Hetzer, T. Hrenar, G. Jansen, C. Koppl, Y. Liu, A. Lloyd, R. Mata, A. May, S. McNicholas, W. Meyer, M. Mura, A. Nicklass, D. P. O'Neill, P. Palmieri, D. Peng, K. Pfluger, R. Pitzer, M. Reiher, T. Shiozaki, H. Stoll, A. Stone, R. Tarroni, T. Thorsteinsson and M. Wang, Molpro (Version 2015.1), University of Birmingham, Birmingham, 2015 Search PubMed.
- J. Zheng, R. Meana-Paneda, S. Zhang, B. Lynch, J. Corchado, Y.-Y. Chuang, P. Fast, W.-P. Hu, Y.-P. Liu, G. Lynch, K. Nguyen, C. F. Jackels, A. Ramos, B. Ellingson, V. Melissas, J. Villa, I. Rossi, E. Coitino, J. Pu and T. V. Albu, Polyrate (Version 2016), University of Minnesota, Minneapolis, 2016 Search PubMed.
- J. Zheng, J. Bao, A. Zhang, J. Corchado, R. Meana-Paneda, Y.-Y. Chuang, E. Coitino, B. Ellingson and D. Truhlar, Gaussrate (Version 17-B), University of Minnesota, Minneapolis, 2016 Search PubMed.
- R. Mével, PhD thesis, Université d’Orléans, 2009.
- S. Javoy, V. Naudet, S. Abid and C. Paillard, Int. J. Chem. Kinet., 2000, 32, 686–695 CrossRef.
- S. Javoy, V. V. Naudet, S. Abid and C. Paillard, Exp. Therm. Fluid Sci., 2003, 27, 371–377 CrossRef CAS.
- R. Mitchell and R. Kee, SHOCK: a general purpose computer code for predicting chemical kinetic behavior behind incident and reflected shocks, Sandia National Laboratories Technical Report 82-8205, 1982.
- K. Roy, PhD thesis, University of Stuttgart, 1999.
- T. Nakayama, M. Kitamura and K. Watanabe, J. Chem. Phys., 1959, 30, 1180–1186 CrossRef CAS.
- R. Mével, S. Javoy and G. Dupré, Proc. Combust. Inst., 2011, 33, 485–492 CrossRef.
- S. Javoy, R. Mével and G. Dupré, Chem. Phys. Lett., 2010, 500, 223–228 CrossRef CAS.
- R. Mével, L. Catoire, M. Fikri and P. Roth, Chem. Phys. Lett., 2013, 561-562, 31–35 CrossRef.
- L. Catoire, R. Mével, A. Kunz and P. Roth, Proc. Combust. Inst., 2011, 33, 477–484 CrossRef CAS.
- L. Catoire, D. Woiki and P. Roth, Int. J. Chem. Kinet., 1997, 29, 469–472 CrossRef CAS.
- K. Watanabe, J. Chem. Phys., 1954, 22, 1564–1570 CrossRef CAS.
- M. Kovacs, M. Papp, I. Zsely and T. Turanyi, Fuel, 2020, 264, 116720 CrossRef CAS.
- P. Glarborg, J. Miller, B. Ruscic and S. Klippenstein, Prog. Energy Combust. Sci., 2018, 67, 31–68 CrossRef.
- H. Nakamura, S. Hasegawa and T. Tezuka, Combust. Flame, 2017, 185, 16–27 CrossRef CAS.
- Y. Zhang, O. Mathieu, E. Petersen, G. Bourque and H. Curran, Combust. Flame, 2017, 182, 122–141 CrossRef CAS.
- C. Mulvihill and E. Petersen, Combust. Flame, 2020, 213, 291–301 CrossRef CAS.
- C. Mulvihill, O. Mathieu and E. Petersen, Int. J. Chem. Kinet., 2019, 51, 669–678 CrossRef CAS.
- P. Dagaut and G. Dayma, Combust. Sci. Technol., 2006, 178, 1999–2024 CrossRef.
- D. Goodwin, H. Moffat and R. Speth, Cantera: An Object-oriented Software Toolkit for Chemical Kinetics, Thermodynamics, and Transport Processes, http://www.cantera.org, 2015, Version 2.2.0.
- P. Glaborg, R. Kee, J. Grcar and A. Miller, PSR: A FORTRAN program for modeling well-stirred reactors, Sandia International Laboratories Technical Report Sand86-8209, 1990.
- R. Kee, J. Grcar, M. Smooke and J. Miller, A fortran program for modelling steady laminar one-dimensional premixed flames, Sandia International Laboratories Technical Report SAND85-8240, 1993.
- T. Dillon, M. Blitz and D. Heard, J. Phys. Chem. A, 2006, 110, 6995–7002 CrossRef CAS PubMed.
- T. Gierczak, J. B. Burkholder and A. R. Ravishankara, J. Phys. Chem. A, 1999, 103, 877–883 CrossRef CAS.
- R. Geers-Müller and F. Stuhl, Chem. Phys. Lett., 1987, 135, 263–268 CrossRef.
- A. Ongstad and J. Birks, J. Chem. Phys., 1986, 85, 3359 CrossRef CAS.
- M. Addison, R. Donovan and J. Garraway, Faraday Discuss. Chem. Soc., 1979, 67, 286–296 RSC.
- C. Wu and H. Niki, Environ. Sci. Technol., 1975, 9, 46–52 CrossRef CAS.
- J. Davis, D. D. Herron and R. Huie, J. Chem. Phys., 1973, 58, 530 CrossRef.
- Y. Gershenzon, A. Dement'ev and F. Moin, Bull. Acad. Sci. USSR, Div. Chem. Sci., 1972, 21, 570–571 CrossRef.
- M. A. A. Clyne and H. W. Cruse, J. Chem. Soc., Faraday Trans. 2, 1972, 68, 1281–1299 RSC.
- L. Avallone, J. Photochem. Photobiol., A, 2003, 157, 231–236 CrossRef CAS.
- R. Atkinson, D. Baulch, R. Cox, J. Crowley, R. Hampson, R. Hynes, M. Jenkin, M. Rossi and J. Troe, Atmos. Chem. Phys., 2004, 4, 1461–1738 CrossRef CAS.
- W. DeMore, S. Sander, D. Golden, R. Hampson, M. Kurylo, C. Howard, A. Ravishankara, C. Kolb and M. Molina, Chemical kinetics and photochemical data for use in stratospheric modeling. Evaluation number 12, JPL Technical Report 97-4, 1997.
- R. Atkinson, D. Baulch, R. Cox, R. Hampson, J. Kerr, M. Rossi and J. Troe, J. Phys. Chem. Ref. Data, 1997, 26, 1329–1499 CrossRef CAS.
- W. DeMore, S. Sander, D. Golden, R. Hampson, M. Kurylo, C. Howard, A. Ravishankara, C. Kolb and M. Molina, Chemical kinetic and photochemical data for use in stratospheric modeling: Evaluation No. 11 of the NASA panel for data evaluation, JPL Technical Report 94-26, 1994.
- R. Atkinson, D. Baulch, R. Cox, R. Hampson Jr., J. Kerr and J. Troe, J. Phys. Chem. Ref. Data, 1992, 21, 1125–1568 CrossRef CAS.
- W. Tsang and J. Herron, J. Phys. Chem. Ref. Data, 1991, 20, 609–663 CrossRef CAS.
- R. Atkinson, D. Baulch, R. Cox, R. Hampson, J. Kerr and J. Troe, J. Phys. Chem. Ref. Data, 1989, 18, 881–1097 CrossRef CAS.
- R. Zhao, D. Gao, X. Pan, W. Xia, H. Yu, S. Yu and L. Yao, Chem. Phys. Lett., 2018, 703, 97–105 CrossRef CAS.
- P. Bemand, M. Clyne and R. Watson, J. Chem. Soc., Faraday Trans. 2, 1974, 70, 564–576 RSC.
- T. Bentz, M. Szori, B. Viskolcz and M. Olzmann, Z. Phys. Chem., 2011, 225, 1117–1128 CrossRef CAS.
- G. Yarwood, J. Sutherland, M. Wickramaaratchi and R. Klemm, J. Phys. Chem., 1991, 95, 8771–8775 CrossRef CAS.
- D. L. Baulch, C. T. Bowman, C. J. Cobos, R. A. Cox, T. Just, J. A. Kerr, M. J. Pilling, D. Stocker, J. Troe, W. Tsang, R. W. Walker and J. Warnatz, J. Phys. Chem. Ref. Data, 2005, 34, 757–1397 CrossRef CAS.
- J. Sutherland, J. Michael, A. Pirraglia, F. Nesbitt and R. Klemm, Proc. Combust. Inst., 1988, 21, 929–941 CrossRef.
- T. Varga, C. Olm, T. Nagy, I. Zsely, E. Valko, R. Palvolgyi, H. Curran and T. Turanyi, Int. J. Chem. Kinet., 2016, 48, 407–422 CrossRef CAS PubMed.
- M. Mueller, R. Yetter and F. Dryer, Int. J. Chem. Kinet., 1999, 31, 704–724 Search PubMed.
Footnote |
| † Electronic supplementary information (ESI) available: Tables containing the calculated and experimental rates used to obtain the rate constant in the Arrhenius form. Additional modeling results. See DOI: 10.1039/d0cp05131d |
| This journal is © the Owner Societies 2021 |

