ESIPT fluorophores derived from 2,3-dichloro-5,6-dicyano-p-benzoquinone based carbon dots for dual emission and multiple anti-counterfeiting†
Futao
He†
a,
Hai-Bei
Li‡
 b,
Hao
Xu
 a,
Jing
Bai
a,
Yanyan
Cheng
a,
Xianrui
Meng
a,
Wenkai
Zhang
a,
Jing
Bai
a,
Yanyan
Cheng
a,
Xianrui
Meng
a,
Wenkai
Zhang
 *a,
Xiaomin
Fang
 *a,
Yuanqing
Xu
a and
Tao
Ding
a
aInstitute of Functional Organic Molecular Engineering, Henan Engineering Laboratory of Flame-Retardant and Functional Materials, College of Chemistry and Chemical Engineering, Henan University, Kaifeng 475004, China. E-mail: zhangwenkai@henu.edu.cn; xmfang@henu.edu.cn; Tel: +86-0531-2388-1589
bSchool of Ocean, Shandong University, Weihai 264209, China
First published on 26th November 2020
Abstract
Fluorophores and hydrogen bonding interactions play key roles in the fluorescence properties of bottom-up carbon dots. In this work, an excited-state intramolecular proton-transfer (ESIPT) active fluorophore, 5-chloro-6-ethoxy-4,7-dihydroxyisoindoline-1,3-dione (CEDD) and a non-ESIPT 7-cyano-5,8-dihydroxyquinoxaline-6-carboxamide (CDQC) are extracted from 2,3-dichloro-5,6-dicyano-p-benzoquinone (DDQ) based carbon dots. The enol form of CEDD shows a weak blue, small Stokes shift and short lifetime emission under the aprotic or alkali conditions, but the keto form exhibits a strong green, large Stokes shift and long lifetime emission in a protic or an acidic environment. Due to the lack of the ESIPT process, CDQC has no dual emission characteristics, but shows efficient solid-state emission. By virtue of the ESIPT ability of CEDD, multiple anti-counterfeiting methods are achieved by using hydrogen chloride, ammonia, and fluorescence lifetime imaging, as well as dimethyl sulfoxide as the encryption/decryption tools.
Introduction
In the past several years, a growing number of research studies reveal that the fluorescence of bottom-up carbon dots (CDs) is associated with many emissive species: fluorophores, supramolecules or aggregates, polymers, and carbon cores.1–6 Particularly, a series of molecular fluorophores are frequently separated during synthesis and considered as main emission origins of CDs.7–16 For instance, pyrodine compounds have been separated and identified from carbon dots based on citric acid and beta amines.17 These fluorophores not only carry similar optical properties to the as-prepared CDs, but also combine together to form supramolecular aggregates and even nanocrystals via hydrogen bonding.18,19 Khan et al. found that the molecular fluorophores generated during CD synthesis underwent drying mediated hydrogen-bonded crystalline aggregation to show carbon dot-like microstructures.20 Zhang et al. concluded that the hydrogen bond effect between CDs and solvents was the main mechanism leading to the red emission of carbon dots.21 Liu et al. demonstrated hydrogen-bonding-induced emission with a large Stokes shift in phenylenediamine based carbon dots.22 Our group found that molecular fluorophores could link together through hydrogen bonds, producing a dimer, a trimer, and a star-shaped supramolecule.4 Furthermore, the regulation of hydrogen bonding interactions between CDs can benefit energy (or charge) transfer,23 generate a new bandgap,24 solvatochromism19–21 and concentration dependent full-color fluorescence.25–28As a hydrogen-bonded system, an excited-state intramolecular proton-transfer (ESIPT) chromophore has many optical properties that have been ever observed in carbon dots, including a large Stokes shift (over 100 nm),29,30 dual emission, an ultrafast process,31,32 and spectral sensitivity to the surrounding medium. The pre-requisite for ESIPT is the presence of an intramolecular hydrogen bond (H-bond) between the proton donor (–OH and –NH2) and the proton acceptor (![[double bond, length as m-dash]](https://www.rsc.org/images/entities/char_e001.gif) N– and –C
N– and –C![[double bond, length as m-dash]](https://www.rsc.org/images/entities/char_e001.gif) O) groups in close proximity to each other in a molecule.33–37 Most of the ESIPT chromophores show dual emission, short wavelength emission due to the excited state enol form (E*) (normal emission) and the longer one due to the excited state keto form (K*) (ESIPT emission) through a four-level photocycle.38–41 However, to the best of our knowledge, the clear molecular mechanism for the ESIPT process has still not been reported for the previous CDs.
O) groups in close proximity to each other in a molecule.33–37 Most of the ESIPT chromophores show dual emission, short wavelength emission due to the excited state enol form (E*) (normal emission) and the longer one due to the excited state keto form (K*) (ESIPT emission) through a four-level photocycle.38–41 However, to the best of our knowledge, the clear molecular mechanism for the ESIPT process has still not been reported for the previous CDs.
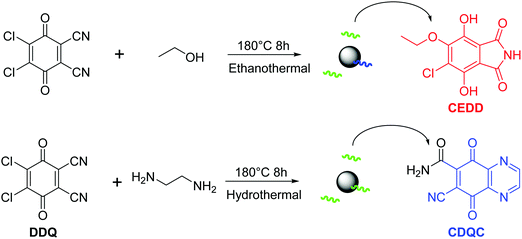
Herein, we have for the first time exploited the ESIPT fluorophores from 2,3-dichloro-5,6-dicyano-p-benzoquinone (DDQ) based CDs. The CDs are synthesized by solvothermal DDQ in the presence of ethanol or ethylenediamine (EDA), then the molecular fluorophores and carbogenic dots are further obtained by chormatography separation and dialysis, respectively (Scheme 1). Two fluorophores, 5-chloro-6-ethoxy-4,7-dihydroxyisoindoline-1,3-dione (CEDD) and 7-cyano-5,8-dihydroxyquinoxaline-6-carboxamide (CDQC), are proposed to be responsible for the strong emission in DDQ-based CDs. Borrowing the ESIPT process, the CEDD molecules exhibit dual emission that can be regulated by solvent polarity and solution pH. While CDQC exhibits no ESIPT induced dual emission due to the lack of an intramolecular hydrogen bond in its strucuture. It is also demonstrated that the ESIPT fluorophores provide a novel platform for anti-counterfeiting by their photoswitching properties in response to chloric acid, ammonia and dimethyl sulfoxide treatment. Although this work mainly focuses on molecular fluorophores in bottom-up carbon dots, their carbogenic counterparts have also been discussed.
Experimental section
Chemicals
2,3-Dichloro-5,6-dicyano-p-benzoquinone (DDQ), ethylenediamine (EDA) and ethanol were purchased from the Sinopharm Chemical Reagent Co., Ltd. The solvents, hydrochloric acid and other reagents were of analytical grade.Synthesis of carbon dots
Typically, 91 mg (0.4 mmol) of DDQ was dissolved in 20 mL of ethanol. After ultrasonic mixing, the reactant was transferred to a 25 mL Teflon autoclave and subjected to solvothermal treatment at 180 °C for 8 h. Then, the autoclave was cooled down to room temperature naturally, and the crude ethanol-doped carbon dots (named as C-Dots1) were obtained.For EDA assisted synthesis, 45 mg (0.2 mmol) of DDQ and 13 μL (0.2 mmol) of EDA were dissolved in 10 mL of water and subjected to solvothermal treatment at 180 °C for 8 h. The products were named as C-Dots2.
Extraction of CEDD
The crude C-Dots1 solution (1 mg mL−1) was filtered with a membrane filter (pore size, 0.22 μm; thickness, 150 μm) to a 10 mL test tube. Complete separation and isolation of small molecular species from the crude carbon dot solution are conducted on a preparative liquid chromatography system (LC system with P600 pumps, a UV600 detector and Labtech HPLC workstation operating software, LabTech Corp., Beijing) equipped with preparative column C18 (250 mm × 50 mm i.d., 30 μm) (Interchim, France) with a 30 mm × 10 mm i.d. guard column of the same material under the following gradient system: (t [min], % A, % B), (0, 15, 85), (30, 20, 80), (180, 30, 70). The mobile phases were: A-methanol and B-deionized water. The injection volume was 10 mL and the flow rate was 2.5 mL min−1. Detection was performed at 254 nm with a PDA UV detector; column temp. 25 °C. The green solution was collected and refreeze dried to get the solid powder of CEDD (totally ∼10 mg for 20 reactions and the yield is estimated to be ∼0.5%).Extraction of CDQC
The crude C-Dots2 solution was first filtered using a membrane filter and then subjected to silica gel column chromatography by using the methanol and ethyl acetate (1![[thin space (1/6-em)]](https://www.rsc.org/images/entities/char_2009.gif) :
:![[thin space (1/6-em)]](https://www.rsc.org/images/entities/char_2009.gif) 30–1
30–1![[thin space (1/6-em)]](https://www.rsc.org/images/entities/char_2009.gif) :
:![[thin space (1/6-em)]](https://www.rsc.org/images/entities/char_2009.gif) 5, v
5, v![[thin space (1/6-em)]](https://www.rsc.org/images/entities/char_2009.gif) :
:![[thin space (1/6-em)]](https://www.rsc.org/images/entities/char_2009.gif) v) as eluents. To enhance the separation efficiency, the green solution was further separated with thin layer chromatography (TLC) by using pure ethyl acetate as the eluent. Then, the green band on the TLC plate was collected and sent to the preparative LC system, on which the mobile phase was methanol–water (1/4, v/v). The final purified sample was refreeze dried to get the solid powder (totally ∼15 mg for 12 reactions and the yield is estimated to be ∼2.7%).
v) as eluents. To enhance the separation efficiency, the green solution was further separated with thin layer chromatography (TLC) by using pure ethyl acetate as the eluent. Then, the green band on the TLC plate was collected and sent to the preparative LC system, on which the mobile phase was methanol–water (1/4, v/v). The final purified sample was refreeze dried to get the solid powder (totally ∼15 mg for 12 reactions and the yield is estimated to be ∼2.7%).
Purification of carbogenic dots
C-Dots1 or C-Dots2 crude solutions were transferred to a dialysis bag (Spectra/Por cut off ∼7000 Da), then placed in beakers each filled with 1000 mL of deionized water and left for separation. Solution outside dialysis bags (containing molecular fractions) was exchanged with fresh water every day until complete removal of small molecular fluorescent compounds from the dialysis bags (∼5 days of separation turn out sufficient after visual testing under UV light). For fractions which remained in dialysis bags after five days of separation, these were freeze-dried using the same conditions as those used for the molecular solid.Characterization
1H and 13C NMR analyses were carried out on Avance III HD 400 MHz (Bruker) in methanol-d4. High-performance liquid chromatography-mass spectrometry (HPLC-MS) analysis was performed on an AmaZon SL HPLC system (Bruker Daltonik GmbH, Bremen) equipped with a photodiode-array detector (PDA) and an electrospray ionization-mass spectrometer (ESI-MS). High-resolution mass spectra (HRMS) were acquired using the AB Sciex QTOF 4600 (AB SCIEX Corporation, USA), coupled to a TOF mass spectrometer (electrospray ionization mode ESI). Transmission electron microscopy (TEM) measurements were performed using a JEM-2100 instrument with an operating voltage of 120 kV. The atomic force microscopy (AFM) images were obtained with Dimension Icon (Bruker Instruments Inc.). For AFM image acquisition, the sample solution was dropped on the mica surface and dried at room temperature. Raman spectra were obtained using a Renishaw RW1000 (Renishaw, Wotton-under-Edge, UK) confocal microscope with the 532 nm line of an argon-ion laser as the exciting light. The X-ray diffraction analysis of the samples was carried out using a Bruker D8 Advance X-ray diffractometer (30 kV, 20 mA) with a copper target (1.54 Å). Fourier transform infrared spectroscopy (FT-IR) characterization was carried out on a Bruker Vertex 70 FTIR spectrometer. UV-vis absorption spectra were recorded with a Hitachi U4100 Spectrometer. The fluorescence spectra and fluorescence lifetime as well as the absolute quantum yields (QYs) were measured with a FLS980 spectrophotometer.Theoretical simulations
The time-dependent density functional theory (DFT) method was used to calculate the excited states.42 The hybrid functional B3LYP/6-311++G(d,p) basis set is applied to optimize the geometry of the fluorophores. All calculations were carried out using the Gaussian 09 package. The solvent effect (methanol) was considered with the polarizable continuum model.Results and discussion
Fluorophore characterization
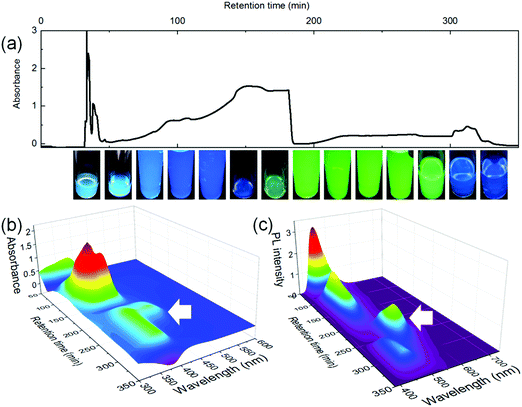
Two green carbon dots, including C-Dots1 and C-Dots2, are prepared by a hydrothermal reaction of 2,3-dichloro-5,6-dicyano-p-benzoquinone (DDQ) with ethanol and ethylenediamine, respectively. Various color bands in C-Dots2 can be easily eluted using silica gel column chromatography, while the C-Dots1 has to be separated using the combination of the silica gel column and preparative liquid chromatography due to the high polarity nature of the concomitant molecular fluorophores. The liquid chromatography of the filtered C-Dots1 solutions shows a series of color bands with different retention times, indicating that they contain various kinds of molecular fluorophores (Fig. 1a). The cyan fractions are obtained before 50 min with a sharp chromatography peak, and followed by a pure blue fraction with a broad retention time range (50–200 min). At around 200 min, the green fraction starts to elute and ends at around 250 min. After that, the weak blue fraction elutes again. The absorption (Fig. 1b) and fluorescence (Fig. 1c) for the blue species (<50 min, 50–200 min, and >300 min) have similar profiles, showing the absorption peaks at 380 nm and fluorescence peaks (under 365 nm excitation) at 440 nm. While the green fractions show a long wavelength absorption peak at 430 nm and a fluorescence peak at 510 nm. Only the green fractions of the C-Dots1 solution have been collected and used for NMR and LC-ESI-MS analyses.The 1H NMR and 13C NMR (in methanol-d4) further identify their structures. For the fluorophores in C-Dots1, the characteristic resonance peaks appear at δ ∼ 3.5 ppm (quartet) and δ ∼ 1.1 ppm (triplet) with the proton ratios (indicated by the integrated peak intensities) of 2![[thin space (1/6-em)]](https://www.rsc.org/images/entities/char_2009.gif) :
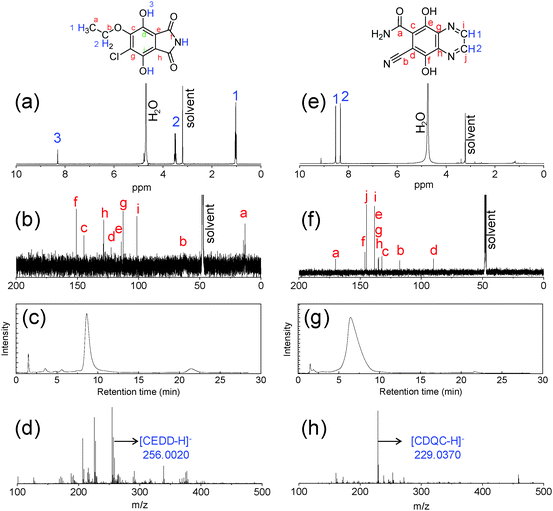
:![[thin space (1/6-em)]](https://www.rsc.org/images/entities/char_2009.gif) 3 (Fig. 2a and Fig. S1, ESI†), which should correspond, respectively, to –CH2 and –CH3 in –OCH2CH3. This is supported by the FT-IR measurement (Fig. S2, ESI†). The strong absorption at 1050–1090 cm−1 indicates the existence of C–O, and the bands between 1380 cm−1 and 1450 cm−1 are due to alkyl C–H bending, while the region of 1640–1522 cm−1 is due to carbon–carbon stretching vibrations in the aromatic ring. The 13C NMR spectrum shows seven peaks for aromatic carbons in the range of 100–160 ppm, and one aliphatic carbon peak at 14.5 ppm (Fig. 2b). Considering possible reaction routes for DDQ and ethanol, we suppose that an asymmetric and diethoxy-substituted compound, 5-chloro-6-ethoxy-4,7-dihydroxyisoindoline-1,3-dione, abbreviated as CEDD, is the main molecular structure of the fluorophore, which has a chemical formula of C10H8ClNO5 with the exact mass of 257.0091. LC-HRMS analyses in negative mode for the fraction of retention time t = 8.6 min show the presence of an ion with m/z 256.0020 (Fig. 2c, d and Fig. S3, ESI†), which suggests the existence of CEDD. The possible mechanism of CEDD formation from DDQ and ethanol is presented in Scheme S1 (ESI†). Nucleophilic substitution of ethanol occurs first on one of the C–Cl sites of the DDQ ring, followed by benzoimide formation by intermolecular cyanide hydrolysis and condensation, and finally quinones are reduced to phenols in the presence of ethanol.
3 (Fig. 2a and Fig. S1, ESI†), which should correspond, respectively, to –CH2 and –CH3 in –OCH2CH3. This is supported by the FT-IR measurement (Fig. S2, ESI†). The strong absorption at 1050–1090 cm−1 indicates the existence of C–O, and the bands between 1380 cm−1 and 1450 cm−1 are due to alkyl C–H bending, while the region of 1640–1522 cm−1 is due to carbon–carbon stretching vibrations in the aromatic ring. The 13C NMR spectrum shows seven peaks for aromatic carbons in the range of 100–160 ppm, and one aliphatic carbon peak at 14.5 ppm (Fig. 2b). Considering possible reaction routes for DDQ and ethanol, we suppose that an asymmetric and diethoxy-substituted compound, 5-chloro-6-ethoxy-4,7-dihydroxyisoindoline-1,3-dione, abbreviated as CEDD, is the main molecular structure of the fluorophore, which has a chemical formula of C10H8ClNO5 with the exact mass of 257.0091. LC-HRMS analyses in negative mode for the fraction of retention time t = 8.6 min show the presence of an ion with m/z 256.0020 (Fig. 2c, d and Fig. S3, ESI†), which suggests the existence of CEDD. The possible mechanism of CEDD formation from DDQ and ethanol is presented in Scheme S1 (ESI†). Nucleophilic substitution of ethanol occurs first on one of the C–Cl sites of the DDQ ring, followed by benzoimide formation by intermolecular cyanide hydrolysis and condensation, and finally quinones are reduced to phenols in the presence of ethanol.
Following similar steps, the extracted fluorophores from the C-Dots2 solution have also been analyzed and suggested to be 7-cyano-5,8-dihydroxyquinoxaline-6-carboxamide (CDQC) with a molecular formula of C10H6N4O3 and an exact mass of 230.0440 (Fig. 2e–h). We note that EDA not only replaces two chloro moieties on DDQ but also forms a pyrazine ring (Scheme S1, ESI†), which makes CDQC much more stable than CEDD. The fact that EDA is consumed to form an aromatic ring can be supported by the lack of aliphatic hydrogen and carbon in both 1H NMR and 13C NMR (Fig. 2e and f), while the carbonyl carbon appears at 171 ppm. Similar to CEDD, a single chromatography peak of CDQC is eluted (Fig. 2g). In the negative mode, the molecular ion peak of CDQC (m/z 229.0370, supposed to be of [(CDQC)–H]−) is found in the HRMS spectra (Fig. 2h and Fig. S4, ESI†).
Morphologies
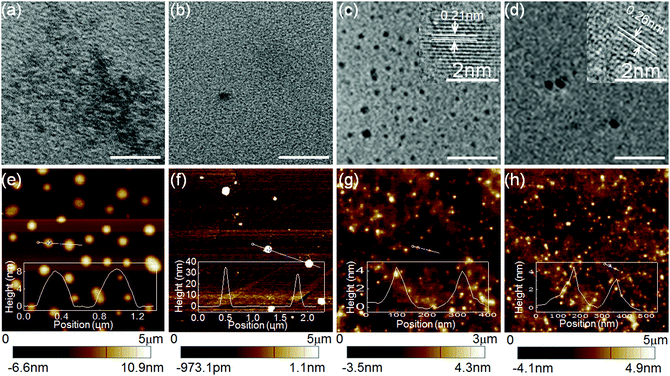
Due to the organic molecular nature, both CEDD and CDQC provide no indications of “carbon” dots in their TEM images, only showing very low mass-thickness contrast (Fig. 3a and b). While the purified C-Dots1 and C-Dots2, which have undergone rigorous dialysis to remove molecular fluorophores, show clear carbogenic domains with a great mass-thickness contrast (Fig. 3c and d). The C-Dots1 and C-Dots2 have relatively uniform size distributions with the average values of 9 nm and 5 nm, respectively. Lattice parameters of 0.21 nm and 0.26 nm correspond to the (100) and (200) facets of carbon crystals. However, the nanodot morphologies can be found in all the AFM images for both molecular fluorophores (CEDD and CDQC) and carbogenic dots (C-Dots1 and C-Dots2) (Fig. 3e–h). The average heights of CEDD (6–10 nm) and CDQC (1.5–35 nm) dots are much larger than those of C-Dots1 (6–9 nm) and C-Dots2 (5–12 nm). The Raman spectra in Fig. S5a (ESI†) show typical characteristics of carbon materials for both C-Dots1 and C-Dots2, where the D band and G band are located at 1368 cm−1 and 1580 cm−1, respectively. X-ray diffraction patterns also exhibit a broad peak at 21° and a minor sharp peak at 26.6° (Fig. S5b, ESI†), which are attributed to the graphitic structure with an interlayer spacing (002). FT-IR spectra show that many moieties, including O–H, C![[double bond, length as m-dash]](https://www.rsc.org/images/entities/char_e001.gif) O, C
O, C![[double bond, length as m-dash]](https://www.rsc.org/images/entities/char_e001.gif) C, and C–O, are present in the carbogenic nanodots (Fig. S5c, ESI†).
C, and C–O, are present in the carbogenic nanodots (Fig. S5c, ESI†).
The dual emission
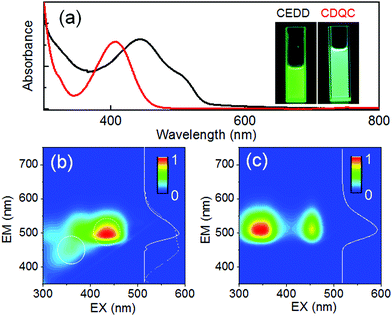
As shown in Fig. 4a, the spectra of CEDD have the main absorption band at 445 nm and a long-wavelength shoulder at 505 nm, while the absorption spectra of CDQC show a single main peak at 415 nm. The two-dimensional photoluminescence-excitation (2D PLE) contour map of CEDD is asymmetrical, or excitation wavelength dependent. Dual emission centered at 450 nm and 500 nm can be excited by 350 nm and 430 nm light, respectively (Fig. 4b). The origins of the two emissions are reasonably interpreted to be the S0 ← S1 transitions of the enol and keto tautomers, respectively, because CEDD incorporates an intramolecular hydrogen bonding interaction between a hydrogen bond donor (–OH in phenol) and a hydrogen bond acceptor (C![[double bond, length as m-dash]](https://www.rsc.org/images/entities/char_e001.gif) O in amide). Unlike CEDD, the phenol protons in CDQC are hardly transferred to the adjacent nitrogen on the pyrazine ring, so the 2D PLE map shows two homogeneous and symmetrical areas (Fig. 4c), where the PL emission maximum is located at 500 nm and is independent of the excitation wavelengths. However, both CEDD and CDQC exhibit very close emission peaks at 510 nm when they are excited by 450 nm light, as well as high PL quantum yields (86% and 63%, respectively). This provides the convenience for optical encryption by arbitrarily weaving them in a single pixel.
O in amide). Unlike CEDD, the phenol protons in CDQC are hardly transferred to the adjacent nitrogen on the pyrazine ring, so the 2D PLE map shows two homogeneous and symmetrical areas (Fig. 4c), where the PL emission maximum is located at 500 nm and is independent of the excitation wavelengths. However, both CEDD and CDQC exhibit very close emission peaks at 510 nm when they are excited by 450 nm light, as well as high PL quantum yields (86% and 63%, respectively). This provides the convenience for optical encryption by arbitrarily weaving them in a single pixel.
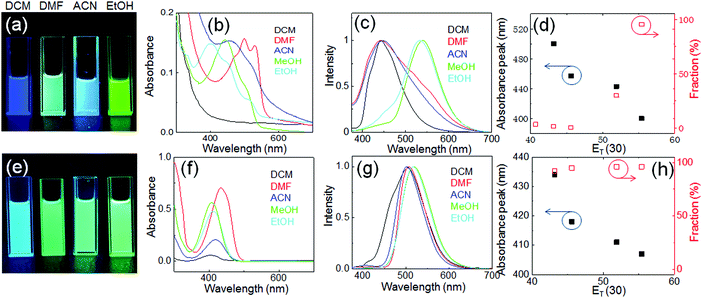
The fluorescence photographs and optical spectra of CEDD and CDQC in different solvents are shown in Fig. 5. The fluorescence colors of the CEDD solution show a giant solvent dependence (Fig. 5a). In the dichloromethane (DCM) solution, CEDD shows only blue fluorescence with the maximum excitation and emission wavelengths of 370 nm and 450 nm, respectively (Fig. S6, ESI†). A green emission with a peak at 530 nm appears in the DMF solution and its intensity is further enhanced in the ethanol solution. The absorption spectra reveal that the (n, π*) absorption in the range of 470–540 nm for CEDD in aprotic solvents (DMF and ACN) blue-shifts to 390–460 nm in protic solvents (methanol and ethanol) (Fig. 5b). This is due to the fact that the lone pair electrons in CEDD that undergo the (n, π*) transition will form hydrogen bonds with a polar solvent, and their interaction strength is greater in the ground state with stronger polarity than in the excited state with weaker polarity. As a result, the ground state energy level drops more than the excited energy level, and the amount of energy required to achieve the (n, π*) transition increases accordingly, leading to a blue-shift in the absorption spectra. Reversely, CEDD shows a fluorescence peak at 440 nm in DCM, DMF and ACN, which red-shifts to 530 nm in ethanol and methanol (Fig. 5c). Simultaneously, the 2D-PLE map shows a Stokes shift increase in protic solvents accordingly, and it reaches up to 205 nm in ethanol (Fig. S6, ESI†). Fig. 5d reveals that, with the increase of solvent polarity (quantified by ET(30)43), the absorption peaks blue-shift gradually, while green emission fractions of the fluorescence spectra increase. This is in well accordance with the typical feature of the ESIPT process, where long-wavelength absorption and blue emission with a small Stokes shift in aprotic solvents result from the enol form of CEDD, and the short-wavelength absorption but green fluorescence with a large Stokes shift is produced by the keto form. It should be noted that this dual emission is not observed in its carbogenic counterpart, C-Dots1. The absorption of C-Dots1 shows only a shoulder near 340 nm, and a broad fluorescence peak is located at 450 nm, both of which are stable against the solvent polarity changes (Fig. S7, ESI†).
Due to the lack of the ESIPT process, the fluorescence color as well as optical spectra of CDQC show little change as solvent polarity varies (Fig. 5e–h), where the (n, π*) absorption peak of CDQC at 435 nm in DMF shifts to 410 nm in methanol, and the fraction of green emission (peak at 510 nm) is nearly 100% in all solvents.
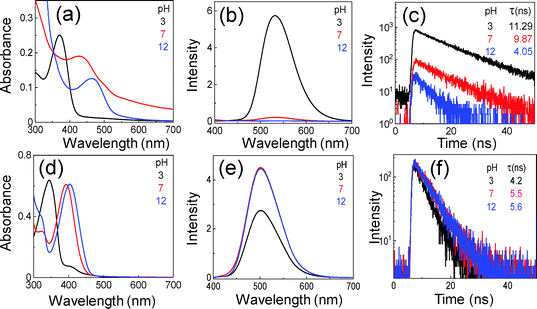
Sodium hydroxide and chloric acid are used to prepare alkali and acidic aqueous solutions with certain pH values, and then CEDD or CDQC is dispersed to the same concentration. As compared to the neutral conditions (pH 7), the absorption peak of CEDD at 430 nm blue-shifts to 370 nm and red-shifts to 460 nm when the solution pH is adjusted to acidic (pH 3) and alkali (pH 12) conditions, respectively (Fig. 6a). Similar results can be found in the absorption spectra of CDQC (Fig. 6d). The green fluorescence of the CEDD aqueous solution at pH 3 is strong, but its intensity dramatically decreases at pH 7, and at pH 12 the solution turns non-luminescent (Fig. S8 and Fig. 6b, ESI†). The emission centers in the 2D PLE maps show no changes, but the Stokes shifts decrease from 170 nm to 80 nm when the pH increases from 3 to 12 (Fig. S8, ESI†). However, the solution pH has very limited effect on the PL intensities of CDQC, only a slight decrease in its intensities occurs under pH 3 (Fig. 6e).
The PL lifetimes are measured for both CEDD and CDQC in aqueous solution with different pH values. All the decay curves are fitted by a single-exponential function: I(t) ∼ A![[thin space (1/6-em)]](https://www.rsc.org/images/entities/i_char_2009.gif) exp(−t/τ), where A is the pre-exponential factor and τ is the fitted lifetime, respectively. With the solution pH increases, the lifetimes of CEDD decrease, producing 11 ns, 9.9 ns and 4.1 ns at pH 3, pH 7, and pH 12 (Fig. 6c), respectively. It is not difficult to understand that the strong green fluorescence induced by the keto form has a long lifetime, because the ESIPT contains a four-level photocycle, but under the alkali conditions the enol form of CEDD is deprotonated, and hence ESIPT is prohibited, giving a normal short lifetime. In contrast, CDQC only increases its lifetimes slightly from 4.2 ns to 5.6 ns as the solution pH increases from 3 to 12 (Fig. 6f), which is due to the absence of the ESIPT process.
exp(−t/τ), where A is the pre-exponential factor and τ is the fitted lifetime, respectively. With the solution pH increases, the lifetimes of CEDD decrease, producing 11 ns, 9.9 ns and 4.1 ns at pH 3, pH 7, and pH 12 (Fig. 6c), respectively. It is not difficult to understand that the strong green fluorescence induced by the keto form has a long lifetime, because the ESIPT contains a four-level photocycle, but under the alkali conditions the enol form of CEDD is deprotonated, and hence ESIPT is prohibited, giving a normal short lifetime. In contrast, CDQC only increases its lifetimes slightly from 4.2 ns to 5.6 ns as the solution pH increases from 3 to 12 (Fig. 6f), which is due to the absence of the ESIPT process.
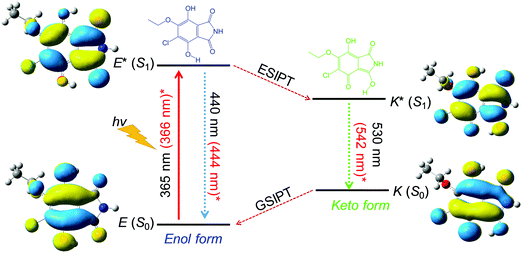
Scheme 2 summarizes the ESIPT mechanism of CEDD in the methanol solution. The CEDD molecules can exhibit ESIPT fluorescence because their structures incorporate an intramolecular hydrogen bonding interaction between the hydrogen bond donor (–OH) and hydrogen bond acceptor (C![[double bond, length as m-dash]](https://www.rsc.org/images/entities/char_e001.gif) O). Under the nonpolar or alkali conditions, the ESIPT will be switched “off”, and the deprotonated enol form of CEDD shows a weak blue, small Stokes shift and short lifetime emission. In a protic or an acidic environment and upon photoexcitation, the electronic charge of CEDD can be redistributed, resulting in greater acidity for the hydrogen bond donor group and increased basicity for the hydrogen bond acceptor within the enol form. As a result, an extremely fast enol to keto phototautomerization event takes place, with the excited state enol form (E*) rapidly converting to its excited state keto form (K*), and produces a strong green, large Stokes shift and long lifetime emission. After decaying radiatively back to its electronic ground state, a ground-state intramolecular proton transfer (GSIPT) takes place to produce the original form E(S0) because the K(S0) form is not thermodynamically stable.
O). Under the nonpolar or alkali conditions, the ESIPT will be switched “off”, and the deprotonated enol form of CEDD shows a weak blue, small Stokes shift and short lifetime emission. In a protic or an acidic environment and upon photoexcitation, the electronic charge of CEDD can be redistributed, resulting in greater acidity for the hydrogen bond donor group and increased basicity for the hydrogen bond acceptor within the enol form. As a result, an extremely fast enol to keto phototautomerization event takes place, with the excited state enol form (E*) rapidly converting to its excited state keto form (K*), and produces a strong green, large Stokes shift and long lifetime emission. After decaying radiatively back to its electronic ground state, a ground-state intramolecular proton transfer (GSIPT) takes place to produce the original form E(S0) because the K(S0) form is not thermodynamically stable.
The absorption and PL spectra are well in accordance with the predictions of density functional theory (DFT) calculations. The geometries of the fluorophores at the ground state and excited state were optimized at the B3LYP/6-311++G(d,p) level. The frequency calculations for the ground state were performed to verify that the structures obtained were local minimum on their potential energy surfaces, and the solvent effect was considered with the polarizable continuum model. All the calculations were performed using Gaussian 09.42 The enol form of CEDD molecules shows absorption and emission energies of 3.39 eV and 2.79 eV, respectively, while the keto form presents a much lower emission energy of 2.29 eV due to the ESIPT process (Fig. S9, ESI†). This means a relatively large Stokes shift for keto photoemission, which would effectively avoid photon reabsorption and hence ensures efficient photoluminescence.
Solid-state emission
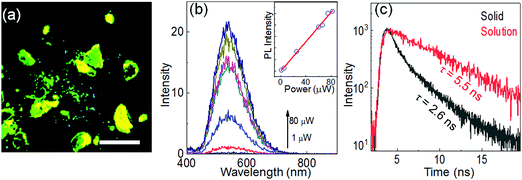
Although CEDD is highly emissive in solution with high fluorescence quantum yield (86%), it is weakly emissive or nearly non-fluorescent in its solid state due to the aggregation-caused quenching. However, CDQC exhibits a strong solid-state emission under UV excitation (Fig. 7a). A pulse laser (375 nm) with a repetition rate of 5 MHz and a width of 70 ps is used to excite the solid-state emission (Fig. 7b). The peak position of the solid-state CDQC is 530 nm, which is very close to the solution-state emission (520 nm). The peak intensities increase linearly with the laser power in the range of 1–80 μW. The PL decay curves of the solid-state powder show much difference from those of its solution counterpart (Fig. 7c). At least two lifetimes with comparable fractions can be fitted by two-exponential functions, showing a short time around 1.2 ns and a long time around 3.6 ns, both of which are nearly invariable with the changes of laser power (Fig. S10, ESI†).Anti-counterfeiting
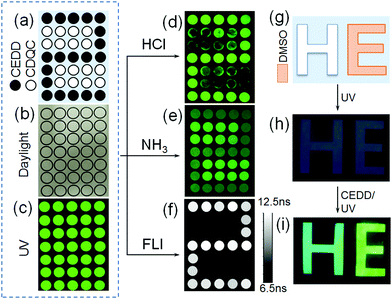
Based on the ESIPT photoluminescence of CEDD, we explore its potential application in information encryption and anti-counterfeiting. The significant difference of PL intensities between CEDD and CDQC in response to the environments can be utilized to design anti-counterfeiting tags resulting in a great sensitivity in CEDD and an optical stability in CDQC. Using CEDD as a fluorescent ink, we wrote “2” by printing the solid pixels in Fig. 8a, and wrote the rest of the hollow pixels with CDQC ink. The tag is not only invisible under daylight (Fig. 8b), but also shows an indistinguishable pattern because each pixel has nearly the same green color and equivalent brightness under the 365 nm lamp illumination (Fig. 8c). That means common UV illumination cannot decrypt the information visually. In the next set of experiments, we apply HCl vapor, NH3 vapor and fluorescence lifetime imaging to read the encrypted information. When fuming the matrix with HCl vapor, the CEDD pixels have strong green emission due to the HCl-enhanced ESIPT process but the CDQC pixels are largely weakened, then the encoded digit “2” is displayed (Fig. 8d). However, the NH3 vapor has a reverse effect on decrypting the information, where the brightness of CEDD pixels decreases but the CDQC pixels retain their intensities (Fig. 8e), hence the shaded “2” can be identified.As mentioned above, CEDD exhibits a long fluorescence lifetime of 9–11 ns, surpassing the lifetime of 4–5 ns of CDQC. Due to the giant difference of fluorescence lifetimes between them, the encrypted information can be read out by fluorescence lifetime imaging (FLI), where the fluorescence lifetime of each pixel has been measured (Table S1, ESI†). Clearly, a pattern of the digit “2” is displayed (Fig. 8f). The solvatochromism of CEDD can also be used to encrypt the information. The pattern “E” of “HE” is firstly smeared with dimethyl sulfoxide (DMSO) (Fig. 8g), and the pattern is non-luminescent under UV illumination (Fig. 8h). After painting the paper with CEDD, the fluorescence images of “H” and “E” show cyan and green color, respectively (Fig. 8i). This indicates that the DMSO can switch on the ESIPT process of CEDD on the paper, and finally enhance the fluorescence brightness of the encrypted pattern.
Conclusions
In summary, the excited-state intramolecular proton-transfer (ESIPT) active fluorophore, 5-chloro-6-ethoxy-4,7-dihydroxyisoindoline-1,3-dione (CEDD) and a non-ESIPT 7-cyano-5,8-dihydroxyquinoxaline-6-carboxamide (CDQC) are extracted from ethanol- and ethylenediamine-doped 2,3-dichloro-5,6-dicyano-p-benzoquinone (DDQ) based carbon dots, respectively. Under the nonpolar or alkali conditions, the enol form of CEDD shows weak blue and small Stokes shift emission. While the ESIPT can be achieved in a protic or an acidic environment, the keto form of CEDD produces strong green and large Stokes shift emission. Due to the lack of the efficient ESIPT process, CDQC has no dual emission characteristics, but show strong solid-state emission. By virtue of the ESIPT properties of CEDD, multiple and high-level anti-counterfeiting strategies are achieved by using chloric acid, ammonia, fluorescence lifetime imaging, as well as DMSO as the decoders. It should be noted that the carbogenic dots show no obvious dual emission, pH sensitiveness and solvatochromism properties, which the ESIPT fluorophores are endowed with, suggesting that many bottom-up carbon dots will need to be carefully separated using more rigorous purification protocols.Conflicts of interest
There are no conflicts to declare.Acknowledgements
This work was supported by the China Postdoctoral Science Foundation (2019M662485), National Natural Science Foundation of China (U2004179; U1904184; U1904191), Natural Science Foundation of Henan Province (202300410086), and Key Science and Technology Program of Henan Province (182102210245). Hai-Bei Li thanks the fund of Young Scholars Program of Shandong University (Weihai), YSPSDUWH, and the supercomputing system in the Supercomputing Center, Shandong University, Weihai.References
- B. Zhi, X. Yao, Y. Cui, G. Orr and C. Haynes, Synthesis, Applications and Potential Photoluminescence Mechanism of Spectrally Tunable Carbon Dots, Nanoscale, 2019, 11, 20411–20428 RSC.
- N. C. Verma, A. Yadav and C. K. Nandi, Paving the Path to the Future of Carbogenic Nanodots, Nat. Commun., 2019, 10, 2391 CrossRef.
- Y. Song, S. Zhu, S. Zhang, Y. Fu, L. Wang, X. Zhao and B. Yang, Investigation from Chemical Structure to Photoluminescent Mechanism: A Type of Carbon Dots from the Pyrolysis of Citric Acid and an Amine, J. Mater. Chem. C, 2015, 3, 5976–5984 RSC.
- X. Liu, H. Li, L. Shi, X. Meng, Y. Wang, X. Chen, H. Xu, W. Zhang, X. Fang and T. Ding, Structure and Photoluminescence Evolution of Nanodots During Pyrolysis of Citric Acid: From Molecular Nanoclusters to Carbogenic Nanoparticles, J. Mater. Chem. C, 2017, 5, 10302–10312 RSC.
- M. Krysmann, A. Kelarakis, P. Dallas and E. Giannelis, Formation Mechanism of Carbogenic Nanoparticles with Dual Photoluminescence Emission, J. Am. Chem. Soc., 2012, 134, 747–750 CrossRef CAS.
- R. Sendao, D. Crista, A. Afonso and M. Algarra, Insight into the Hybrid Luminescence Showed by Carbon Dots and Molecular Fluorophores in Solution, Phys. Chem. Chem. Phys., 2019, 21, 20919–20926 RSC.
- D. Qu and Z. Sun, The Formation Mechanism and Fluorophores of Carbon Dots Synthesized via a Bottom-Up Route, Mater. Chem. Front., 2020, 4, 400–420 RSC.
- S. Zhu, X. Zhao, Y. Song, S. Lu and B. Yang, Beyond Bottom-Up Carbon Nanodots: Citric-Acid Derived Organic Molecules, Nano Today, 2016, 11, 128–132 CrossRef CAS.
- C. Reckmeier, J. Schneider, Y. Xiong, J. Hausler, P. Kasak, W. Schnick and A. Rogach, Aggregated Molecular Fluorophores in the Ammonothermal Synthesis of Carbon Dots, Chem. Mater., 2017, 29, 10352–10361 CrossRef CAS.
- W. Zhu, X. Meng, H. Li, F. He, L. Wang, H. Xu, Y. Huang, W. Zhang, X. Fang and T. Ding, Ethanothermal Synthesis of Phenol-Derived Carbon Dots with Multiple Color Emission via a Versatile Oxidation Strategy, Opt. Mater., 2019, 88, 412–416 CrossRef CAS.
- L. Shi, J. Yang, H. Zeng, Y. Chen, S. Yang, C. Wu, H. Zeng, O. Yoshihito and Q. Zhang, Carbon Dots with High Fluorescence Quantum Yield: The Fluorescence Originates from Organic Fluorophores, Nanoscale, 2016, 8, 14374–14378 RSC.
- X. Meng, Y. Wang, X. Liu, M. Wang, Y. Zhan, Y. Liu, W. Zhu, W. Zhang, L. Shi and X. Fang, Supramolecular Nanodots Derived from Citric Acid and Beta-Amines with High Quantum Yield and Sensitive Photoluminescence, Opt. Mater., 2018, 77, 48–54 CrossRef CAS.
- Q. Hu, X. Meng and W. Chan, An Investigation on the Chemical Structure of Nitrogen and Sulfur Codoped Carbon Nanoparticles by Ultra-Performance Liquid Chromatography-Tandem Mass Spectrometry, Anal. Bioanal. Chem., 2016, 408, 5347–5357 CrossRef CAS.
- W. Zhang, L. Shi, Y. Liu, X. Meng, H. Xu, Y. Xu, B. Liu, X. Fang, H. Li and T. Ding, Supramolecular Interactions via Hydrogen Bonding Contributing to Citric-Acid Derived Carbon Dots with High Quantum Yield and Sensitive Photoluminescence, RSC Adv., 2017, 7, 20345–20353 RSC.
- S. Zhu, X. Zhao, Y. Song, S. Lu and B. Yang, Beyond Bottom-Up Carbon Nanodots: Citric-Acid Derived Organic Molecules, Nano Today, 2015, 11, 128–132 CrossRef.
- W. Kasprzyk, T. Świergosz, S. Bednarz, K. Walas, N. Bashmakova and D. Bogdał, Luminescence Phenomena of Carbon Dots Derived from Citric Acid and Urea-a Molecular Insight., Nanoscale, 2018, 10, 13889–13894 RSC.
- W. Kasprzyk, S. Bednarz, P. Zmudzki, M. Galica and D. Bogdał, Novel Efficient Fluorophores Synthesized from Citric Acid, RSC Adv., 2015, 5, 34795–34799 RSC.
- V. Gude, A. Das, T. Chatterjee and P. K. Mandal, Molecular Origin of Photoluminescence of Carbon Dots: Aggregation-Induced Orange-Red Emission, Phys. Chem. Chem. Phys., 2016, 18, 28274–28280 RSC.
- S. Mukherjee, E. Prasad and A. Chadha, H-Bonding Controls the Emission Properties of Functionalized Carbon Nano-Dots, Phys. Chem. Chem. Phys., 2017, 19, 7288–7296 RSC.
- S. Khan, A. Sharma, S. Ghoshal, S. Jain, M. K. Hazra and C. K. Nandi, Small Molecular Organic Nanocrystals Resemble Carbon Nanodots in Terms of their Properties, Chem. Sci., 2018, 9, 175–180 RSC.
- T. Zhang, J. Zhu, Y. Zhai, H. Wang, X. Bai, B. Dong, H. Wang and H. Song, A Novel Mechanism for Red Emission Carbon Dots: Hydrogen Bond Dominated Molecular States Emission, Nanoscale, 2017, 9, 13042–13051 RSC.
- H. Liu, J. Yang, Z. Li, L. Xiao, Y. Sun, R. Yang, H. Meng, L. Qu, Y. Lin and X. Zhang, Hydrogen-Bond-Induced Emission of Carbon Dots for Wash-Free Nucleus Imaging, Anal. Chem., 2019, 91, 9259–9265 CrossRef CAS.
- H. Yang, Y. Liu, Z. Guo, B. Lei, J. Zhuang, X. Zhang, Z. Liu and C. Hu, Hydrophobic Carbon Dots with Blue Dispersed Emission and Red Aggregation-Induced Emission, Nat. Commun., 2019, 10, 1789 CrossRef.
- F. Yuan, T. Yuan, L. Sui, Z. Wang, Z. Xi, Y. Li, X. Li, L. Fan, Z. Tan and A. Chen, et al., Engineering Triangular Carbon Quantum Dots with Unprecedented Narrow Bandwidth Emission for Multicolored LEDs, Nat. Commun., 2018, 9, 2249 CrossRef.
- Y. Zhang, J. Xiao, P. Zhuo, H. Yin, Y. Fan, X. Liu and Z. Chen, Carbon Dots Exhibiting Concentration-Dependent Full-Visible-Spectrum Emission for Light-Emitting Diode Applications, ACS. Appl. Mater. Interfaces, 2019, 11, 46054–46061 CrossRef CAS.
- C. Wang, T. Hu, Z. Wen, J. Zhou, X. Wang, Q. Wu and C. Wang, Concentration-Dependent Color Tunability of Nitrogen-Doped Carbon Dots and Their Application for Iron(III) Detection and Multicolor Bioimaging, J. Colloid Interface Sci., 2018, 521, 33–41 CrossRef CAS.
- Y. Chen, H. Lian, Y. Wei, X. He, Y. Chen, B. Wang, Q. Zeng and J. Lin, Concentration-Induced Multi-Colored Emissions in Carbon Dots: Origination from Triple Fluorescent Centers, Nanoscale, 2018, 10, 6734–6743 RSC.
- X. Ba, L. Zhang, Y. Yin, F. Jiang, P. Jiang and Y. Liu, Luminescent Carbon Dots with Concentration-Dependent Emission in Solution and Yellow Emission in Solid State, J. Colloid Interface Sci., 2020, 565, 77–85 CrossRef CAS.
- J. Kwon and S. Park, Advanced Organic Optoelectronic Materials: Harnessing Excited-State Intramolecular Proton Transfer (ESIPT) Process, Adv. Mater., 2011, 23, 3615–3642 CrossRef CAS.
- T. Beppu, K. Tomiguchi, A. Masuhara, Y. Pu and H. Katagiri, Single Benzene Green Fluorophore: Solid-State Emissive, Water-Soluble, and Solvent- and pH-Independent Fluorescence with Large Stokes Shifts, Angew. Chem., Int. Ed., 2015, 54, 7332–7335 CrossRef CAS.
- B. Dick and E. Ernsting, Excited-State Intramolecular Proton Transfer in 3-Hydroxylflavone Isolated in Solid Argon: Fluoroescence and Fluorescence-Excitation Spectra and Tautomer Fluorescence Rise Time, J. Phys. Chem., 1987, 91, 4261–4265 CrossRef CAS.
- T. Iijima, A. Momotake, Y. Shinohara, T. Sato, Y. Nishimura and T. Arai, Excited-State Intramolecular Proton Transfer of Naphthalene-Fused 2-(2′-Hydroxyaryl)Benzazole Family, J. Phys. Chem. A, 2010, 5, 1603–1609 CrossRef.
- J. Zhao, S. Ji, Y. Chen and P. Yang, Excited State Intramolecular Proton Transfer (ESIPT): From Principal Photophysics to the Development of New Chromophores and Applications in Fluorescent Molecular Probes and Luminescent Materials, Phys. Chem. Chem. Phys., 2012, 14, 8803–8817 RSC.
- A. Demchenko, K. Tang and P. Chou, Excited-State Proton Coupled Charge Transfer Modulated by Molecular Structure and Media Polarization, Chem. Soc. Rev., 2013, 42, 1379–1408 RSC.
- J. Zhao and K. Han, Hydrogen Bonding in the Electronic Excited State, Acc. Chem. Res., 2012, 45, 404–413 CrossRef.
- S. Formosinho and L. Arnaut, Excited-state Proton Transfer Reactions II. Intramolecular Reactions, J. Photochem. Photobiol., A, 1993, 75, 21–48 CrossRef CAS.
- H. Xi, Z. Zhang, W. Zhang, M. Li, C. Lian, Q. Luo, H. Tian and W. Zhu, All-Visible-Light-Activated Dithienylethenes Induced by Intramolecular Proton Transfer, J. Am. Chem. Soc., 2019, 141, 18467–18474 CrossRef CAS.
- A. Padalkar and S. Seki, Excited-State Intramolecular Proton-Transfer (ESIPT)-Inspired Solid State Emitters, Chem. Soc. Rev., 2016, 45, 169–202 RSC.
- X. Zeng, Z. Yu, F. Wang, X. Wang, C. Wang, H. Lu and Q. Wang, THF-Induced Emission Enhancement and Reversible Stimulus Response of a Tetraphenylethylene Luminogen Dependent ESIPT Mechanism, Dyes Pigm., 2019, 171, 107699 CrossRef CAS.
- S. Barman, S. Mukhopadhyay, M. Gangopadhyay, S. Biswas, S. Dey and N. Singh, Coumarin–Benzothiazole–Chlorambucil (Cou–Benz–Cbl) Conjugate: an ESIPT Based pH Sensitive Photoresponsive Drug Delivery System, J. Mater. Chem. B, 2015, 3, 3490–3497 RSC.
- A. Sedgwick, L. Wu, H. Han, S. Bull, X. He, T. James, J. Sessler, B. Tang and J. Yoon, Excited-State Intramolecular Proton-Transfer (ESIPT) Based Fluorescence Sensors and Imaging Agents, Chem. Soc. Rev., 2018, 47, 8842–8880 RSC.
- (a) A. D. Becke, Density-Functional Thermochemistry. III. The Role of Exact Exchange, J. Chem. Phys., 1993, 98, 5648–5652 CrossRef CAS; (b) S. Grimme, J. Antony, S. Ehrlich and H. Krieg, A Consistent and Accurate Ab Initio Parameterization of Density Functional Dispersion Correction (DFT-D) for the 94 Elements H-Pu, J. Chem. Phys., 2010, 132, 154104 CrossRef; (c) G. W. T. M. Frisch, H. B. Schlegel, G. E. Scuseria, J. R. C. M. Robb, G. Scalmani, V. Barone, B. Mennucci, H. N. G. A. Petersson, M. Caricato, X. Li, H. P. Hratchian, J. B. A. F. Izmaylov, G. Zheng, J. L. Sonnenberg, M. Hada, K. T. M. Ehara, R. Fukuda, J. Hasegawa, M. Ishida, T. Nakajima, O. K. Y. Honda, H. Nakai, T. Vreven, J. A. Montgomery, F. O. J. E. Peralta, M. Bearpark, J. J. Heyd, E. Brothers, V. N. S. K. Kudin, T. Keith, R. Kobayashi, J. Normand, A. R. K. Raghavachari, J. C. Burant, S. S. Iyengar, J. Tomasi, N. R. M. Cossi, J. M. Millam, M. Klene, J. E. Knox, J. B. Cross, C. A. V. Bakken, J. Jaramillo, R. Gomperts, R. E. Stratmann, A. J. A. O. Yazyev, R. Cammi, C. Pomelli, J. W. Ochterski, K. M. R. L. Martin, V. G. Zakrzewski, G. A. Voth, J. J. D. P. Salvador, S. Dapprich, A. D. Daniels, J. B. F. O. Farkas, J. V. Ortiz, J. Cioslowski and D. J. Fox, Gaussian 09, Revision D.01, Gaussian Inc., Wallingford CT, 2013 Search PubMed.
- C. Reichardt, Solvatochromic Dyes as Solvent Polarity Indicators, Chem. Rev., 1994, 94, 2319–2358 CrossRef CAS.
Footnotes |
| † Electronic supplementary information (ESI) available: 1H NMR spectra, HRMS spectra, XRD patterns, 2D-PLE contour maps, absorption spectra, fluorescence photographs, frontier orbital calculations, Raman spectra, and fluorescence lifetimes. See DOI: 10.1039/d0cp05123c |
| ‡ These authors contributed equally to this work. |
| This journal is © the Owner Societies 2021 |

