
Effect of the charge state on the structure of the Au60 cluster†
Jimena M.
Jacobo-Fernández
and
A.
Tlahuice-Flores
 *
*
Universidad Autónoma de Nuevo León, CICFIM-Facultad de Ciencias Físico-Matemáticas, San Nicolás de los Garza, NL 66455, Mexico. E-mail: tlahuicef@gmail.com
First published on 23rd November 2020
Abstract
This manuscript outlines a DFT-D study of a neutral and charged Au60 cluster. The neutral structure features an I-symmetry, while 1−, 1+, and 2+ charge states result in a structure with Cs symmetry. The main difference among neutral and charged clusters is their compactness and we used a polyhedral approach to analyze their structure in terms of tetrahedral and octahedral building blocks. Moreover, we calculated their IR/Raman spectra to distinguish among them.
Introduction
When we think about a metal, the idea of a compact structure comes to our mind. The bulk phase metals have a periodic/ordered distribution of their constituting atoms. However, a metal cluster (including tents of atoms) might not necessarily result in compact structures. The increment in the number of surfaces rather than volume atoms, results in the reduction of the symmetry. Interestingly, in gold clusters, the reduced size enhances their properties and make them suitable to be used in catalysis, light harvesting, magnetism, sensing, bio-labelling, and so on.1–7The superatom concept was introduced as the explanation of the stability of Na clusters observed during experiments.8–12 In the case of gold clusters, a polyhedral approach can be useful to explain their structure and size based on building blocks (tetrahedra and octahedra) and the induced distortion can be quantified (bond lengths and angles) with respect to the ideal values.13
Specifically, the Au60 cluster can be modeled by a hollow structure (I-symmetry) or one compact-like structure (Cs symmetry).14–16 The presence of hollow gold structures is not new and Kartunnen et al. in 2008 reported one Au72 cluster. More importantly, they proposed the Au72 as comprised by the combination of the snub dodecahedron (Au60) and one icosahedron (Au12 cluster). From their study, it is obvious that the Au72 cluster has 12 gold atoms linked to pentagonal gold rings. The finding of the Au72 with I-symmetry is remarkable due to the displayed chirality in one icosahedral structure, and its stability can be deduced from the reported 0.72 eV HOMO–LUMO value.14
In addition, the distribution of gold atoms forming one Au60 shell with a higher symmetry (Ih symmetry) is found in the structure of the I-symmetric gold-subhalide Au144 cluster.17 Therefore, the synthesis route can be thought of as an etching process of the mentioned structures.
As mentioned before, the Au60 cluster can be modeled by a hollow (I-symmetry) and a “compact-like” (Cs point group) structure, in such a manner that we can witness the size evolution of bare gold clusters. One expects that as the size increases, the more compact structures might prevail. Contrary to this thought, the existence of hollow gold clusters for large sizes (Ih-Au32, Ih-Au42, I-Au72, Ih-Au92, Ih-Au122) has been reported, attesting the existent competence among hollow or quasi-2D and compact structures.18 But not only in the bare gold clusters field it has been found the “magic” 60 number, and one assembly of five icosahedral clusters linked by Au–Se–Au units and protected with 15-SePh ligands forming the protected Au60 cluster was reported.19
To adapt the superatom concept to the Au60 cluster, the electron counting is reduced by considering only one valence electron, in such a manner that the total number of electrons adds up to 60 (1S2, 1P6, 1D10, 2S2, 1F14, 2P6, 1G18, 2D2). This number does not constitute a magic number and instead 58 electrons represent the electronic shell closing. It suggests that the Au60 cluster needs to be in a 2+ charge state to be in accordance with the superatom concept.20–24
After considering various charge states and total spin multiplicities (singlet, doublet and quartet) for the Au60 cluster, we concentrate our study in three Au60 structures holding I and Cs symmetries. In the case of the hollow isomer, we started from a perfect snub dodecahedron (Archimedean solid) with Au–Au bonds of 2.88 Å and the more compact-like isomer was modeled initially by one FCC core but it converged to the provided view in ref. 16. The clusters were optimized, and they were characterized as true minima by a vibrational calculation. The structural analysis was carried out by the polyhedral approach and each structure and their constituting building blocks are provided in Fig. 1 for inspection. Energetically, the stability of 1−, 0, 1+ and 2+ clusters was attested by the calculated binding energy values. It is determined that the anion with Cs symmetry has a binding energy of circa 1.43 eV per atom.
 | ||
| Fig. 1 Stable charged and neutral Au60 clusters sustaining real frequency values. The depicted polyhedral blocks have common triangular faces. Upper panel corresponds with the dication (2+ and singlet), and (a) depicts a hole formed by the octahedral blocks arrangement that is related to the inner icosahedral core; (b) corresponds with the tetrahedral block arrangement. (c) shows a view of the 2+ charged structure where polyhedral blocks are scarce. Middle panel shows the anionic structure (Cs and doublet) including (d) octahedral and (e) tetrahedral blocks, and (f) image features a view of the compact region in the anion structure. The lower panel shows (g) the neutral (I-symmetry and singlet) structure. Only less distorted 14 equilateral triangles of the neutral Au60 cluster are depicted. The hollow structure has 80 triangular faces. The octahedral blocks are displayed in green color, while the tetrahedral cluster is shown in red color. | ||
However, this value is less than the 2.33 eV per atom value of the Au56 cluster reported by Jinlan Wang et al. in 2005.25 In the case of the charged Cs structures, the main question is if the inner Au13 core remains intact, maintaining it symmetric or if it is slightly distorted due to the charge effect.
Our goal is to correlate the charge effect on both the stability and the displayed geometrical/electronic symmetry of the Au60 clusters. This study includes the analysis of the distinct bonding, the structural analysis in terms of polyhedral blocks and the calculation of their IR/Raman spectra to characterize them.
Methodology
All calculations were based on DFT as implemented in the ORCA package,26 and only the gas phase was considered for the optimization stage and for the vibrational (IR and Raman spectra) characterization. The calculations were carried out with the Perdew–Burke–Ernzerhof (PBE) exchange–correlation functional.27Effective core potential including 19 valence electrons was used for the gold atoms.28,29 The energy and gradient convergence criterion were selected as 1.00 × 10⁻⁶ Hartree and 3.00 × 10⁻⁵ Hartree per Bohr, respectively. The election of mentioned parameters reduced the computation time without lack of the quality in the obtained results. The obtained new structures were full optimized, and their IR and Raman spectra were calculated.
The calculation also includes an atom-pairwise dispersion correction with the Becke–Johnson damping scheme (D3BJ), in order to correct the underestimation of the stability of 3D against the 2D structures by almost 0.26 eV as it was mentioned in the case of the Au8 cluster.30,31
This approximation is necessary because the studied Au60 isomers are hollow (extended 2D lattice) and 3D structures. Therefore, the calculation of the relative energy among the 2D to 3D (or Cs and I) might avoid the dispersion effects.
We consider it necessary to provide a general view of the coded algorithm to calculate the angles and distances into the polyhedral blocks. All the programming was done by using an object-orientated language as is POV-Ray.32,33
1. Determination of the polyhedral block types (tetrahedron, octahedron), based on chosen ranges of Au–Au distances, and the calculation of their centres to account for them.
2. Calculation of the sustained angles for each triangular-like face forming every polyhedral block.
3. Re-calculation of the Au–Au edges constituting the selected polyhedral blocks.
4. Sorting of the angles (3 for each face) and edge length values displayed for each polyhedral block to produce bondlength and angle graphics. Less distorted polyhedrals were labeled with smaller numbers.
To help the reader with the understanding of the used algorithm, we have included a graphical representation of the steps followed in the algorithm in the ESI,† (Fig. S1).
Before the discussion, it is important to mention that the 1+ structure was found free of imaginary frequencies and displaying a Cs symmetry, but we hereafter include only three distinctive structures.
Results and discussions
Structural analysis
The optimized structures are depicted in Fig. 1. The 2+ and 1− charged isomers hold Cs symmetry and their structures can be explained as comprised by 12 octahedra and 77 tetrahedra.In Fig. 2, the Au–Au bond length distribution of the neutral cluster (c) shows columns corresponding with 2.67, 2.72 and 2.77 Å values and it can be correlated with a higher symmetry. Contrarily, the charged ones (a and b) share the same point group, and their Au–Au bond length distribution shows small differences. For example, (b) displays a gap circa 2.80 Å. This means that structurally charged ones are slightly different on their Au–Au bonds.
 | ||
| Fig. 2 Calculated Au–Au bond lengths of Au60 clusters. (a) 2+ charge state, (b) anion, and (c) neutral cluster. In (c) the distribution of the Au–Au bond lengths forming columns in the neutral cluster is related to a symmetric structure, with its bonds included in the range from 2.67 to 2.77 Å. The slightly different bonding displayed by 2+ and 1− charged clusters is not easy to see from these graphs. Both charged structures have bonds in the same range and hold the same Cs symmetry. The vertical dotted-line circa 2.77 Å, indicates a structural difference among charged clusters. | ||
A further polyhedral block analysis, based on decomposition of the full structures in their tetrahedral and octahedral blocks, let us capture more detail in the structural differences among the studied clusters. The calculated angles and bond distances (Fig. 3 and 4), provide us with more detail in the displayed bonding.
 | ||
| Fig. 3 Featured angles by the triangular-like faces constituting the octahedra/tetrahedra blocks of the Au60 clusters. Horizontal lines indicate the 60 degrees value found in one perfect equilateral triangle. It means that the angle values located far from the 60 degrees value corresponds with more distorted polyhedral blocks. The upper panel corresponds with the dication (a and b), the middle panel (c and d) shows the anion and the lower panel corresponds with the neutral (I-symmetry) structure (e). Comparison of the distribution of calculated angle values of the tetrahedra constituting 2+ and 1− structures (b and d) shows more dispersion in the case of the anion (see tetrahedral blocks numbered from 50 to 80). The green oval is used to indicate more distorted tetrahedral blocks. Further analysis of the octahedral blocks in (a) and (c), (see octahedra numbered as 8–10 and indicated with one black oval). This means that polyhedral blocks are more distorted for the anionic structure. Conversely, the neutral structure depicts triangular faces with angle values closer to the 60 degrees value. | ||
 | ||
| Fig. 4 Au60 clusters and their featured bonds of triangular faces constituting octahedral/tetrahedral blocks (range from 2.7 to 3.4 Å). The upper panel corresponds with the dication (a and b), the middle panel (c and d) shows the anion and the lower panel corresponds with the neutral (I-symmetry) structure (e). In (a) and (c), the Au–Au bond distribution in the constituting octahedral blocks shows that at least three octahedra (numbers from 10 to 12 in the horizontal axis, and black oval) are more distorted in the anion cluster. The comparison among (b) and (d) reveals that +2 charge have slightly less distorted tetrahedral blocks (up to 48). (d) Shows that 1− charge state cluster contains tetrahedral blocks more distorted than the 2+ charged one (green oval). The lower panel corresponds with the neutral structure with bond distances comprised in the 2.67–2.77 Å range. | ||
The charged structures are compact-like and are comprised by octahedral blocks distributed in 4 fused pentagonal rings as those found in the dodecahedron (Fig. S1, ESI†). Furthermore, they are located at both sides of one symmetry plane but forming a compact region (Fig. S2–S4, ESI†). The question here is how are the more perfect/compact tetrahedra distributed through the structure of charged Au60 clusters? An icosahedron can be considered as formed by 20 distorted tetrahedra and therefore the inner Au13 shell cannot be constituted by perfect ones. In Fig. S5 and S6 (ESI†) is given the distribution of 12 less distorted tetrahedral blocks and it is determined that they are distributed along the whole structure.
Tetrahedra are not located at a preferential region as in the case of the octahedral blocks. From the obtained distribution of the tetrahedra, we can conclude that the inner Au13 core is distorted in the charged ones. In Fig. 3, the middle panel contains the calculated angles of the anionic Au60 cluster (c) showing 3 octahedra (number 8–10) with angles of circa 72 degrees. The same 1− charged cluster has tetrahedra displaying large angle values (d) with respect to the 2+ charged cluster. The same trend is followed by the Au–Au bonds in Fig. 4 and it seems appropriate to establish the 1− charged Au60 cluster as slightly more distorted than the 2+ charged cluster (a and b).
To determine the stability of each Au60 cluster, we calculated the binding energy using the following formula:
| Ebinding = (EAu60 − 60 × (EAu))/60 |
The large value corresponds with the anion and 1.43 eV per atom was calculated. Neutral and 2+ charged clusters have 1.12 and 1.14 eV per atom, respectively.
Energy levels analysis
The HOMO–LUMO gap value can be related to the stability of the molecular structures. In Fig. 5 are given the calculated energy levels of the Au60 clusters. The calculated values follow the order 2+ > neutral >1−, with 0.78 eV > 0.36 eV > 0.19 eV, respectively. These results can be compared against the calculated 0.71 eV HL gap for the hollow I-Au72 cluster and it is in agreement with the 0.72 eV value reported in the literature.14 This means that the stability of the 2+ charged Au60 cluster is comparable to the neutral chiral I-Au72 cluster. However, it is necessary to take into account that topologically both are different because one is hollow and the other one is a compact-like structure.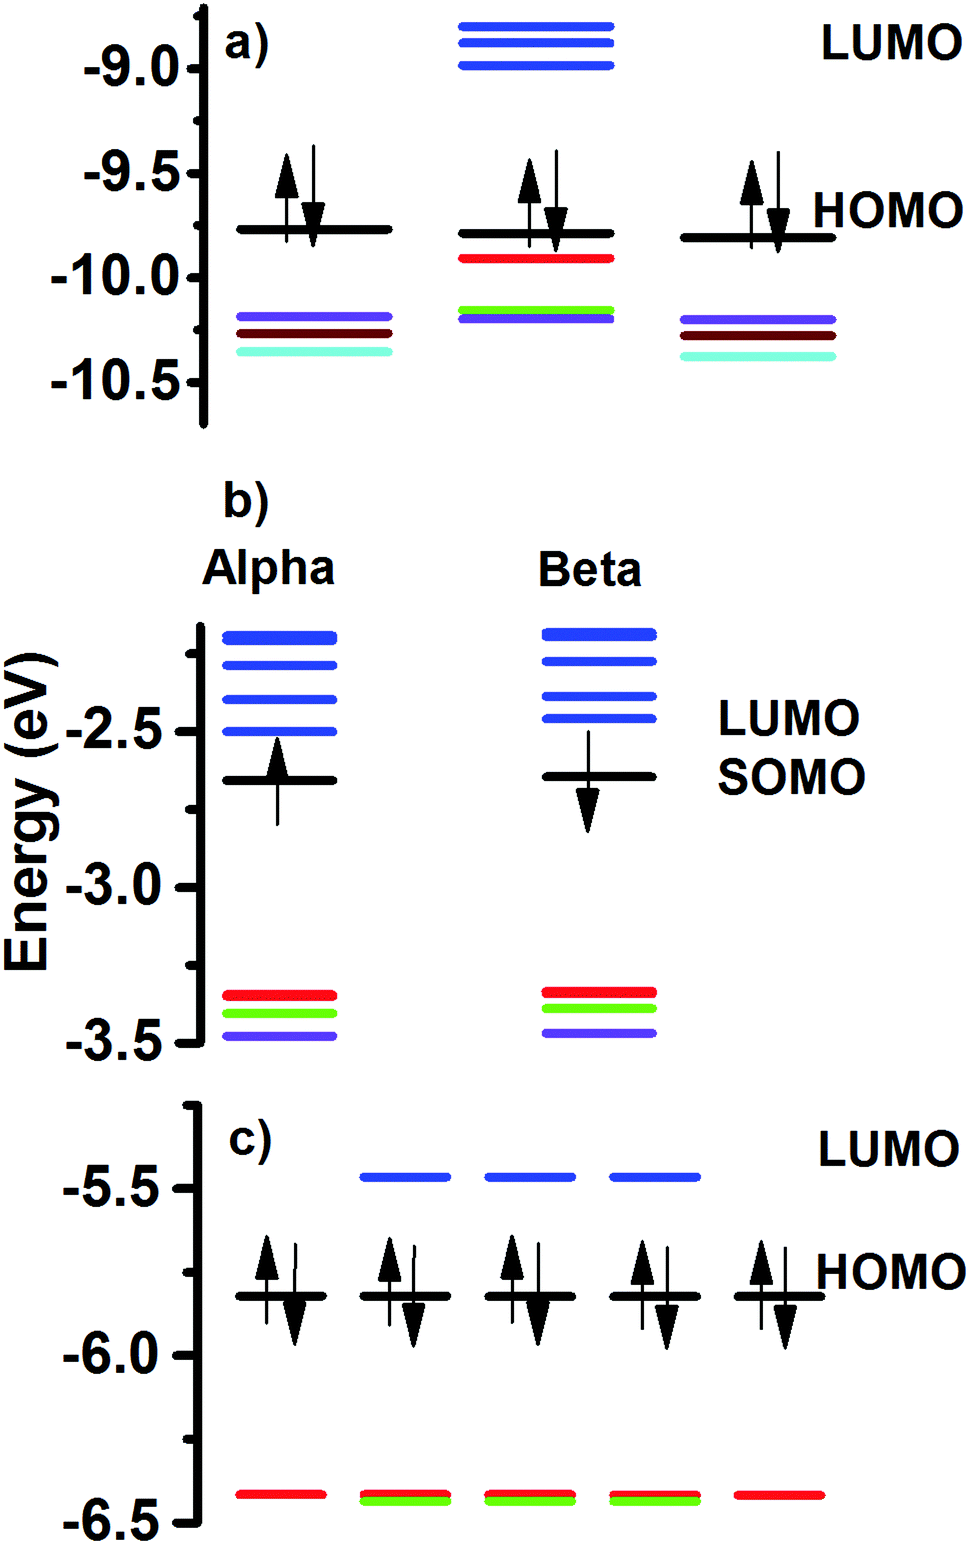 | ||
| Fig. 5 Calculated frontier orbitals. (a) 2 +, (b) 1− and (c) neutral Au60 clusters. Neutral cluster is the I-symmetric and it shows five-fold degeneracy of its HOMO and HOMO−1 levels. The LUMO is three-fold degenerate. The 2+ structure has a 3-fold HOMO level, and a HOMO−1 level with no degeneracy. The LUMO level has lost its degeneracy. The anionic Au60 cluster is an open shell structure and its energy levels are not displaying degeneracy. Arrows indicate the spin of electrons and are used only in the last occupied level. | ||
The stability displayed by the neutral Au60 cluster can be explained in terms of the filling of superatomic orbitals. The superatomic filling 1S2, P6, D10, 2S2, 1F14, 2P6, 1G18, 2D2 was assumed, in such a manner that the electronic shell closing was expected for the 2+ structure. However, the calculated energy levels showed an astonishing fact. HOMO and HOMO−1 levels were five-fold degenerate and LUMO with a three-fold degeneracy (Fig. 5). The obtained trend can be explained in terms of the mixing of the 3S (no degeneracy) and 1G (9-fold) superatomic levels producing the five-fold degeneracy of HOMO and HOMO−1 levels, respectively. The LUMO, LUMO+1, LUMO+2 and LUMO+3 levels depicted 3, 3, 5 and 5-fold degeneracy, respectively. Those can be thought of as coming from the mixing of the 2D (5-fold) and 1H (11-fold) superatomic levels. In other words, 3S and 1G combine to give occupied levels, while mixing of 2D and 1H superatomic levels produced unoccupied levels. Worthy of note is that the degeneracy of energy levels for C60 molecule and that obtained for the Au60 cluster are equal for the HOMO and LUMO levels. The degeneracy of the electronic levels of neutral Au60 is due to its high symmetry.
The charged clusters showed a reduced symmetry because of the partial filling of the 5-fold energy levels. The 2+ structure, is stable when a multiplicity of one was tested.
In this case, the HOMO is separated as 3-fold +2 no degenerate levels (indicated by the red and green colour in Fig. 5a). The anionic structure (Fig. 5b) suffered a complete loss of its energy levels with respect to the neutral (closed electronic shell). We can summarize the obtained results as follows: The neutral Au60 structure is stable and its electrons are paired (singlet) and the structure preferred is an I-symmetric one. When a pair of electrons is released (2+), the remaining electrons prefer to be paired and the electronic levels reaccommodate to maintain a closed electronic shell, with the reduction of the symmetry. In this case, the change from I-symmetry to Cs-symmetry featured two different molecular topologies. The partial filling of one degenerate electronic level, as in the anion, destabilizes the electronic structure and a major distortion is obtained, breaking all degeneracy.
Vibrational analysis
The use of vibrational spectroscopy and the determination of the normal modes of gold clusters, represent a manner to identify them after their synthesis. Worthy of note is the experimental work carried out on neutral Au7, Au19 and Au20 clusters by the Fielicke group.34 They have been able to identify the structure of the mentioned gold clusters in the gas phase by means of infrared absorption spectroscopy (IR). In the study of anionic gold clusters, the experimental techniques used are electron diffraction pattern, photoelectron spectroscopy and trapped-ion electron diffraction. Moreover, our group has published various theoretical studies devoted to vibrations in thiolated-gold clusters.35The vibrational analysis of the three Au60 structures was carried out and it is provided in Fig. 6 and 7.
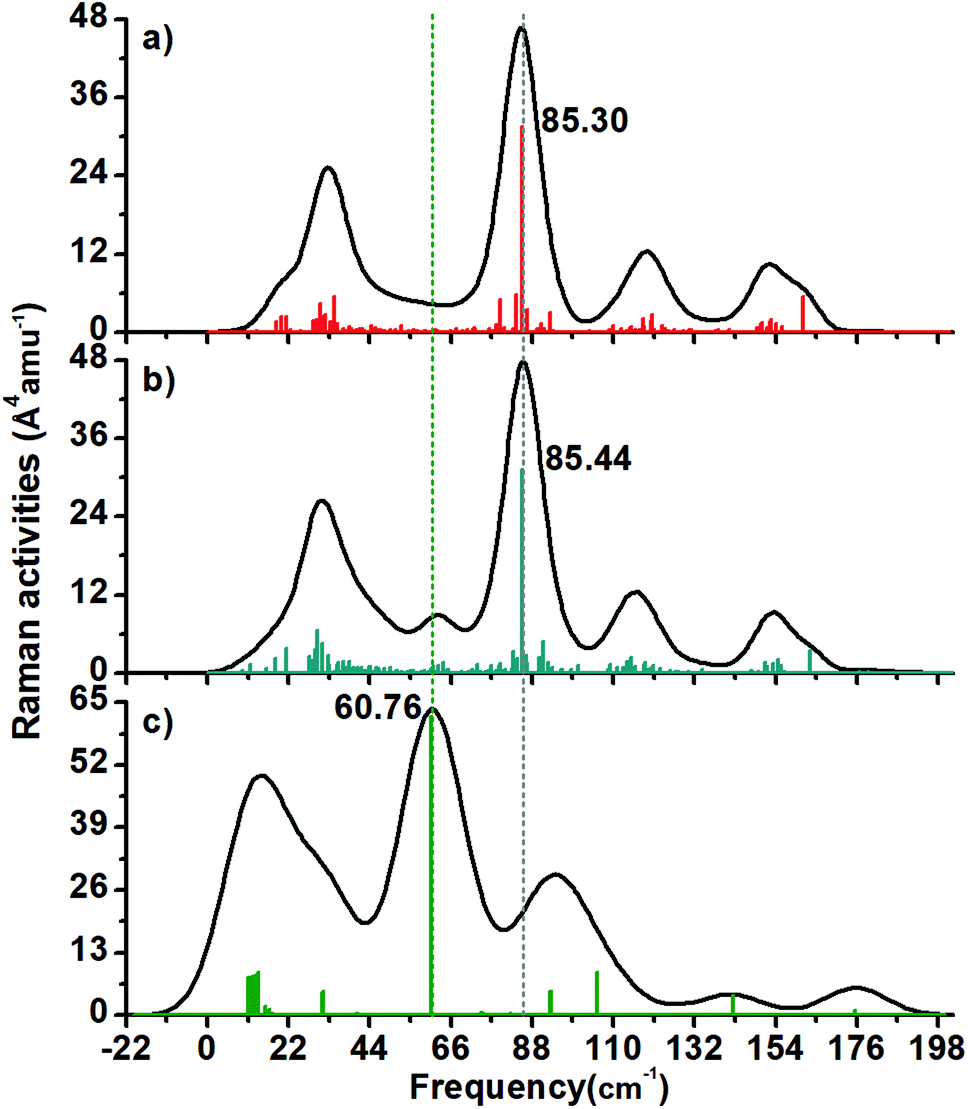 | ||
| Fig. 6 Calculated Raman spectra of (a) 2+, (b) 1− and (c) neutral Au60 clusters. Interestingly, the charged clusters have more related profiles compared against the neutral one. The anionic cluster has a satellite peak around 61 cm−1 and it is distinctive from the 2+ charged cluster. Both charged Au60 clusters have a maximum around 85 cm−1 and it is related to one radial normal mode. The maximum located at 60.76 cm−1 is the breathing mode of the neutral cluster. | ||
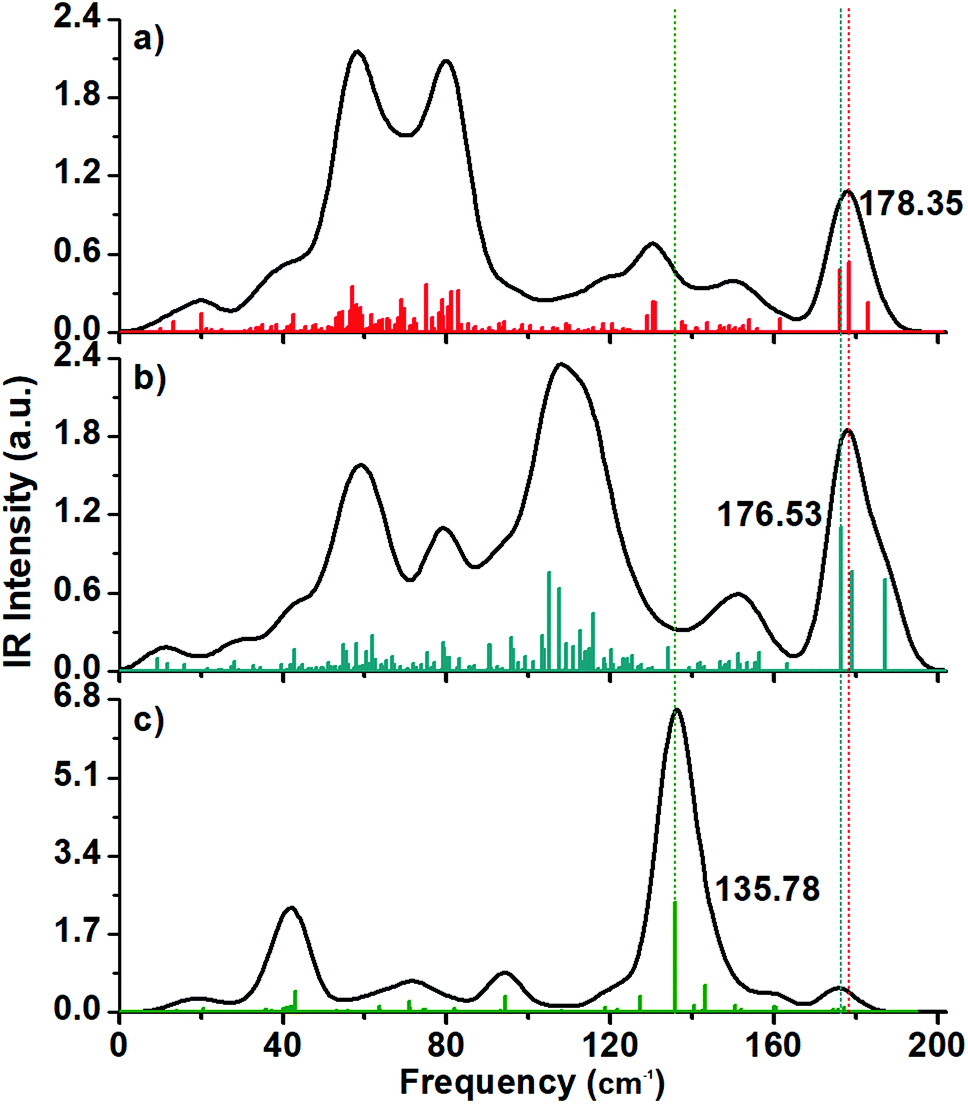 | ||
| Fig. 7 Calculated IR spectra of (a) 2+, (b) 1− and (c) neutral Au60 clusters. Charged clusters share peaks around 178 cm−1 related to the asymmetric vibration of the center of the inner Au13 shell, but the presence of one width peaks circa of 107.65 cm−1 is related to a breathing-like mode and is distinctive of the anionic cluster. In the case of the neutral cluster, the presence of one intense peak located at 135.78 cm−1 is associated to tangential normal modes. | ||
I. Raman spectra
It was found that the Raman spectra of the three studied structures have 4–6 peaks. The 2+ structure (Fig. 6a) has four peaks with a maximum located circa 85.30 cm−1 (this is a radial normal mode).In the case of the 1− cluster, there is a peak around 61 cm−1 that is not present in the 2+ cluster (Fig. 6b).
The neutral Au60 cluster (Fig. 6c) depicts an intense peak circa of 60.76 cm−1 and it corresponds with its breathing mode. This value is close to the Au4 inner core vibration normal mode found at circa 67.7 cm−1 in the thiolated-protected Au4(SR)4 cluster holding a planar shape.35
On the other hand, the Au13 breathing mode was reported as 103.8 cm−1 in the Ci-symmetric thiolated Au25 cluster.35 Recently, a study of the charge effect in the breathing mode of the protected Au13 cluster was carried out. It was found that the [Au13(dmpe)5Cl2]3+ structure had a less distorted Au13 core and it featured a 101.16 cm−1 frequency value, while the 1+ charged cluster was heavy distorted and sustaining a 99.54 cm−1 value for the breathing mode.36 In this study, the Raman spectrum of the compact-like structure does not have an intense peak that can be attributed to the breathing mode. This means that the Au13 inner core is not surrounded by an isotropic arrangement of gold atoms and therefore the symmetric mode is not stimulated. Instead, the IR spectrum of the 1− charged cluster has a peak around the expected frequency of the breathing mode (105 cm−1).
II. IR spectra
The calculated IR spectra have peaks included in the range from 0 to 200 cm−1 with the charged structures (Fig. 7a and b) having more peaks than in the Raman spectra.In general, the charged structures have different IR profiles, for example, the 2+ structure have a pair of intense peaks located at the 50–80 cm−1 frequency range, while the 1− structure has s string peak located at circa 107.65 cm-1. The IR active mode of the anionic cluster is an intense peak around 107.65 cm−1, and this normal mode involves the inner Au13 core and the outer shell.
The IR spectrum of the neutral (hollow) cluster has a dominant maximum located at circa 136 cm−1 and it is related to tangential vibrations on the shell (Fig. 7c).
The presence of the IR peaks is due to asymmetric normal modes while the Raman spectrum is a consequence of symmetric normal modes. The breathing mode being a symmetric normal mode, needs of a structure with atoms distributed in an isotropic manner. In the case of the distorted structures, this vibration mode can vanish in the Raman spectrum but can be enhanced in the IR spectrum. This is what happened in the case of the breathing mode of the inner Au13 core of the anionic Au60 cluster and its breathing-like IR active mode resulted in an enhanced peak located at 107.65 cm−1.
Conclusions
In this study, were determined different topologies, electronic and vibrational properties, for the anionic, neutral and cationic isomers of the Au60 cluster.The vibrational calculations attested the minima nature of the hollow and neutral structures being free of imaginary frequencies.
Further structural analysis of the compact-like structure (Cs symmetry) resulted in the decomposition of the whole structure in 12 octahedral and 77 tetrahedral blocks. Interestingly, only the compact-like structure is able to sustain 1−, 1+, and 2+ charge states (no imaginary frequencies). For the zero-charge state, a high I-symmetric (hollow) structure is found whose breathing mode frequency is close to the calculated value for one planar thiolated gold cluster.
Regarding the used polyhedral approach analysis, its grade of detail is remarkable in the calculated angles and bond distances; the implementation of the polyhedral block's analysis let us distinguish/determine among a pair of charged Au60 clusters even when they hold the same point group.
Finally, the 2+ charged cluster has less distorted polyhedral blocks than those constituting the 1− cluster, and the 2+ features a larger HL gap. However, the anionic Au60 cluster, has an intense IR signal corresponding with an asymmetric breathing-like mode. This means that the IR spectra of both charged Au60 clusters have more characteristic peaks allowing one to distinguish among both charged states.
Conflicts of interest
There are no conflicts to declare.Acknowledgements
The authors thankfully acknowledge the computer resources, technical expertise and support provided by the Laboratorio Nacional de Supercómputo del Sureste de México, CONACyT network of national laboratories.References
- I. Chakraborty and T. Pradeep, Chem. Rev., 2017, 117(12), 8208–8271 CrossRef CAS PubMed.
- A. Taketoshi and M. Haruta, Chem. Lett., 2014, 43, 380–387 CrossRef CAS.
- J. F. Parker, C. A. Fields-Zinna and R. W. Murray, Acc. Chem. Res., 2010, 43, 1289–1296 CrossRef CAS.
- H. Qian, M. Zhu, Z. Wu and R. Jin, Acc. Chem. Res., 2012, 45, 1470–1479 CrossRef CAS PubMed.
- P. Maity, S. Xie, M. Yamauchi and T. Tsukuda, Nanoscale, 2012, 4, 4027–4037 RSC.
- Y. Negishi, N. K. Chaki, Y. Shichibu, R. L. Whetten and T. Tsukuda, J. Am. Chem. Soc., 2007, 129, 11322–11323 CrossRef CAS PubMed.
- Y. Atom, A. Hayashi, H. Koga, K. Tada, T. Kawakami, S. Yamanaka and M. Okumura, J. Comput. Chem., 2019, 40, 222–228 CrossRef PubMed.
- W. D. Knight, K. Clemenger, W. A. de Heer, W. A. Saunders, M. Y. Chou and M. L. Cohen, Phys. Rev. Lett., 1984, 52, 2141–2143 CrossRef CAS.
- R. E. Leuchtner, A. C. Harms and A. W. Castleman Jr., Chem. Phys., 1989, 91, 2753–2754 CAS.
- P. Jena, S. N. Khanna and B. K. Rao, Surf. Rev. Lett., 1996, 3, 993–999 CrossRef CAS.
- Z. Luo and A. W. Castleman, Acc. Chem. Res., 2014, 47, 2931–2940 CrossRef CAS PubMed.
- W. Castleman, Jr. and S. N. Khanna, J. Phys. Chem. C, 2009, 113, 2664–2675 CrossRef.
- A. Tlahuice-Flores, J. Phys. Chem. C, 2019, 123, 10831–10841 CrossRef CAS.
- A. J. Karttunen, M. Linnolahti, T. A. Pakkanen and P. Pyykko, Chem. Commun., 2008, 465–467 RSC.
- S.-M. Mullins, H.-C. Weisker, R. Sinha-Roy, J. J. Pelayo, I. L. Garzón, R. L. Whetten and X. López-Lozano, Nat. Commun., 2018, 9, 3352–3360 CrossRef PubMed.
- S. Pande, X. Gong, L.-S. Wang and X.-C. Zeng, J. Phys. Chem. Lett., 2019, 10, 1820–1827 CrossRef CAS PubMed.
- A. Tlahuice-Flores, D. M. Black, S. B. H. Bach, M. Jose-Yacaman and R. L. Whetten, Phys. Chem. Chem. Phys., 2013, 15, 19191–19195 RSC.
- H. Ning, J. Wang, Q.-M. Ma, H. Y. Han and Y. Liu, J. Phys. Chem. Solids, 2014, 75, 696–699 CrossRef CAS.
- Y. Song, F. Fu, J. Zhang, J. Chai, X. Kang, P. Li, S. Li, H. Zhou and M. Zhu, Angew. Chem., Int. Ed., 2015, 54, 8430–8434 CrossRef CAS PubMed.
- W. D. Knight, K. Clemenger, W. A. de Heer, W. A. Saunders, M. Y. Chou and M. L. Cohen, Phys. Rev. Lett., 1984, 52, 2141–2143 CrossRef CAS.
- R. E. Leuchtner, A. C. Harms and A. W. Castleman Jr., Chem. Phys., 1989, 91, 2753–2754 CAS.
- P. Jena, S. N. Khanna and B. K. Rao, Surf. Rev. Lett., 1996, 3, 993–999 CrossRef CAS.
- Z. Luo and A. W. Castleman, Acc. Chem. Res., 2014, 47, 2931–2940 CrossRef CAS PubMed.
- W. Castleman, Jr. and S. N. Khanna, J. Phys. Chem. C, 2009, 113, 2664–2675 CrossRef.
- J. Wang, J. Jellinek, J. Zhao, Z. Chen, R. B. King and P. von R. Schleyer, J. Phys. Chem. A, 2005, 109, 9265–9269 CrossRef CAS PubMed.
- F. Neese, Wiley Interdiscip. Rev.: Comput. Mol. Sci., 2012, 2, 73–78 CAS.
- P. Perdew, K. Burke and M. Ernzerhof, Phys. Rev. Lett., 1996, 77, 3865–3868 CrossRef PubMed.
- F. Weigend and R. Ahlrichs, Phys. Chem. Chem. Phys., 2005, 7, 3297–3305 RSC.
- M. Dolg, H. Stoll and H. Preuss, J. Chem. Phys., 1989, 90, 1730–1734 CrossRef CAS.
- S. Grimme, S. Ehrlich and L. Goerigk, J. Comput. Chem., 2011, 32, 1456–1465 CrossRef CAS PubMed.
- S. Grimme, J. Antony, S. Ehrlich and H. Krieg, J. Chem. Phys., 2010, 132, 154104 CrossRef PubMed.
- POV-Ray Home Page, available via the Internet at: https://www.povray.org, accesed Sep. 26, 2020.
- J. A. Morales-Vidales, S. A. Sandoval Salazar, J. M. Jacobo-Fernández and A. Tlahuice-Flores, J. Chem. Educ., 2020, 97(4), 1017–1025 CrossRef CAS.
- P. P. Gruene, D. M. Rayner, B. Redlich, A. F. G. van der Meer, J. T. Lyon, G. Meijer and A. Fielicke, Science, 2008, 321, 674–676 CrossRef CAS PubMed.
- A. Tlahuice-Flores, R. L. Whetten and M. Jose-Yacaman, J. Phys. Chem. C, 2013, 117, 12191–12198 CrossRef CAS.
- A. Wing-Bocanegra and A. Tlahuice-Flores, Phys. Chem. Chem. Phys., 2019, 21, 23855–23864 RSC.
Footnote |
| † Electronic supplementary information (ESI) available: Distribution of the polyhedral building blocks in the 2+ Au60 cluster Cartesian coordinates of the studied structures. See DOI: 10.1039/d0cp04393a |
| This journal is © the Owner Societies 2021 |