 Open Access Article
Crystal growth and thermodynamic investigation of Bi2M2+O4 (M = Pd, Cu)
Nora
Wolff
 *a,
Detlef
Klimm
 b,
Klaus
Habicht
ac and
Katharina
Fritsch
 a
a
aHelmholtz-Zentrum Berlin für Materialien und Energie, Hahn-Meitner-Platz 1, 14109 Berlin, Germany. E-mail: nora.wolff@helmholtz-berlin.de
bLeibniz-Institut für Kristallzüchtung, Max-Born-Str. 2, 12489 Berlin, Germany
cInstitut für Physik und Astronomie, Universität Potsdam, Karl-Liebknecht-Straße 24-25, 14476 Potsdam, Germany
First published on 15th April 2021
Abstract
Phase equilibria that are relevant for the growth of Bi2MO4 have been studied experimentally, and the ternary phase diagrams of Bi2O3–PdO2–Pd and Bi2O3–Cu2O–CuO and its isopleth section Bi2O3–CuO were redetermined. It is shown that every melting and crystallization process is always accompanied by a redox process at the phase boundary and that for both title compounds, the valence of the transition metal is lowered during melting. Vice versa, during crystal growth, O2 must be transported through the melt to the phase boundary. Based on these new insights provided by our thermodynamic studies, Bi2CuO4 single crystals with a length of up to 7 cm and a diameter of 6 mm were grown by the OFZ technique to be used for investigations of magnetic, electronic and thermal transport properties. The grown crystals were characterized by powder X-ray diffraction, Laue, magnetization and specific heat measurements.
1 Introduction
Over the last decades, transition-metal (M) oxides containing MO4 square-planar environments in their structure have attracted interest due to their fascinating structure based electronic and magnetic properties.1,2 Compared to tetrahedral and octahedral coordination, the square planar geometry is rarely found in transition metal oxides because it is thermodynamically less stable.1,3 However, MO4 square planar coordination is typically encountered in d8 and d9 electron configurations, for example in Pd, Pt or Cu-based compositions, where it is favorable for electronic ground states.1 The structure of Bi2M2+O4 (M = Pd, Cu) is composed of such MO4 units forming staggered chains along the c-axis.2In the past few decades, Bi2CuO4 has been extensively studied and has first come into the focus of the high temperature superconductivity community as a non-superconducting structural relative due to its shared CuO4 motifs.4 Since then, it continues to be of fundamental interest as a low-dimensional S = 1/2 Heisenberg antiferromagnet exhibiting a plethora of intriguing phenomena including controversially discussed low-temperature anisotropic magnetic ground state properties that have been studied by bulk magnetization,2 Raman,5 antiferromagnetic resonance6 or neutron scattering techniques,7 the observation of magnetically-induced ferroelectricity,8 and a recent prediction of the realization of a topologically non-trivial double-Dirac metal in Bi2CuO4 under pressure.9 In addition, Bi2CuO4 has recently been investigated as a photocathode material for photoelectrochemical water splitting10,11 or even for gas-sensing applications.12
The isostructural system Bi2PdO4 has also recently attracted attention following experimental and theoretical work on the thermoelectric properties of similar oxide materials with square planar PdO4 units.13,14 Theoretical work by He et al.15 proposed favorable thermoelectric properties of Bi2PdO4 arising from a combination of its peculiar electronic band structure mainly related to the involved Pd2+ dz2 orbitals and a low lattice thermal conductivity. The latter has been ascribed to the presence of heavy Bi3+ ions in the crystal structure whose 6s2 electron lone pairs are thought responsible for contributing to additional phonon scattering and anharmonic effects.
The tetragonal P4/ncc crystal structure of Bi2MO4, which is shown in Fig. 1, consists of square-planar MO4 units and asymmetrically distorted BiO6 octahedra.15,16 The MO4 units are stacked along the c-axis, forming tunnels along [001] and [110] with the BiO6 octahedra.15
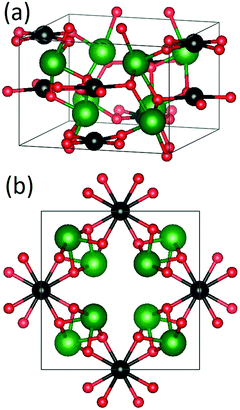 | ||
| Fig. 1 (a) 3D tetragonal crystal structure of Bi2MO4 and (b) projection along the c-axis (green = Bi, black = Cu/Pd, red = O) (drawn with VESTA30). | ||
In order to study magnetic, electronic or thermal transport properties in detail at a fundamental level, the use of large high quality single crystals (of either Bi2CuO4 or Bi2PdO4) is required. Knowledge of the thermodynamic processes and the relevant phase diagrams are essential for crystal growth.
Despite numerous studies on the crystal structure and low temperature magnetic properties of Bi2CuO4 in the past,2,8,17–20 there is still no consensus on the Bi2O3–CuO phase diagram and thus the growth conditions required for large, centimeter-sized, high quality Bi2CuO4 single crystals. In the existing literature, the phase diagrams are very contradictory21–29 and often the growth conditions are insufficiently detailed.
The phase diagram of Bi2PdO4 was proposed in 1979 by Kakhan et al.22 and apart from the work by Arpe and Müller-Buschbaum16 on that system discussing single crystal X-ray diffraction on tiny single crystal samples, to our knowledge no reports on crystal growth of larger single crystals, growth conditions or detailed thermodynamic investigation of Bi2PdO4 exist.
The present work therefore focuses on the thermodynamic investigations and the crystal growth of Bi2M2+O4 (M = Cu, Pd). Phase diagrams that are relevant for the growth of the title compounds are redetermined. We will show that pseudobinary systems of Bi2O3–CuO (–PdO) are insufficient to describe the growth process, rather Cu2O (or Pd, respectively) has to be included for a satisfactory description of the experimental results. Redox processes that occur at the phase boundary during melting and crystallization of the Bi2MO4 phase were investigated. The grown crystals were characterized by powder X-ray diffraction (XRD), Laue, magnetization and specific heat measurements, demonstrating the excellent quality of the crystals synthesized in this work.
2 Experimental
2.1 Thermodynamics
Investigations on the pseudobinary Bi2O3–CuO and the ternary Bi2O3–Cu2O–CuO phase diagrams are based on powder mixtures of the raw materials with concentrations between pure Bi2O3 (Sigma-Aldrich, 5N purity) and 80 mol% CuO (Alfa Aesar, 2N7 purity) in Bi2O3. Simultaneous thermogravimetric (TG) and differential thermal analysis (DTA) measurements (TG–DTA) were carried out with a Netzsch STA 409C on the powder mixtures placed in Al2O3 crucibles in air at heating and cooling rates of 10 K min−1. In addition, a grown Bi2CuO4 single crystal was measured using a Netzsch STA 449 F3 with differential scanning calorimetry (DSC–TG) and the sample was placed in a platinum crucible with a lid. For this measurement, an oxygen-enriched atmosphere with flowing 66.7% O2 + 33.3% Ar and heating and cooling rates of 5 K min−1 were used.The study of the thermodynamic properties of Bi2PdO4 was carried out on phase pure Bi2PdO4 powder obtained by the solid state reaction of a mixture in a stoichiometric ratio of Bi2O3 (Sigma-Aldrich, 5N purity) and PdO (Alfa Aesar, 3N purity), sintered three times for 24 h at 740 °C in air with intermediate grindings. Phase purity was confirmed by powder XRD under ambient conditions. TG–DTA measurements were carried out with a Netzsch STA 449 F3 in platinum crucibles at heating and cooling rates of 10 K min−1. The gas flow was set using a mass flow controller to deliver atmospheres containing 10%, 20%, 80% and 100% O2 in Ar, respectively. The phase composition was additionally studied by means of high temperature XRD measurements performed in air up to 1000 °C using a Bruker D8 Advance diffractometer with Cu-Kα radiation, equipped with a high temperature oven chamber (Anton Paar HTK 1200 N) and a LynxEye detector for rapid data acquisition.
2.2 Crystal growth
In preparation for the crystal growth, polycrystalline rods of Bi2CuO4 were prepared by mixing Bi2O3 and CuO powders in a 1![[thin space (1/6-em)]](https://www.rsc.org/images/entities/char_2009.gif) :
:![[thin space (1/6-em)]](https://www.rsc.org/images/entities/char_2009.gif) 1 molar ratio followed by sintering in air for 24 h at 725 °C. After this first sintering step, the powder was ground in an agate mortar and sintered again for 24 h at 750 °C. XRD phase analysis confirmed that a single-phase, pure Bi2CuO4 phase resulted from this annealing process. The sintered material was then reground and compacted in cylindrical rubber balloons and pressed for three minutes at 2 kbar in a cold isostatic press (Engineered Pressure International NV, Belgium). To increase the rod density, the pressed rods were sintered again for 24 h at 750 °C. The final rods were on average about 11 cm long and 6 mm in diameter and had an estimated density of 85% of the theoretical value.
1 molar ratio followed by sintering in air for 24 h at 725 °C. After this first sintering step, the powder was ground in an agate mortar and sintered again for 24 h at 750 °C. XRD phase analysis confirmed that a single-phase, pure Bi2CuO4 phase resulted from this annealing process. The sintered material was then reground and compacted in cylindrical rubber balloons and pressed for three minutes at 2 kbar in a cold isostatic press (Engineered Pressure International NV, Belgium). To increase the rod density, the pressed rods were sintered again for 24 h at 750 °C. The final rods were on average about 11 cm long and 6 mm in diameter and had an estimated density of 85% of the theoretical value.
All growth experiments were carried out in an optical floating-zone (OFZ) furnace from Crystal System Corporation (type FZ-T-10000-H-VI-VPO) using polycrystalline feed and seed rods. The furnace consists of a four-mirror setup in which 300 W halogen lamps and a fused silica protection tube were used. For Bi2CuO4, an air flow of 0.3 l min−1 was used as the growth atmosphere, and the Bi2PdO4 growth experiments were done in a flowing oxygen atmosphere (because the TG measurements in Fig. 5 revealed a significantly stronger tendency to lose oxygen for this compound). Seed and feed rods were rotated in opposite directions at 30 rpm and at 20 rpm, respectively. To ensure stable growth conditions without cracks, growth rates between 5 and 6 mm h−1 were employed.
The grown crystals were characterized by XRD and Laue measurements. XRD data on crushed single crystal pieces mixed with a LaB6 standard were used to determine the lattice parameters of the grown crystals. Magnetization measurements using a Magnetic Property Measurement System (MPMS by Quantum Design Inc.) were carried out between 1.9 K and 350 K on two single crystals with a mass of 40.79 mg and 19.0 mg with a magnetic field applied along the c or a axis, respectively, for comparison with previously published results and for confirmation of the crystal quality. Low temperature specific heat data between 2 and 100 K were collected in zero field with the standard adiabatic-relaxation technique using the heat capacity option of a Physical Property Measurement System (PPMS by Quantum Design Inc.) on a 7.95 mg sample.
The crystal growth of Bi2PdO4 in the OFZ was also attempted. For this, polycrystalline rods were prepared from a powder mixture of stoichiometric ratios of Bi2O3 and PdO that were sintered 2 times at 740 °C in air with intermediate grindings until a single-phase Bi2PdO4 powder was obtained. The feed and seed rods were then prepared analogously to those of Bi2CuO4 and underwent a final sintering step at 740 °C. The rods were 6 cm long and 6 mm in diameter. The density of the rods was estimated as 75% of the theoretical density, resulting in slightly less compact rods than those of Bi2CuO4.
3 Results and discussion
3.1 Thermodynamics
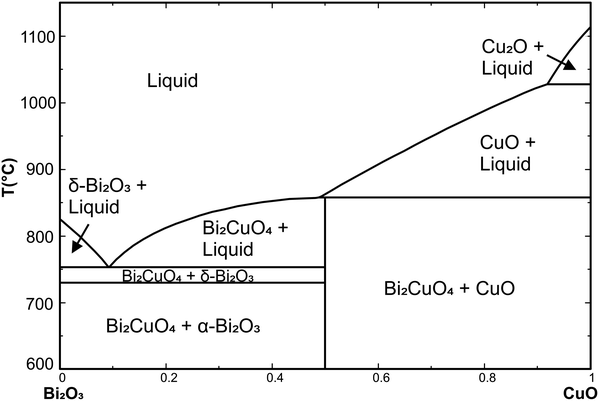
From our previous investigations on copper oxide compounds, it is known that copper oxide based melts always contain Cu+ and Cu2+.31–34 Bi2CuO4 contains Cu2+ which is stabilized by low temperature T and high oxygen partial pressure p(O2) which are the conditions where DTA with powder mixtures of Bi2O3 and CuO was performed. For powders with a CuO concentration of 0 ≤ x ≤ 0.5, two endothermal effects with constant onsets at Tt = 732 ± 5 °C and Teut = 761 ± 5 °C were found, originating from the α–δ transition of Bi2O3 (ref. 35) and the eutectic of Bi2O3 with Bi2CuO4, respectively. The position of the liquidus could be derived from a bend in the DTA curve only for some samples.
Samples with x > 0.45 showed one clear endothermal effect around Tper = 851 ± 10 °C which could be attributed to the (almost, see below) peritectic melting of Bi2CuO4. However, the width of this DTA peak (ΔT ≈ 40 K) did not allow us to discriminate if this effect is really related to peritectic decomposition (like suggested by Hrovat and Kolar23) or to congruent melting of Bi2CuO4 with another eutectic towards CuO which is just 5 K below the congruent melting point (like suggested by Kakhan et al.36).
Despite this ambiguity, these preliminary results allowed successful OFZ growth experiments with 1![[thin space (1/6-em)]](https://www.rsc.org/images/entities/char_2009.gif) :
:![[thin space (1/6-em)]](https://www.rsc.org/images/entities/char_2009.gif) 1 (molar) Bi2O3
1 (molar) Bi2O3![[thin space (1/6-em)]](https://www.rsc.org/images/entities/char_2009.gif) :
:![[thin space (1/6-em)]](https://www.rsc.org/images/entities/char_2009.gif) CuO rods. A small (24.66 mg) Bi2CuO4 single crystal that resulted from the growth experiments was investigated in more sensitive DSC–TG measurements in an atmosphere with a higher oxygen concentration to stabilize Cu2+. The results are shown in Fig. 2. During the first heating, the melting peak of the Bi2CuO4 compound appears at 855 °C and is connected with a mass loss of Δm/m = −0.41% in the associated TG curve. Bi3+ can be considered to be stable under the experimental conditions used here. Then, the experimental Δm/m can be attributed to a formal reaction Bi2CuO4 → Bi2O3 + CuO0.86 + 0.07 O2, because 0.07 O2 corresponds to a mass loss of 0.41% (some Cu2+ is reduced to Cu+). One can assume that Cu2+ is stabilized in solid Bi2CuO4 and exists in equilibrium with Cu+ in the melt, with a composition that is close to the eutectic composition in the Cu2O–CuO system.37
CuO rods. A small (24.66 mg) Bi2CuO4 single crystal that resulted from the growth experiments was investigated in more sensitive DSC–TG measurements in an atmosphere with a higher oxygen concentration to stabilize Cu2+. The results are shown in Fig. 2. During the first heating, the melting peak of the Bi2CuO4 compound appears at 855 °C and is connected with a mass loss of Δm/m = −0.41% in the associated TG curve. Bi3+ can be considered to be stable under the experimental conditions used here. Then, the experimental Δm/m can be attributed to a formal reaction Bi2CuO4 → Bi2O3 + CuO0.86 + 0.07 O2, because 0.07 O2 corresponds to a mass loss of 0.41% (some Cu2+ is reduced to Cu+). One can assume that Cu2+ is stabilized in solid Bi2CuO4 and exists in equilibrium with Cu+ in the melt, with a composition that is close to the eutectic composition in the Cu2O–CuO system.37
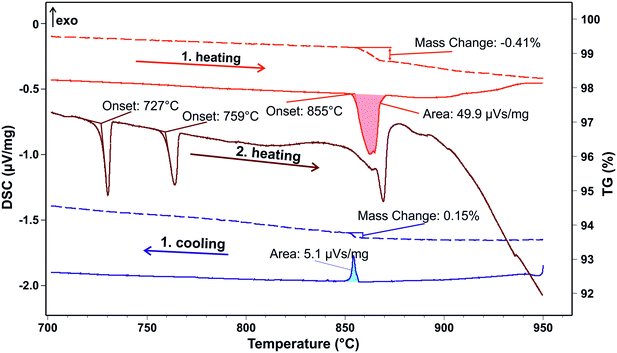 | ||
| Fig. 2 Bi2CuO4 single crystal TG–DSC measurement (1st and 2nd heating + 1st cooling at 5 K min−1) in flowing 66.7% O2 + 33.3% Ar. Solid lines: DSC, dashed lines: TG. | ||
This reduction process CuO → Cu2O continues with further heating, which means that overheating during a crystal growth experiment should be avoided. Experiments in a pure oxygen atmosphere are also not recommended because this increases the liquidus temperature (see Fig. 1 in ref. 37). During the cooling process, the sample gets partially reoxidized (Δm/m = +0.15%), connected with an additional small exothermal DTA peak. This is clearly not due to crystallization but results simply from the oxidation Cu2O +  O2 → 2CuO with ΔH = −8122 J per gram O2 (ref. 38) (the sensitivity calibration to convert the peak area of 5.1 μV s mg−1 to that enthalpy increment in Fig. 2 was performed at Tf = 801 °C by melting NaCl). Crystallization of the sample occurs with strong supercooling below 700 °C, which is out of the scale of this figure.
Clear evidence for the incongruent nature of melting Bi2CuO4 is obtained from the second heating of the same sample, which is shown by the middle curve in Fig. 2. The additional peak at Tt = 727 °C results from the α–δ transition of Bi2O3 (ref. 35) and the eutectic of Bi2O3 with Bi2CuO4, as observed in the previous TG–DTA measurements with unreacted powders.
If Bi2CuO4 were to melt congruently, these two additional peaks would not appear in a second heating run. It should be noted, however, that Bi2CuO4 is also not melting simply peritectically, because this would imply the formation of a melt under the release of another solid phase (which would be CuO here). Here, however, the gas phase is inevitably involved in the melting process.
Data from FactSage38 databases and from the literature37,39,40 for Bi2CuO4 and the CuOx–Bi2O3 melt were refined to describe the experimental data that are reported here, and an isopleth section CuO–Bi2O3 of the phase diagram was obtained (Fig. 3). The eutectic point was measured at around 7.5 mol% CuO and 761 °C, and is in good agreement with some literature data.27–29
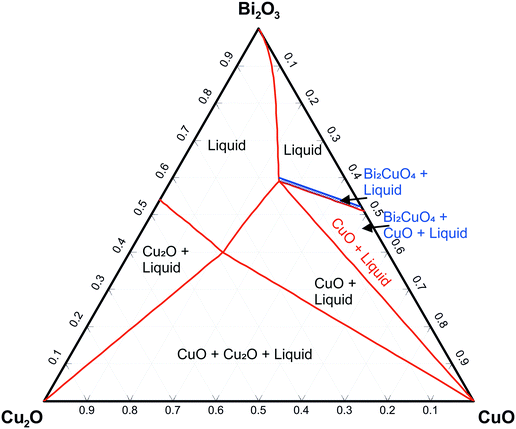
Fig. 4 shows the system as a concentration triangle of Bi2O3–Cu2O–CuO at elevated temperatures in air. The red lines show an isothermal section above Tper = 857 °C. On the Bi2O3–CuO side of the phase diagram, only the crystallization phase field of CuO is visible. Immediately below the peritectic temperature of 856 °C, the Bi2CuO4 crystallization phase field begins to expand (the blue phase field in Fig. 4). This field begins slightly above the 0.5 composition of pure Bi2CuO4, which indicates the peritectic melting of this phase.
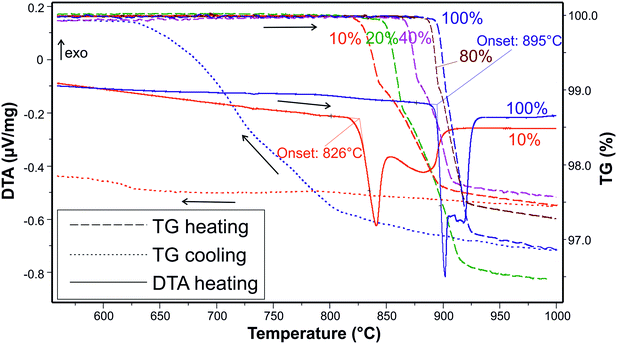
TG–DTA measurements in atmospheres containing between 10 and 100% oxygen revealed that the starting melting process (the onset of DTA curves) is always accompanied by a mass loss. Both effects shift to higher temperatures with increasing p(O2). For example, at 10% O2 (p(O2) = 0.1 bar), the melting and immediate PdO reduction starts at 826 °C while at 100% O2 the reaction starts at 895 °C (Fig. 5). The mass losses are only reversible under sufficiently high p(O2), e.g. under pure O2. Under low p(O2), the sample mass never returns to the original value, as shown by the red dotted line in Fig. 5.
These observations can be discussed on the basis of the simplified predominance diagram of Bi–Pd–O2 in Fig. 6 that was calculated with FactSage.38 Unfortunately, the target phase Bi2PdO4 itself is not contained in the given databases. To enable its appearance in the diagram, its thermodynamic data were approximated by the sum of the constituents Bi2O3 and PdO (Hess' law), with an additional formation enthalpy of −20 kJ mol−1. Another assumption had to be made regarding the molten phase (liq). For the calculation in Fig. 6, we assumed an ideal miscibility between Pd(liq) and Bi2O3(liq) because it is well accepted that palladium and silver behave similarly from the chemical point of view42 and bismuth oxide forms a eutectic with this metal, with a certain degree of miscibility between the liquid metal and oxide.43
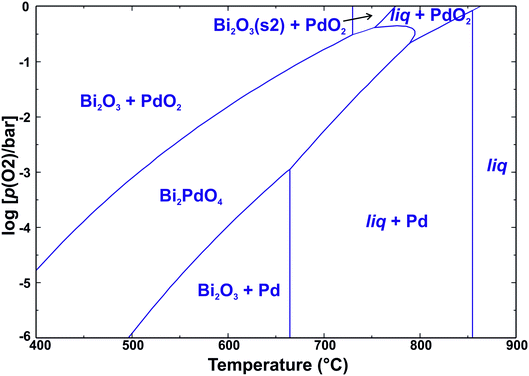 | ||
| Fig. 6 Phase stability in the system Bi–Pd–O2. An enthalpy of 20 kJ mol−1 was assumed for the reaction Bi2O3 + PdO → Bi2PdO4. | ||
The diagram shows that under the given experimental conditions, bismuth always exists as Bi3+. Palladium, in contrast, can exist as Pd4+, Pd2+, or as metallic Pd0. The formation of Bi2PdO4 stabilizes the divalent Pd2+ and free PdO does not appear in the predominance diagram because it dissociates above 800 °C.44 This also explains the observed mass loss during melting. A peritectic melting process Bi2PdO4 → PdO + liq would lead to a Bi2O3-rich melt under the release of solid PdO. In contrast, the melting observed here is described by the reaction Bi2PdO4 → Pd +  O2 + liq. This latter reaction cannot be reversed as easily as the first one because it requires the uptake of free oxygen from the atmosphere. Obviously, this is only possible in very oxygen rich atmospheres, but not for 10% O2 in Ar as shown in Fig. 5 for the blue and red dotted lines, respectively. In particular, the loss of one oxygen atom per formula unit of Bi2PdO4via PdO → Pd +
  O2 would result in a theoretical mass loss of 2.7% which is in good agreement with the TG curves in Fig. 5.
The stability of the phases in the system Bi–Pd–O2 as a function of the oxygen partial pressure and temperature can be qualitatively described in the predominance diagram as shown in Fig. 6. The vertical lines depict the different melting processes and the phase transition of Bi2O3 at 730 °C. In particular, the previously discussed melting of Bi2PdO4 corresponds to the phase boundary Bi2PdO4/liq + Pd.
High temperature XRD measurements revealed the presence of elemental Pd in the melt above 860 °C which does not dissolve even at higher temperatures. This elemental Pd makes the crystal growth method used in this work unsuitable, since Pd interferes in the melt zone. Alternative growth methods using a crucible could be advantageous for Bi2PdO4 but further research needs to be done on this.
For stable growth, it is crucial that the elemental Pd is reoxidized during crystallization. Our TG–DTA measurements showed that at least 80% O2 in the atmosphere is necessary to achieve complete reoxidation.
Typical binary Bi2O3–PdO phase diagrams from the literature41,22 must be used with caution because PdO is actually reduced, and is hence not a valid component of the system. Our TG–DTA measurements show that additional melting peaks in a second heating cycle occur even in 100% O2 (not shown in Fig. 5), irrespective of Pd seemingly being reoxidized during the first cooling. These additional peaks can be assigned to the Bi2O3 phase transition and the eutectic line, which in turn implies the peritectic melting of the Bi2PdO4 phase. However, the melting of Bi2PdO4 can only be viewed correctly in the Bi–Pd–O ternary system, since the melting and crystallization are connected to redox processes. It should be noted that the ternary system depends strongly on the atmospheric conditions. A complete thermodynamic assessment of this ternary system, which would adjust Fig. 6 quantitatively to the experimental data, is beyond the scope of this paper.
3.2 Crystal growth
The growth of Bi2CuO4 single crystals was performed by taking into account the results of our above-described thermodynamic investigations. Even though Bi2CuO4 melts incongruently (Fig. 3), higher growth rates (up to 6 mm h−1) than usually possible with incongruently melting compounds can be used. This is probably enabled by the strong tendency of the melt to supercooling, allowing crystal growth below the equilibrium melting temperature from a stoichiometric equimolar melt. XRD measurements of the initially crystallized material revealed that indeed not CuOx but Bi2CuO4 is formed. The growth of Bi2CuO4 from a stoichiometric melt is supported because it melts only slightly peritectically. It should be noted that in some other systems even Czochralski crystal growth proved to be possible significantly below the equilibrium melting point. Kouta et al. demonstrated the growth of β-BaB2O4 (stable below 920 °C) from a stoichiometric melt that is in equilibrium with the high-temperature α-BaB2O4 at 1095 °C, 175 K above that of the α–β transition.45A growth rate of >5.5 mm h−1 leads to a stable growth, and less cracks occur. So far, there are only a few publications on the crystal growth of Bi2CuO4 and in most works lower (typically 3 or 5 mm h−1 (ref. 8, 46)) or higher (10 mm h−1 (ref. 8, 46–48)) growth rates were used, which could be a reason for cracking. It is also described that a growth rate of 10 mm h−1 improves the growth process because the low surface tension of the melt is problematic, but the crystal quality is lower.8,46 In some experiments, excess CuO46 or a pure oxygen atmosphere8 was used, which is, as described in our Thermodynamics section, not advantageous for the growth. The experiments in this work showed that the growth is most stable and crack-free crystals are obtained at a rate of 6 mm h−1. When using polycrystalline seeds, however, the first grown 15–20 mm are always completely covered with cracks.
Although a growth rate of 6 mm h−1 leads to crack-free growth, the CuOx equilibrium in the melt cannot adjust fast enough. During the growth, CuO is removed from the melt, which leads to an increase in the Cu2O/CuO ratio. This in turn leads to an increase in the liquidus temperature (see Fig. 1 in ref. 37). Therefore, the lamp power must be adjusted continuously, even if only in very small steps, during the growth experiments. The typical power of 300 W lamps during an experiment was, for example, between 30.80–31.67%.
Taking into account the thermodynamic investigations of this work and based on the chosen growth parameters and instrumental conditions, it was possible to grow Bi2CuO4 crystals with lengths of up to 7 cm and diameters of 6 mm (Fig. 7). The crystals show a rough surface in the later stages of the growth which is probably related to Cu2O deposition. However, a clear proof of this assumption could not be provided by XRD and XRF measurements. Laue measurements along the crystal length show a constant orientation, which proves that the grown materials are single crystalline. The preferred growth direction of the crystals is along [120] (Fig. 7), but this is only the case in 3 of 4 grown crystals, and the cleavage is typically along (001), since the interatomic distances are larger in this direction, resulting in a weaker bond.18 The lattice parameters were refined using powder X-ray diffraction data on crushed single crystal pieces. It was found that Bi2CuO4 crystallizes in the tetragonal space group P4/ncc (130) with the lattice constants a = 8.501(1) Å and c = 5.818(4) Å, which are in good agreement with the crystal refinement by Yamada et al.18
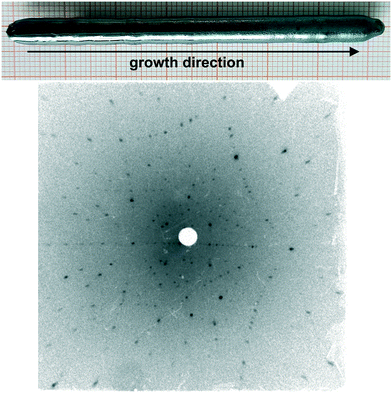 | ||
| Fig. 7 Bi2CuO4 single crystal with excess copper oxide on the surface in the later stages of the growth (top) and Laue measurement confirming the [120] growth direction (bottom). | ||
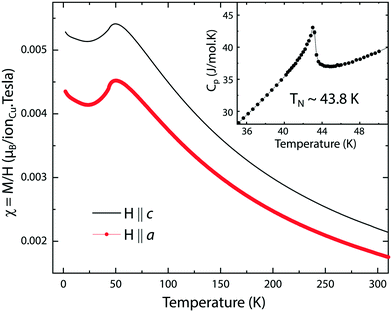
Magnetic susceptibility χ = M/H and specific heat data on the single crystal samples of Bi2CuO4 as a function of temperature are shown in Fig. 8. In agreement with earlier studies,8,18,49,50 the temperature dependence of the susceptibility upon cooling is characterized by an increase of χ(T) leading to a broad hump with a maximum in χ(T) at ∼50 K, followed by an abrupt drop at around 43.8 K signaling the onset of the long-range antiferromagnetic order at that temperature (i.e. the Néel temperature, TN), and by a further decrease before an upturn below about 25 K. The emergence of the long-range antiferromagnetic order at TN ∼ 43.8 K is further corroborated by the sharp λ-like anomaly in the specific heat (Fig. 8 inset) obtained in zero field. The magnetic susceptibility is, also consistent with earlier reports,8,18,50 anisotropic with a larger susceptibility along the c axis than along directions perpendicular to it, and it is highly field-dependent for applied fields of <1 T along the a axis below TN (not shown here). Our magnetization and specific heat data therefore show that our Bi2CuO4 single crystals are of high crystalline quality.
It was not possible to grow Bi2PdO4 crystals by the OFZ technique, because the elemental Pd prevents the formation of a melt zone (as discussed in the Thermodynamics section).
4 Summary and conclusions
Phase equilibria that are relevant for the growth of the title compounds were studied experimentally, and a semiquantitative description in terms of the ternary systems Bi2O3–CuO–Cu2O or Bi2O3–PdO2–Pd, respectively, was given. High-quality Bi2CuO4 single crystals with lengths of up to 7 cm and diameters of 6 mm were grown by the OFZ technique. Based on the results of the Laue, magnetization and specific heat measurements, we confirm the excellent quality of our grown samples. The growth of Bi2PdO4 by the OFZ technique is precluded, since the elemental Pd prevents the formation of a melt zone and other techniques such as the Czochralski method should be used for the growth of this material.It could be shown that pseudobinary systems of Bi2O3–CuO (–PdO) are insufficient to describe the growth process, because every crystallization or melting process of the Bi2M2+O4 phase is accompanied by a redox process that can only be accounted for in the ternary systems. The melting processes of Bi2CuO4 and Bi2PdO4 are often called “peritectic”, which is not totally true: a peritectic reaction follows the scheme solid (1) → solid (2) + melt. In contrast, the melting/crystallization of the compounds in this study has the scheme Bi2CuO4 ⇄ CuO + (Bi2O3 + CuOx) melt + O2 or Bi2PdO4 ⇄ Pd + (Bi2O3 + Pd) melt + O2 under the involvement of the gas phase. We recommend for this type of melting the term “exaperitectic” (greek: εξατμιση = to exhaust).
For both title compounds, the valence state of the transition metal is lowered during melting (Cu2+ → Cu2+ + Cu+ or Pd2+ → Pd0) under the release of free oxygen. Consequently, O2 must be transported through the melt to the phase boundary during the crystal growth process to ensure the crystallization of high-quality stoichiometric Bi2CuO4 and Bi2PdO4. This is a process that limits the growth rate. When using a growth rate of 6 mm h−1, as in the case of our Bi2CuO4 growth experiments, the CuOx equilibrium in the melt cannot adjust fast enough, which leads to an increase of the liquidus temperature. During this growth process, the lamp power needs to be adjusted continuously. In the case of Bi2PdO4, other growth techniques are recommended, as the reoxidation of the elemental Pd needs more time and besides the formation of a melt zone is prevented.
Conflicts of interest
The authors declare no conflict of interest.Acknowledgements
The use of HZB's X-ray Corelab and the Corelab for Quantum Materials is acknowledged. We thank R. Gunder, K. Siemensmeyer and R. Feyerherm for technical support and N. Islam and K. Karmakar for helpful discussions on the OFZ setup. J.-E. Hoffmann is thanked for technical support with the TG–DTA setup.References
- M. A. Hayward, Inorg. Chem., 2019, 58, 11961–11970 CrossRef CAS PubMed.
- J. L. Garcia-Munoz, J. Rodriguez-Carvajal, F. Sapina, M. J. Sanchis, R. Ibanez and D. Beltran-Porter, J. Phys.: Condens. Matter, 1990, 2, 2205–2214 CrossRef CAS.
- S. Kanungo, B. Yan, P. Merz, C. Felser and M. Jansen, Angew. Chem., Int. Ed., 2015, 54, 1–5 CrossRef PubMed.
- K. Yoshii, T. Fukuda, H. Akahama, J. Kano, T. Kambe and N. Ikeda, Phys. C, 2011, 471, 766–769 CrossRef CAS.
- Z. V. Popovic, G. Kliche, M. J. Konstantinovic and A. Revcolevschi, J. Phys.: Condens. Matter, 1992, 2, 10085–10092 CrossRef.
- L. E. Svistov, V. A. Chubarenko, A. Y. Shapiro, A. V. Zalesskii and G. A. Petrakovskii, J. Exp. Theor. Phys., 1998, 86, 1228–1233 CrossRef.
- B. Yuan, N. P. Butch, G. Xu and Y.-J. Kim, 2019, arXiv, 1907.07784, pp. 2406–2414 Search PubMed.
- L. Zhao, H. Guo, W. Schmidt, K. Nemkovski, M. Mostovoy and A. C. Komarek, Phys. Rev. B, 2017, 96, 054424 CrossRef.
- D. Di Sante, P. Hausoel, A. Barone, J. M. Tomczak, G. Sangiovanni and R. Thomale, Phys. Rev. B, 2017, 96, 121106 CrossRef.
- S. P. Berglund, F. F. Abdi, A. Bogdanoff, P. Chemseddine, D. Friedrich and R. van de Krol, Chem. Mater., 2016, 28, 4231–4242 CrossRef CAS.
- N. Xu, F. Li, L. Gao, H. Hu, Y. Hu, X. Long, J. Ma and J. Jin, ACS Sustainable Chem. Eng., 2018, 6, 7257–7264 CrossRef CAS.
- Y.-H. Choi, D.-H. Kim and S.-H. Hong, ACS Appl. Mater. Interfaces, 2018, 10, 14901–14913 CrossRef CAS PubMed.
- L. K. Lamontagne, G. Laurita, M. W. Gaultois, M. Knight, L. Ghadbeigi, T. D. Sparks, M. E. Gruner, R. Pentcheva, C. M. Brown and R. Seshadri, Chem. Mater., 2016, 28, 3367–3373 CrossRef CAS.
- T. C. Ozawa, T. Taniguchi, Y. Nagata, Y. Noro, T. Naka and A. Masushita, J. Alloys Compd., 2005, 388, 1–5 CrossRef CAS.
- J. He, S. Hao, Y. Xia, S. S. Naghavi, V. Ozolins and C. Wolverton, Chem. Mater., 2017, 29, 2529–2534 CrossRef CAS.
- R. Arpe and H. Müller-Buschbaum, Z. Naturforsch., 1976, 31b, 1708–1709 CrossRef CAS.
- J. P. Attfield, J. Phys.: Condens. Matter, 1989, 1, 7045 CrossRef CAS.
- K. Yamada, K. Takada, S. Hosoya, Y. Watanabe, Y. Endoh, N. Tomonaga, T. Suzuki, T. Ishigaki, T. Kamiyama, H. Asano and F. Izumi, J. Phys. Soc. Jpn., 1991, 60, 2406–2414 CrossRef CAS.
- K. Sreedhar, J. Phys. C: Solid State Phys., 1129, 21, 1129 CrossRef.
- R. Troc, J. Janicki, I. Filatow, P. Fischer and A. Murasik, J. Phys.: Condens. Matter, 1990, 2, 6989–6998 CrossRef CAS.
- J. Cassedanne and C. P. Campelo, An. Acad. Bras. Cienc., 1966, 38, 35–38 CAS.
- B. G. Kakhan, V. B. Lazarev and I. S. Shaplygin, Zh. Neorgan. Khim., 1979, 24, 1663–1668 CAS.
- M. Hrovat and D. Kolar, J. Mater. Sci. Lett., 1984, 3, 659–662 CrossRef CAS.
- J. C. Boivin, D. J. Thomas and G. Tridot, C. R. Seances Acad. Sci., Ser. C, 1973, 276, 1105–1107 CAS.
- Z. K. Huang, Y. X. Jia, J. X. Chen, P. L. Wang, R. F. Huang and D. S. Yan, Wuji Cailiao Xuebao, 1990, 5, 375–376 CAS.
- M. P. Kulakov and D. Y. Lenchienko, Thermochim. Acta, 1991, 188, 129–133 CrossRef CAS.
- M. Nevriva, H. Kraus and D. Sedmidubsky, Thermochim. Acta, 1996, 282/283, 205–224 CrossRef CAS.
- J. Sestak, D. Sedmidubsky and G. K. Moiseev, J. Therm. Anal., 1997, 48, 1105–1122 CrossRef CAS.
- B. Hallstedt, D. Risold and L. J. Gauckler, J. Am. Ceram. Soc., 1996, 79, 353–358 CrossRef CAS.
- K. Momma and F. Izumi, J. Appl. Crystallogr., 2011, 44, 1272–1276 CrossRef CAS.
- N. Wolff, D. Klimm and D. Siche, J. Solid State Chem., 2018, 258, 495–500 CrossRef CAS.
- N. Wolff, D. Klimm, S. Ganschow and D. Siche, Cryst. Res. Technol., 2019, 54, 1900036 CrossRef.
- N. Wolff, PhD thesis, Technische Universität Berlin, Germany, 2019 Search PubMed.
- N. Wolff, T. Schwaigert, D. Siche, D. G. Schlom and D. Klimm, J. Cryst. Growth, 2020, 532, 125426 CrossRef CAS.
- F. Schröder, N. Bagdassarov, F. Ritter and L. Bayarjargal, Phase Transitions, 2010, 83, 311–325 CrossRef.
- B. G. Kakhan, V. B. Lazarev and I. S. Shaplygin, Zh. Neorg. Khim., 1979, 24, 1663–1668 CAS.
- L. Schramm, G. Behr, W. Löser and K. Wetzig, J. Phase Equilib. Diffus., 2005, 26, 605–612 CrossRef CAS.
- FactSage 7.3, GTT Technologies, Kaiserstr. 100, 52134 Herzogenrath, Germany, 2019, www.factsage.com Search PubMed.
- A. Strejc, D. Sedmidubský, K. Růžička and J. Leitner, Thermochim. Acta, 2003, 402, 69–74 CrossRef CAS.
- V. M. Denisov, L. A. Irtyugo, L. T. Denisova, S. D. Kirik and L. G. Chumilina, Phys. Solid State, 2012, 54, 1943–1945 CrossRef CAS.
- M. Hrovat, S. Bernik and D. Kolar, J. Mater. Sci. Lett., 1988, 7, 637–638 CrossRef CAS.
- A. G. Massey, N. R. Thompson and B. F. G. Johnson, The Chemistry of Copper, Silver and Gold, Pergamon, 1973, p. 93 Search PubMed.
- J. Assal, B. Hallstedt and L. J. Gauckler, J. Am. Ceram. Soc., 1999, 82, 711–715 CrossRef CAS.
- G. Bayer and H. Wiedemann, Thermochim. Acta, 1975, 11, 79–88 CrossRef CAS.
- H. Kouta, Y. Kuwano, K. Ito and F. Marumo, J. Cryst. Growth, 1991, 114, 676–682 CrossRef.
- B. D. White, W. M. Pätzold and J. J. Neumeier, Phys. Rev. B: Condens. Matter Mater. Phys., 2010, 82, 094439 CrossRef.
- M. J. Konstantinovic, Z. V. Popovic, S. D. Devic, A. Revcolevschi and G. Dhalenne, J. Phys.: Condens. Matter, 1992, 4, 7913–7918 CrossRef CAS.
- G. Dhalenne, A. Revcolevschi, M. Ain, B. Hennion, G. Andre and G. Parette, Cryst. Prop. Prep., 1991, 36–38, 11–16 CAS.
- M. Baran, Y. Gaidukov, N. Danilova, A. Inushkin, A. Jedrzejczak, Y. Koksharov, V. Nikiforov, A. Revcolevschi, R. Szymczak and H. Szymczak, J. Magn. Magn. Mater., 1999, 196–197, 532–533 CrossRef CAS.
- M. Herak, M. Miljak, G. Dhalenne and A. Revcolevschi, J. Phys.: Condens. Matter, 2009, 22, 026006 CrossRef PubMed.
| This journal is © The Royal Society of Chemistry 2021 |

