 Open Access Article
Chiral detection by induced surface-enhanced Raman optical activity†
Moumita
Das
 ab,
Debraj
Gangopadhyay
 a,
Jaroslav
Šebestík
 a,
Lucie
Habartová
 b,
Pavel
Michal
 c,
Josef
Kapitán
 c and
Petr
Bouř
 *ab
*ab
aInstitute of Organic Chemistry and Biochemistry, Academy of Sciences, Flemingovo náměstí 2, Prague 16610, Czech Republic. E-mail: bour@uochb.cas.cz
bDepartment of Analytical Chemistry, University of Chemistry and Technology, Technická 5, Prague 16628, Czech Republic
cDepartment of Optics, Palacký University Olomouc, 17. listopadu 12, Olomouc, 77146, Czech Republic
First published on 4th June 2021
Abstract
Combination of optical activity with surface-enhanced Raman scattering has been a dream of physical chemists for a long time. We report a measurement protocol based on silver colloids and aromatic linkers where chiral acids could be detected in concentrations of about 10−5 M. We explain the mechanism by binding and self-assembly of the linkers into chiral aggregates on the silver surface. Following the “sergeants-and-soldiers” principle, the chirality is determined by the relatively minor acidic component. Such detection of biologically relevant molecules may be useful when other methods, such as electronic circular dichroism, are not sensitive enough. In the future, variations of the chemical structure of the linker or other conditions are needed to provide a more specific signal allowing one to better discriminate among the optically active molecules.
Since its discovery,1 spectroscopy of Raman optical activity (ROA) has developed into many forms2 and has been applied for various systems, such as organic molecules,3 sugars,4–6 peptides,7,8 proteins,9–11 nucleic acids, and even whole viruses.12–15 The ROA measures a small difference in the scattering of right- and left-circularly polarized light, and is therefore more sensitive to enantiomers or other variations in molecular structure than upolarized Raman scattering.
A big drawback of ROA spectroscopy is the weakness of the signal, such as the low ROA/Raman intensity ratio, the so called circular intensity difference (CID).16 Typically, CID ∼ 10−4, which brings about the necessity of highly concentrated solutions (sometimes more than 10 mg ml−1) and long measurement times (hours/days), and causes high noise and occasional artifacts (false signals) in the spectrum.2,17 ROA analyses often become too lengthy or expensive.
One of the means of ROA sensitivity enhancement explored in recent years is a combination of optical activity with surface enhanced Raman scattering (SERS), providing surface-enhanced ROA (SEROA) spectroscopy.18,19 When attached to a noble metal surface, molecules may provide astronomically enhanced Raman signals, so that even single-molecule detection seems reasonable.20 It is interesting that the SERS effect was discovered at about the same time as ROA,21 but the two techniques were developed rather independently. Although the first theoretical analyses that found SEROA possible appeared in the 1980s,22–26 early experiments provided inconclusive results. A big problem was the intrinsic instability of the colloids and weakness of the ROA signal.27–30 More stable spectra were obtained with “intelligent” colloids, stabilized either with a polymer layer,31 coated with a silica oxide,32 or formed by metallic nanostructures of various shapes.33 Complex metal nanostructures, however, may lead to a smaller signal and a complicated optical response difficult to interpret.32
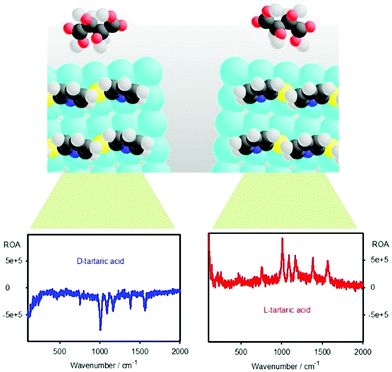
Here, we explore molecular SEROA detection through induced chirality of a linker molecule attached to a silver colloid (Fig. 1). This approach is more universal than pursuing a direct interaction since most molecules do not bind firmly to the colloid surface. Another advantage is that used linkers, such as mercaptopyridine derivatives, are prone to form spontaneous chiral aggregates.34 Within the “sergeants-and-soldiers” effect35–38 a small perturbation caused by the analyzed species can induce considerable chirality of the surface layer.23,34 Lately, a similar effect, chirality sensing through a mercaptopyridine “mediator”, has been observed for tip-enhanced Raman scattering.39 We could detect strong ROA, with a CID up to ∼10−3, universally for all the four linkers and several analytes (“chiral modifiers”) investigated. The chiral signal could be verified by “mirror image” enantiomer spectra, measurements on many combinations of the linkers and modifiers, and by reproducing the experiment in two different laboratories (Academy of Sciences, Prague, and Palacký University, Olomouc).
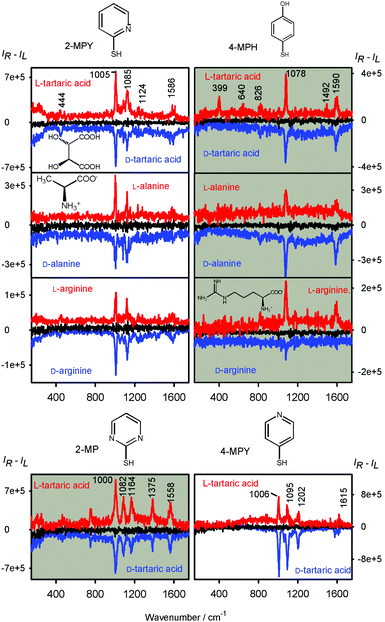
SEROA spectra obtained for eight linker and analyte combinations are plotted in Fig. 2, and the corresponding SERS (Raman) spectra can be found in Fig. S1 in the ESI.† The SEROA spectra are dominated by the linker bands. For example, for 2-mercaptopyridine we see the ring breathing at 1005 cm−1, CH bending (1085–1124 cm−1), and C![[double bond, length as m-dash]](https://www.rsc.org/images/entities/char_e001.gif) C/C
C/C![[double bond, length as m-dash]](https://www.rsc.org/images/entities/char_e001.gif) N stretching modes around 1586 cm−1 (cf.ref. 40, Table S1, ESI†). SERS bands of the chiral analytes are occasionally apparent as well; however, these are small and their SEROA is not measurable. For tartaric acid, SERS spectra with and without the linker can be seen in Fig. S2 (ESI†), and are consistent with previous literature.41
N stretching modes around 1586 cm−1 (cf.ref. 40, Table S1, ESI†). SERS bands of the chiral analytes are occasionally apparent as well; however, these are small and their SEROA is not measurable. For tartaric acid, SERS spectra with and without the linker can be seen in Fig. S2 (ESI†), and are consistent with previous literature.41
The noise signal (black in Fig. 2) is reasonably small (CID ∼ 10−5).2 Addition of the chiral modifiers leads to quite large CID ratios, often bigger than 10−3 (Table S2, ESI†). This is up to 100 times more than typical for many organic molecules, and suggests that resonance2,42,43 or surface-chirality effects23 participate in the origin of the chiral signal. Also the concentration of the chiral part, ∼6 × 10⁻⁶ M, is much lower than in conventional ROA, where about 6 × 10⁻² M would be required for these acids.2
For 2-mercaptopyridine, tartaric acid provides the biggest CID, whereas the arginine and alanine values are smaller. This can be attributed to the two chiral centers and two carboxyl groups by which tartaric acid affects the chiral assembly of the linker molecules. Indeed, tartaric acid is known to be efficient in such “chirality seeding”.44,45 The arginine side chain is polar and bulky, but it is not chiral, which may explain why in our experiments the arginine SEROA signal was smaller than that of alanine and tartaric acid. The signal, however, is not simply proportional to the number of chiral centers in the molecule. For example, two-center L-isoleucine and D-threonine with 2-MPY (spectra are not shown) provided weak SEROA, similar to arginine.
In many cases, a large SEROA signal is apparent also around 200 cm−1 and lower (Fig. 2), which can be attributed to the delocalized and inter-molecular modes in the linker aggregates and vibrations of the silver crystal lattice. A similar low-frequency ROA signal was recently also observed for a nitrile liquid.46
Variation of the linker molecules does not cause a significant increase or decrease of SEROA; however, some linkers provide more strong bands than the others and thus appear more suitable for this kind of chirality detection. The 4-mercaptopyridine and 2-mercaptopyrimidine linkers seem to give the best signal to noise SEROA ratio, perhaps also because of a positive effect on colloid stability during the measurement. The colloids did not precipitate so quickly and SEROA spectra could be accumulated for a longer time.
Possible linker–analyte interactions may involve specific hydrogen bond,47 π–π, van der Waals or electrostatic interactions.48–51 Chirality induction with charged species was also observed for gold-based clusters,52 and hydrogen bond participation was also observed in SERS of chiral alcohols.53
The strong SERS and SEROA signals lasted several minutes/hours after the aggregation was triggered by HCl,54 depending on the colloid quality and laser power. An example of the time dependence of the spectra for tartaric acid and 2-mercaptopyridine is given in Fig. S3 (ESI†). Normally, the limited time window for ROA accumulation would result in extensive noise. However, because of the large CIDs, SEROA could be measured relatively comfortably within a few minutes.
During the aggregation, the color of the solution changes, and a new band around 600 nm appears in the absorption spectra (Fig. S4, ESI†). Apart from the SERS/SEROA effect, interference of circular dichroism and ROA has been lately discovered as another mechanism of chirality induction in ROA experiments.55,56 This mechanism can be nevertheless probably ruled out as the circular dichroism is immeasurably weak (Fig. S5, ESI†). Although plasmonic CD is sometimes observable in colloids,57,58 in our case addition of a small amount of the chiral compound did not produce it.
The interpretation of the data as SEROA is consistent with the theoretical modeling. It should be noted that the computation is not accurate for the resonance,2,59 but it can be used to understand the qualitative trends.
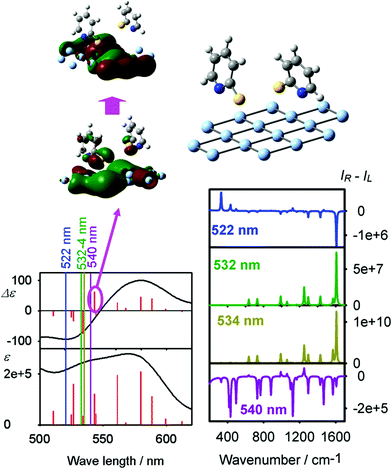
A typical outcome of the calculations is shown in Fig. 3, where a cluster consisting of 16 silver atoms and two 2-mercaptopyridine molecules provides significant chirality, manifested both in the CD and ROA spectra. For the geometry optimized at the B3LYP/6-311++G**/MWB28/CPCM level, the angles between 2-mercaptopyridine and the silver planes were 70–81°, which is consistent with previous experimental and computational studies.34
In the vicinity of an electronic band the excitation light provides a single-sign ROA spectrum.43 The ROA spectral shape is approximately proportional to the Raman spectrum, with CID = −2R/D, where R and D are the rotational and dipole strengths of the electronic transition. This can be demonstrated for the excitation wavelength of 540 nm, close to a 543 nm electronic band. The 543 nm electronic transition provides positive CD and the ROA spectrum is thus predominantly negative. Also other tests confirmed the propensity of the chirally attached linker on the silver surface towards one-sign ROA signal (Fig. S6, computational tests and details in S7, S8 and Table S3, ESI†). The simulated CID ratios of ∼10−3–10−4 are reasonably close to the experimental ones given in Table S2 (ESI†) and confirm previous predictions that the surface chirality can lead to strong light polarization effects.23 Therefore, the computation shows that the experimental Raman and ROA spectra (Fig. 3) can be attributed to a chiral arrangement of the linkers on the silver surface, controlled by the chiral analyte.
In conclusion, we used the sergeants-and-soldiers principle to obtain strong measurable and reproducible SEROA spectra of the linkers and several chiral analytes. The data were verified by independent measurements and comparison of enantiomers, and interpreted on the basis of model ab initio computations. The method leads to sensitive detection of chiral analytes in concentrations smaller than 10−5 M. Under such conditions circular dichroism or conventional Raman optical activity spectra normally cannot be measured. The amplification of chirality through asymmetry induction, resonance and surface effects thus appears as a promising means for future biomolecular detection and analyses. It also documents the amazing flexibility and variability of chiral spectroscopy and chemical science.
The work was supported by the Palacký University (IGA PrF 2021_002), Ministry of Education (CZ.02.1.01/0.0/0.0/16_019/0000729) and the Science Foundation (20-10144S) of the Czech Republic.
Conflicts of interest
There are no conflicts to declare.References
- L. D. Barron, M. P. Bogaard and A. D. Buckingham, J. Am. Chem. Soc., 1973, 95, 603–605 CrossRef CAS.
- L. Nafie, Vibrational optical activity: Principles and applications, Wiley, Chichester, 2011 Search PubMed.
- J. Haesler, I. Schindelholz, E. Riguet, C. G. Bochet and W. Hug, Nature, 2007, 446, 526–529 CrossRef CAS PubMed.
- Z. Q. Wen, L. D. Barron and L. Hecht, J. Am. Chem. Soc., 1993, 115, 285–292 CrossRef CAS.
- J. R. Cheeseman, M. S. Shaik, P. L. A. Popelier and E. W. Blanch, J. Am. Chem. Soc., 2011, 133, 4991–4997 CrossRef CAS PubMed.
- V. Palivec, V. Kopecký, P. Jungwirth, P. Bouř, J. Kaminský and H. Martinez-Seara, Phys. Chem. Chem. Phys., 2020, 22, 1983–1993 RSC.
- K. J. Jalkanen, R. M. Nieminen, M. Knapp-Mohammady and S. Suhai, Int. J. Quantum Chem., 2003, 92, 239–259 CrossRef CAS.
- S. Yamamoto, M. Straka, H. Watarai and P. Bouř, Phys. Chem. Chem. Phys., 2010, 12, 11021–11032 RSC.
- S. Luber and M. Reiher, J. Phys. Chem. B, 2010, 114, 1057–1063 CrossRef CAS PubMed.
- J. Kessler, J. Kapitán and P. Bouř, J. Phys. Chem. Lett., 2015, 6, 3314–3319 CrossRef CAS.
- E. W. Blanch, I. H. McColl, L. Hecht, K. Nielsen and L. D. Barron, Vib. Spectrosc., 2004, 35, 87–92 CrossRef CAS.
- E. W. Blanch, L. Hecht and L. D. Barron, Methods, 2003, 29, 196–209 CrossRef CAS PubMed.
- A. J. Hobro, M. Rouhi, E. W. Blanch and G. L. Conn, Nucleic Acids Res., 2007, 35, 1169–1177 CrossRef CAS PubMed.
- V. Parchaňský, J. Kapitán and P. Bouř, RSC Adv., 2014, 4, 57125–57136 RSC.
- M. Krupová, J. Kessler and P. Bouř, ChemPlusChem, 2020, 85, 561–575 CrossRef PubMed.
- L. D. Barron, Molecular Light Scattering and Optical Activity, Cambridge University Press, Cambridge, UK, 2004 Search PubMed.
- W. Hug, Appl. Spectrosc., 1981, 35, 115–124 CrossRef CAS.
- S. Abdali and E. W. Blanch, Chem. Soc. Rev., 2008, 37, 980–992 RSC.
- S. Ostovar pour, L. D. Barron, S. T. Mutter and E. W. Blanch, in Chiral Analysis, ed. P. L. Polavarapu, Elsevier, 2nd edn, 2018, pp. 249–291 Search PubMed.
- K. Kneipp, H. Kneipp, S. Abdali, R. W. Berg and H. Bohr, Spectroscopy, 2004, 18, 433–440 CrossRef CAS.
- M. Fleischmann, P. J. Hendra and A. J. McQuillan, Chem. Phys. Lett., 1974, 26, 163–166 CrossRef CAS.
- S. Efrima, Chem. Phys. Lett., 1983, 102, 79–82 CrossRef CAS.
- L. Hecht and L. D. Barron, J. Mol. Struct., 1995, 348, 217–220 CrossRef CAS.
- B. G. Janesko and G. E. Scuseria, J. Chem. Phys., 2006, 125, 124704 CrossRef PubMed.
- P. Bouř, J. Chem. Phys., 2007, 127, 136101 CrossRef PubMed.
- V. Novák, J. Šebestík and P. Bouř, J. Chem. Theory Comput., 2012, 8, 1714–1720 CrossRef PubMed.
- H. Kneipp, J. Kneipp and K. Kneipp, Anal. Chem., 2006, 78, 1363–1366 CrossRef CAS PubMed.
- S. Abdali, J. Raman Spectrosc., 2006, 37, 1341–1345 CrossRef CAS.
- K. Osinska, M. Pecul and A. Kudelski, Chem. Phys. Lett., 2010, 496, 86–90 CrossRef CAS.
- C. Johannessen, P. C. White and S. Abdali, J. Phys. Chem. A, 2007, 111, 7771–7776 CrossRef CAS PubMed.
- S. O. Pour, S. E. J. Bell and E. W. Blanch, Chem. Commun., 2011, 47, 4754–4756 RSC.
- S. O. Pour, L. Rocks, K. Faulds, D. Graham, V. Parchaňský, P. Bouř and E. W. Blanch, Nat. Chem. Biol., 2015, 7, 591–596 CrossRef PubMed.
- M. Sun, Z. Zhang, P. Wang, Q. Li, F. Ma and H. Xu, Light: Sci. Appl., 2013, 2, e112–e112 CrossRef CAS.
- P. D. Jadzinsky, G. Calero, C. J. Ackerson, D. A. Bushnell and R. D. Kornberg, Science, 2007, 318, 430–433 CrossRef CAS PubMed.
- D. R. Link, G. Natale, R. Shao, J. E. Maclennan, N. A. Clark, E. Körblova and D. M. Walba, Science, 1997, 278, 1924–1927 CrossRef CAS PubMed.
- M. Parschau, S. Romer and K. H. Ernst, J. Am. Chem. Soc., 2004, 126, 15398–15399 CrossRef CAS PubMed.
- J. Šebestík, P. Niederhafner and J. Ježek, Amino Acids, 2011, 40, 301–370 CrossRef PubMed.
- J. Šebestík, M. Reiniš and J. Ježek, Biomedical Applications of Peptide-,Glyco- and Glycopeptide Dendrimers, and Analogous Dendrimeric Structures, Springer, Wien, Austria, 2012 Search PubMed.
- T. Sukmanee, K. Wongravee, Y. Kitahama, S. Ekgasit, T. Itoh, P. Pienpinijtham and Y. Ozaki, Angew. Chem., Int. Ed., 2020, 59, 14564–14569 CrossRef CAS PubMed.
- W. H. Do, C. J. Lee, D. Y. Kim and M. J. Jung, J. Ind. Eng. Chem., 2012, 18, 2141–2146 CrossRef CAS.
- J. L. Castro, M. R. López-Ramírez, J. F. Arenas and J. C. Otero, Vib. Spectrosc., 2005, 39, 240–243 CrossRef CAS.
- C. Merten, H. Li, X. Lu, A. Hartwiga and L. A. Nafie, J. Raman Spectrosc., 2010, 41, 1563–1565 CrossRef.
- L. A. Nafie, Chem. Phys., 1996, 205, 309–322 CrossRef CAS.
- F. Zaera, Chem. Soc. Rev., 2017, 46, 7374–7398 RSC.
- H. Kim, S. W. Im, R. M. Kim, N. H. Cho, H. E. Lee, H. Y. Ahn and K. T. Nam, Adv. Mater., 2020, 1, 512–524 RSC.
- P. Michal, R. Čelechovský, M. Dudka, J. Kapitán, M. Vůjtek, M. Berešová, J. Šebestík, K. Thangavel and P. Bouř, J. Phys. Chem. B, 2019, 123, 2147–2156 CrossRef CAS PubMed.
- V. Balamurugan and R. Mukherjee, CrystEngComm, 2005, 7, 337–341 RSC.
- H. Engelkamp, S. Middelbeek and R. J. M. Nolte, Science, 1999, 284, 785–788 CrossRef CAS PubMed.
- S. Kirstein, C. Böttcher, C. Burger, A. Ouart, G. Reck and S. Dähne, ChemPhysChem, 2000, 1, 146–150 CrossRef CAS PubMed.
- E. Yashima, K. Maeda and T. Nishimura, Chemistry, 2004, 10, 42–51 CrossRef CAS PubMed.
- R. Fasel, M. Parschau and K. H. Ernst, Angew. Chem., Int. Ed., 2003, 42, 5178–5181 CrossRef CAS PubMed.
- S. Knoppe, O. A. Wong, S. Malola, S. Häkkinen, T. Bürgi, T. Verbiest and C. J. Ackerson, J. Am. Chem. Soc., 2014, 136, 4129–4132 CrossRef CAS PubMed.
- Y. Wang, Z. Yu, X. Han, H. Su, W. Ji, Q. Cong, B. Zhao and Y. Ozaki, J. Phys. Chem. C, 2016, 120, 29374–29381 CrossRef CAS.
- P. Niederhafner, M. Šafařík, J. Neburková, T. A. Keiderling, P. Bouř and J. Šebestík, Amino Acids, 2021, 53, 517–532 CrossRef CAS PubMed.
- G. Li, J. Kessler, J. Cheramy, T. Wu, M. R. Poopari, P. Bouř and Y. Xu, Angew. Chem., Int. Ed., 2019, 58, 16495–16498 CrossRef CAS PubMed.
- T. Wu, G. Li, J. Kapitán, J. Kessler, Y. Xu and P. Bouř, Angew. Chem., Int. Ed., 2020, 59, 21895–21898 CrossRef CAS PubMed.
- Z. Hu, D. Meng, F. Lin, X. Zhu, Z. Fang and X. Wu, Adv. Opt. Mater., 2019, 7, 1801590 CrossRef.
- B. M. Maoz, R. van der Weegen, Z. Fan, A. O. Govorov, G. Ellestad, N. Berova, E. W. Meijer and G. Markovich, J. Am. Chem. Soc., 2012, 134, 17807–17813 CrossRef CAS PubMed.
- J. R. Cheeseman and M. J. Frisch, J. Chem. Theory Comput., 2011, 7, 3323–3334 CrossRef CAS PubMed.
Footnote |
| † Electronic supplementary information (ESI) available: Details of the experimental and computational procedures. See DOI: 10.1039/d1cc01504d |
| This journal is © The Royal Society of Chemistry 2021 |


