 Open Access Article
Creative Commons Attribution 3.0 Unported Licence
Ultrafast diffusion-based unmixing of 1H NMR spectra†
Rituraj
Mishra
 ,
Achille
Marchand
 ,
Corentin
Jacquemmoz
 and
Jean-Nicolas
Dumez
 *
*
Université de Nantes, CNRS, CEISAM UMR 6230, F-44000 Nantes, France. E-mail: jean-nicolas.dumez@univ-nantes.fr
First published on 1st February 2021
Abstract
We show that the NMR spectra of components in a mixture can be separated using 2D data acquired in less than one second, and an algorithm that is executed in just a few seconds. This NMR unmixing method is based on spatial encoding of the translational diffusion coefficients of the mixture's components, with multivariate processing of the data. This requires a new frequency swept pulse, which is designed and implemented to obtain quadratic spacing of the spatially parallelised gradient dimension. Ultrafast NMR unmixing may help in the analysis of mixtures that evolve in time.
Mixtures of small molecules in solution are widely found in chemical science, in fields ranging from chemical synthesis to natural-product research and metabolomics. Nuclear magnetic resonance (NMR) spectroscopy is a powerful tool for the analysis of small-molecule mixtures. In many cases, mixtures can be analysed directly by NMR spectroscopy, with no need for sample purification.1 A variety of NMR experiments have been developed that separate the spectra of a mixture's components, without physical separation of the components themselves.2 One of the most general and powerful methods to achieve this separation relies on the differences in translational diffusion coefficients of the molecules.2a,f Diffusion NMR (DNMR), which can separate the spectra of a mixture's components according to their diffusion coefficients, is thus sometimes dubbed “virtual chromatography”.
Diffusion NMR experiments rely on a pair of pulsed-field gradients, separated by a delay, to encode translational diffusion coefficients in the NMR signal. The decrease of the NMR signals, as a function of the gradient amplitude, is modelled to extract the corresponding diffusion coefficients.3 The most powerful approaches to achieve spectral separation of a mixture's components with diffusion NMR are based on multivariate analyses of the data.2a,f,4 Among such methods, direct exponential curve resolution algorithm (DECRA) is the fastest and the most straightforward to implement.4a,b It can resolve cases of overlap, for compounds whose diffusion coefficients differ by less than 20%, and also provide a route towards the quantitative analysis of diffusion NMR data.4a
A limitation of classic diffusion NMR experiments is the duration required to sample the additional gradient dimension. Typically, a series of sub-experiments are recorded, for incremented values of the diffusion-encoding-gradient amplitude. This results in experiments that last several minutes, which may not be suitable for the analysis of mixtures that evolve in time, be it because of a chemical reaction, or because of the decay of a far-from-equilibrium, enhanced spin polarisation. Fast-pulsing experiments have been designed to reduce the experiment's duration from several minutes to few seconds.5 Diffusion NMR experiments can be further accelerated by spatial parallelisation of the gradient dimension.6 With such spatially encoded (SPEN), ultrafast diffusion NMR experiments, complete data set can be recorded in a single scan of less than one second. Several groups have shown that univariate processing of SPEN DNMR data can provide good-quality diffusion-ordered spectroscopy (DOSY) representation of the data.6b–e However, the current implementation of SPEN DNMR is not compatible with DECRA processing, which limits its application for mixture analysis.
In this communication, we show that the NMR spectra of a mixture's components can be separated using data recorded in a single scan of less than one second. The processing step itself lasts just a few seconds. The method is based on DECRA processing of SPEN DNMR data. To make DECRA processing possible, we introduce a radio-frequency pulse that performs a non-linear frequency sweep, resulting in a quadratic spacing for the spatially parallelised gradient dimension. The possibility to separate spectra is illustrated with mixtures of small molecules. Ultrafast NMR unmixing should become useful for reaction monitoring and the analysis of hyperpolarised substrates.
Classic diffusion NMR experiments rely on the stepwise incrementation of the amplitude of pulsed-field gradients. Arbitrary lists of gradient amplitudes may be used, but each value requires an extra increment, and the experiment's duration scales linearly with the number of sampled points. With repetition times of several seconds, this typically results in experiment durations of a minute or more. In contrast, spatially encoded diffusion NMR relies on the simultaneous acquisition of all the data.6a–d This is achieved by mapping the gradient dimension onto a spatial axis, then using a spectroscopic imaging scheme. The resulting data has the form:
 | (1) |
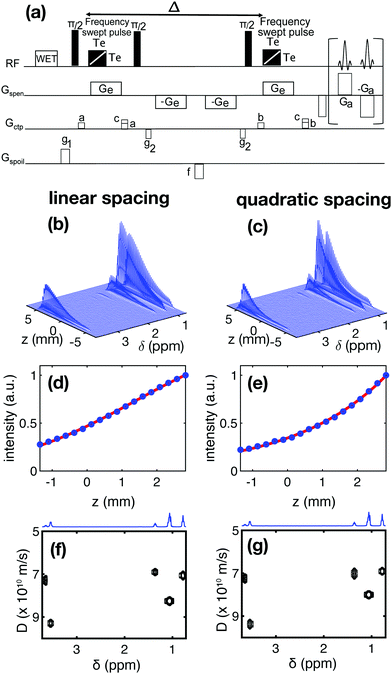
In SPEN DNMR experiments, the spatial encoding step relies on the simultaneous application of a frequency-swept pulse and a magnetic field gradient. Echo-planar spectroscopic imaging (EPSI) is then used during acquisition. A stimulated-echo-based pulse sequence for SPEN DNMR is shown in Fig. 1a. Almost all of the SPEN NMR experiments described so far rely on a linear frequency sweep, with a so-called chirp pulse.7 This results in a linear spacing of the sampled gradient areas
| Kn = n × K1, n = 0, 1,… | (2) |
| (Kn)2 = n × K12, n = 0, 1,… | (3) |
 | (4) |
 | (5) |
Eqn (5) corresponds to the desired quadratic spacing with
| Kn = K(nΔz − L/2), | (6) |
Before introducing DECRA processing, the validity of the proposed pulse can be assessed by comparing experimental diffusion decay curves obtained with this pulse, to the model given by eqn (5). This is illustrated in Fig. 1, with the example of a mixture of ethanol and butan-2-ol in D2O. Fig. 1(b and c) shows the data that results from applying the pulse sequence shown in Fig. 1(a). The diffusion coefficient is encoded, for each peak, in the variation of the peak intensity as a function of position. Fig. 1(d and e) shows a comparison, for linear and quadratic spacing, of representative diffusion decay curves and of the expression given in eqn (1). In both cases, the agreement between theory and experiment is very good. Using eqn (1), the diffusion decay curve for each peak is fitted to perform a univariate analysis of the SPEN DNMR data and construct a DOSY representation. It can be seen in Fig. 1(f and g) that similar results are obtained in this case with linear and quadratic spacing, further validating the proposed model.
It can be noted that, for this sample, the estimated diffusion coefficient for the region where two peaks overlap (one for ethanol and one for butanol), between 1 and 1.1 ppm, is a compromise value between the diffusion coefficients of the two species. This is typically the case when single-exponential fits are used to process the diffusion NMR data.3c
The main motivation to develop a quadratic spacing scheme for SPEN DNMR is the possibility to use direct exponential curve resolution algorithm (DECRA).4a,b DECRA is based on an analytical solution, and is very fast compared to iterative or “best-fit” methods. The code for DECRA was described by Antalek,4b and implemented in a user-friendly framework by Nilsson and coworkers.9 We have reused the corresponding code to process the SPEN DNMR data.
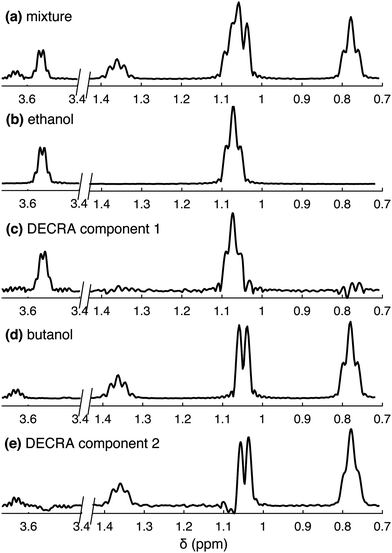
Fig. 2 shows the results of DECRA processing for the ethanol/butanol mixture, for which univariate processing is shown in Fig. 1. The method takes as an input the number of components in the mixture, and achieves good separation of the two spectra. Complex values of diffusion constants are obtained if this input exceeds from the actual number of components. Interestingly, the spectral region where two peaks overlap, between 1 and 1.1 ppm, is suitably separated into the two compounds, while this was not achieved with univariate processing. In this example, the data was acquired in less than 500 ms, and the processing step took less than 2 s on a laptop, including less than 100 ms for the DECRA algorithm – the rest being dedicated to data pre-processing and plotting. This illustrates NMR unmixing achieved in just a few seconds.
The resolution and sensitivity of the spectra shown in Fig. 2 is lower than what would be obtained with conventional (non-SPEN) experiments. This is a common feature of spatially encoded ultrafast NMR methods, in which acceleration is obtained at a cost in spectrum quality. The result of DECRA processing of data obtained from the mixture may be compared to 1D spectra of individual compounds, shown in Fig. 2b and d. These were obtained here as slices of spectroscopic imaging data, to have a resolution and sensitivity comparable to that obtained with SPEN DNMR. The result of DECRA processing of conventional data is shown in the ESI.† Note that the loss in resolution compared to conventional experiment is due to a short acquisition time of 170 ms, as the high-resolution probe used in this work may not sustain long trains of bipolar gradient pulses. The loss of sensitivity, compared to conventional experiment, is due to the absence of signal averaging, the shorter acquisition time and the use of spatial encoding.7 The possibility to separate spectra by multivariate processing also depends on the signal-to-noise ratio. In this case, the approach currently fails to separate three components or more. This may be addressed with the use of cryogenically cooled probes, and when hyperpolarised species are analysed.
DECRA processing also yields estimates of the diffusion coefficients. These values are given in Table S1 (ESI†), with the values obtained from univariate processing. The results obtained with DECRA are consistent with the results obtained for resolved peaks with univariate analysis of SPEN experiments.
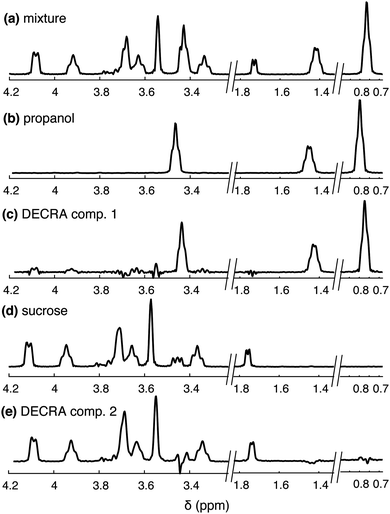
Several intermediate processing steps have been implemented so that DECRA can be applied to the SPEN DNMR data. As is usually done also in the case of univariate processing, the data, acquired in a single scan, is rearranged into a 2D matrix, then window multiplication and Fourier transformation are performed in both dimensions. Improved results are obtained if the sensitivity profile of the RF coil, and the spatial selection profile of the RF pulse, are accounted for (see ESI† for a description of the process). These reference profiles are sample-independent and can be recorded just once, on a reference sample, and reused for other samples. A further example of spectral separation, which is only successful with these intermediate processing steps, is shown in Fig. 3, with a mixture of sucrose and n-propanol.
Other multivariate processing algorithms have been reported for DNMR data. Examples of SCORE processing4d are shown in the ESI.† These algorithms all have advantages and disadvantages, and a comparison between them in the case of SPEN DNMR will be carried out. Here, we chose DECRA for its speed and simplicity, which are appealing features in the context of ultrafast 2D NMR experiments.
Fast diffusion NMR methods are particularly promising for the analysis of hyperpolarised substrates, and the monitoring of reaction mixtures. In both cases, mechanical disturbances may exist, due to, e.g., the rapid injection or mixing of the sample. Methods that limit disturbances, such as liquid-driven injection,10 or their effect of the diffusion measurement, such as double-diffusion encoding methods,11 will be needed for such applications.
We have described the separation of NMR spectra of mixture's components in just a few seconds, using spatially encoded, ultrafast diffusion NMR data, together with the direct exponential curve resolution algorithm. This required the development of a frequency swept pulse that results in a quadratic spacing of the spatially parallelised gradient dimension. Ultrafast NMR unmixing based on diffusion experiments should be particularly useful for the analysis of reaction mixtures and hyperpolarised substrates.
Author contributions: RM, JND: conceptualisation, methodology, formal analysis, visualisation, writing – original draft; RM, AM, JND: investigation, validation; RM, AM, CJ: resources; JND: funding acquisition, project administration, supervision; All the authors: data curation, software, writing – review & editing.
This work has received funding from the European Research Council (ERC) under the European Union's Horizon 2020 research and innovation program (grant agreement no. 801774), the Region Pays de la Loire (Connect Talent).
Conflicts of interest
There are no conflicts to declare.Notes and references
- (a) A. L. Hansen, D. Li, C. Wang and R. Brüschweiler, Angew. Chem., Int. Ed., 2017, 56, 8149 CrossRef CAS; (b) J. Van Duynhoven, E. van Velzen and D. M. Jacobs, Annu. Rep. NMR Spectrosc., 2013, 80, 181 CrossRef CAS; (c) L. T. Kuhn, K. Motiram-Corral, T. J. Athersuch, T. Parella and M. Pérez-Trujillo, Angew. Chem., Int. Ed., 2020, 59, 23615 CrossRef CAS; (d) C. Simmler, J. G. Napolitano, J. B. McAlpine, S. N. Chen and G. F. Pauli, Curr. Opin. Biotechnol., 2014, 25, 51 CrossRef CAS.
- (a) A. A. Colbourne, G. A. Morris and M. Nilsson, J. Am. Chem. Soc., 2011, 133, 7640 CrossRef CAS; (b) G. Dal Poggetto, L. Castanar, R. W. Adams, G. A. Morris and M. Nilsson, J. Am. Chem. Soc., 2019, 141, 5766 CrossRef CAS; (c) P. Lameiras and J. M. Nuzillard, Anal. Chem., 2016, 88, 4508 CrossRef CAS; (d) S. Wei, J. Zhang, L. Liu, T. Ye, G. A. N. Gowda, F. Tayyari and D. Raftery, Anal. Chem., 2011, 83, 7616 CrossRef CAS; (e) F. Zhang and R. Brüschweiler, Angew. Chem., Int. Ed., 2007, 46, 2639 CrossRef CAS; (f) I. Toumi, B. Torrésani and S. Caldarelli, Anal. Chem., 2013, 85, 11344 CrossRef CAS.
- (a) H. Barjat, G. A. Morris, S. Smart, A. G. Swanson and S. C. R. Williams, J. Magn. Reson., 1995, 108, 170 CrossRef CAS; (b) C. S. Johnson, Prog. Nucl. Magn. Reson. Spectrosc., 1999, 34, 203 CrossRef CAS; (c) G. Pagès, V. Gilard, R. Martino and M. Malet-Martino, Analyst, 2017, 142, 3771 RSC.
- (a) B. Antalek, J. Am. Chem. Soc., 2006, 128, 8402 CrossRef CAS; (b) B. Antalek and W. Windig, J. Am. Chem. Soc., 1996, 118, 10331 CrossRef CAS; (c) A. A. Colbourne, S. Meier, G. A. Morris and M. Nilsson, Chem. Commun., 2013, 49, 10510 RSC; (d) M. Nilsson and G. A. Morris, Anal. Chem., 2008, 80, 3777 CrossRef CAS.
- J. P. Stamps, B. Ottink, J. M. Visser, J. P. M. van Duynhoven and R. Hulst, J. Magn. Reson., 2001, 151, 28 CrossRef CAS.
- (a) S. Ahola, V. V. Zhivonitko, O. Mankinen, G. Zhang, A. M. Kantola, H. Y. Chen, C. Hilty, I. V. Koptyug and V. V. Telkki, Nat. Commun., 2015, 6, 1 Search PubMed; (b) L. Guduff, I. Kuprov, C. Van Heijenoort and J.-N. Dumez, Chem. Commun., 2017, 53, 701 RSC; (c) Y. Shrot and L. Frydman, J. Magn. Reson., 2008, 195, 226 CrossRef CAS; (d) M. J. Thrippleton, N. M. Loening and J. Keeler, Magn. Reson. Chem., 2003, 41, 441 CrossRef CAS; (e) N. M. Loening, J. Keeler and G. A. Morris, J. Magn. Reson., 2001, 153, 103 CrossRef CAS.
- J.-N. Dumez, Prog. Nucl. Magn. Reson. Spectrosc., 2018, 109, 101 CrossRef CAS.
- V. V. Zhivonitko, M. S. Ullah and V. V. Telkki, J. Magn. Reson., 2019, 307, 106571 CrossRef CAS.
- L. Castañar, G. D. Poggetto, A. A. Colbourne, G. A. Morris and M. Nilsson, Magn. Reson. Chem., 2018, 56, 546 CrossRef.
- H.-Y. Chen and C. Hilty, ChemPhysChem, 2015, 16, 2646 CrossRef CAS.
- (a) L. Guduff, D. Kurzbach, C. van Heijenoort, D. Abergel and J.-N. Dumez, Chem. – Eur. J., 2017, 23, 16722 CrossRef CAS; (b) G. Hamdoun, L. Guduff, C. van Heijenoort, C. Bour, V. Gandon and J.-N. Dumez, Analyst, 2018, 143, 3458 RSC.
Footnote |
| † Electronic supplementary information (ESI) available: (i) Experimental details; (ii) derivation that the proposed RF pulse provides quadratic spacing; (iii) supplementary tables and figures. See DOI: 10.1039/d0cc07757g |
| This journal is © The Royal Society of Chemistry 2021 |


