Green preparation of high-quality and low-cost graphene from discarded polyethylene plastic bags†
Jian
Gu
 *ab,
Aimin
Pang
ab,
Xiang
Guo
ab,
Lei
Li
ab,
Danchun
Huang
ab and
Fengyu
Li
c
aScience and Technology on Aerospace Chemical Power Laboratory, Xiangyang 441003, P. R. China. E-mail: gujian9804@163.com
bHubei Institute of Aerospace Chemotechnology, Xiangyang 441003, P. R. China
cXiangyang Sunlavor Space Films Co. Ltd, Xiangyang 441003, P. R. China
First published on 25th November 2020
Abstract
A facile method was used to prepare graphene from discarded polyethylene plastic bags in our work. In order to make high-quality graphene, PE plastic bags were ultrasonically cleaned, ball milled and microwave sintered successively. The height of the 2D band was 1.3 times that of the G band, which reveals that the layer number of as-prepared graphene was 1–2. The atomic ratio of C and O for graphene was more than 54, which indicates that it mainly consists of carbon. The size of graphene was within 4–10 μm. Bi-layer sheets were inevitably observed through high resolution imaging of graphene edges. The BET SSA and the electrical conductivity of graphene were 1521.3 m2 g−1 and 4618 S m−1, respectively. This work provides a new approach to large-scale and high-quality synthesis of graphene from waste polluting materials.
Graphene, a unique two-dimensional mono-atomic-thick sheet of sp2 hybridized carbon, has recently been a glamorous star owing to its extraordinary properties, such as high electron mobility at room temperature, exceptional electric and thermal conductivity, excellent chemical stability, large specific surface area (SSA), superior mechanical properties and so on, and is regarded today as a very promising material for various applications in a vast range of nanotechnologies.1–5
Since it was discovered in 2004, a huge effort has been devoted to the synthesis of high quality monolayer graphene. The common methods include micromechanical exfoliation, chemical vapor deposition (CVD), silicon carbide (SiC) epitaxial growth, chemical oxidation–reduction and liquid exfoliation of graphite.6,7 The famous micromechanical exfoliation method1,8 can provide high quality graphene samples, but it is not suitable for mass production. Chemical oxidation–reduction9,10 is another common method to prepare graphene. Although this feasible method has been applied on a large scale to commercially available sulfuric acid intercalated graphite, it never results in complete exfoliation of graphite to the level of individual graphene sheets, which causes the obtained graphene typically to be either with a small size or carry notable defects and residual functional groups. Liquid exfoliation is another method to generate graphene from a graphite crystal,11 where the main problem is the difficulty in obtaining uniform monolayer graphene sheets with high yield and efficiency. Graphene growth is a probable way to reach a reasonable balance between the sample quality and the process scalability. As an interesting example, epitaxial growth of graphene on SiC at a high temperature has been reported.12 An even more popular method is the CVD growth of graphene on metal surfaces, which is one of the most frequently used ways to prepare high-quality graphene.13–15 However, the graphene film synthesized with the CVD method is difficult to scale up. Thus, it can be seen that the now available preparation techniques of graphene mostly use graphite with high-purity or organic carbon compounds, which are of high cost.
Plastic bag litter has come to symbolize the worst excess of a throw-away consumerist society. Since 1977, when plastic bags were first distributed by the supermarket industry in the USA, they have created a huge demand across the world. The global plastic production has increased annually and a significant part of it is used for packaging (in Europe 39%),16 and it is estimated that about 500 billion to one trillion plastic bags are consumed worldwide annually, i.e., 1.4–2.7 billion per day, over one million per minute.17,18 Most of the plastic bags are discarded after a relatively short service life,19 but they have a huge impact on the environment because of their non-biodegradable feature in a natural way in an aerobic or anaerobic or semiaerobic environment.20 Due to several uncaring factors, globally, around 96% of the daily generated plastic bags directly go to landfills or dumpsites, and a huge quantity of them is disposed of illegally. It is known that the discarded plastic bags are now difficult to be destroyed by melting and burning, which are a big pollution source to the natural environment. It is well known that most of the plastic bags are made of polyethylene (PE),21 which may be a useful raw material for graphene preparation. El Essawy and co-workers22 reported the preparation of graphene using poly-ethylene-terephthalate bottle waste as a source material, and the results revealed that the prepared graphene has a relatively high surface area and micropore volumes, and it was found out to be a promising adsorbent for dye removal from aqueous solutions. W. A. Algozeeb et al.23 reported an approach to prepare flash graphene through upcycling plastic waste products based on the Flash Joule heating method (FJH). The flash graphene has an I2D/IG peak ratio up to 6 with a low-intensity D band, and its interlayer spacing is 3.45 Å. Michael G. Stanford et al.24 prepared flash graphene (FG) from carbon black (CB) with the Flash Joule heating method. FG is composed of wrinkled graphene as well as turbostratic sheets of graphene (tFG), which has high 2D/G peak ratios and a narrow FWHM.
In our paper, we report a green preparation method for high-quality and low-cost graphene from discarded PE plastic bags in terms of the merits of the CVD technique and the oxidation–reduction process. We also demonstrate, for the first time, that such chemical treatment dramatically alters the synthesis patterns of obtaining low cost graphene. A systematic investigation on the molecular structure, phase composition, morphology, thermal properties, and specific surface area (SSA) of graphene was carried out, while the electric conductivity was also evaluated for the potential application.
Graphene samples were prepared by ball-milling and graphitization with discarded PE plastic bags, and the details of the experimental method and characterization are shown in the ESI.†
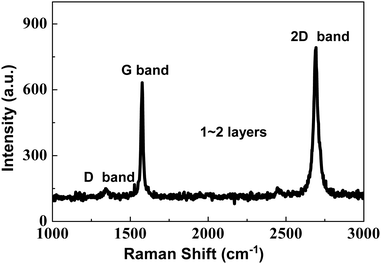
The Raman spectrum of the as-prepared graphene is illustrated in Fig. 1. Both a distinct G band at 1580 cm−1 and a feeble D band at 1350 cm−1 are observed. It is generally recognized that the G band is associated with the E2g mode of graphite and the vibration of the sp2-bonded carbon atoms in a two-dimensional hexagonal lattice, while the D band results from the vibrations of carbon atoms with dangling bonds in the termination plane of disordered graphite or glassy carbon.25 The intensity ratio (IG/ID), which is often applied to correlate the crystal purity and the order degree with the graphite, also reveals that the as-prepared graphene are mainly composed of graphite. A high IG/ID (∼17) is found in the Raman spectrum of graphene, which indicates that there are few defects in the lattice and the surface of graphene and its purity is very high. The 2D band of the as-prepared graphene located at 2700 cm−1 results from the inelastic scattering of two double phonons. I2D/IG is often used to analyze the layers of graphene. If I2D/IG is more than 1, the graphene is a monolayer; if I2D/IG is about 1, the graphene is a bilayer, and if I2D/IG is lower than 1, the graphene may be a few layers or multi-layers. As shown in Fig. 3, it is also found that the I2D/IG is about 1.3, so the layer number of the as-prepared graphene is 1–2. A good order degree of the as-prepared graphene implies that it perhaps has excellent electrical conductivity.
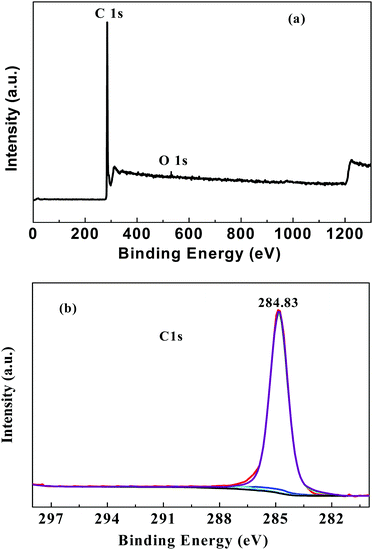
Fig. 2 presents the XPS spectra of the as-prepared graphene.
As seen from Fig. 2a, it can be found that there is an obvious C1s peak (in ∼285 eV) and an extremely weak O1s peak (∼530 eV) in the spectrum. The intensity ratio (IC/IO) is more than 54 (as shown in Table S1, ESI†), which indicates that the oxygen is less than 2%, and the product mainly consists of the element carbon. It is analyzed that trace amounts of oxygen may be introduced during the ball mill and carbonized process, where the oxygen cannot be completely eliminated. Moreover, the high-resolution C1s XPS spectra (Fig. 2b) show strong XPS signals at 284.83 eV (C![[double bond, length as m-dash]](https://www.rsc.org/images/entities/char_e001.gif) C and C–C), and trace C–O/C–O–C and O–C
C and C–C), and trace C–O/C–O–C and O–C![[double bond, length as m-dash]](https://www.rsc.org/images/entities/char_e001.gif) O XPS peaks were observed at 286.36 eV and 288.23 eV, respectively, which also confirms that the as-prepared graphene is mainly composed of the element carbon.
O XPS peaks were observed at 286.36 eV and 288.23 eV, respectively, which also confirms that the as-prepared graphene is mainly composed of the element carbon.
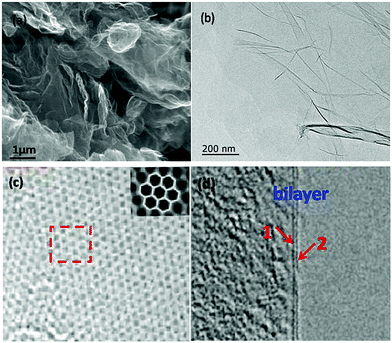
The SEM image of the as-prepared graphene is shown in Fig. 3a. It exhibits distinct thin layers of graphene. On the other hand, different sizes suggest a progressive consumption of the material probably due to the fact that the activation affects not only the surface but also the inner parts of the material. Meanwhile, as illustrated in Fig. 3b, the TEM image shows the presence of graphene with bi-layers as relatively transparent sheets, and part of the layers curl into curled wrinkles, which can decrease the surface energy of graphene. As shown in Fig. 3c and its inset, we find a two-dimensional cellular lattice structure, in which the mono-layer carbon atoms are closely packed under high resolution TEM (HRTEM). Moreover, bi-layer sheets are also inevitably observed through the high resolution imaging of the graphene edges as shown in Fig. 3d.
 | ||
| Fig. 3 SEM and TEM images of as-prepared graphene: (a) SEM image, (b) TEM image, (c) and (d) HRTEM images. | ||
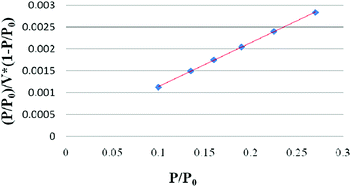
To validate the layer number of as-prepared graphene, the SSA of the as-prepared graphene was further measured. Fig. 4 shows the BET adsorption curve of as-prepared graphene, and the test data are listed in Table S2 (ESI†).
As shown in Fig. 4, there is a linear relationship between (P/P0)/V × (1 − P/P0) and P/P0, indicating the good adsorption stability of the as-prepared graphene. From the BET adsorption curve, the test BET SSA of as-prepared graphene is calculated to be 1521.3 m2 g−1 (in Table S2, ESI†), which is about 58% of the theoretical SSA of monolayer graphene. The layer number calculated in terms of the SSA is no more than 2, which is similar to the results from the Raman spectrum. The large SSA of the as-prepared graphene demonstrates that it has high catalytic activity and electrical conductivity.
The electrical conductivity of the as-prepared graphene is found to be about 4618 S m−1, as shown in Table 1. Graphene oxide and pure graphene have had respective conductivities of 20.7 S m−1 and 4760 S m−1 reported.26 Previous work has shown that graphite oxide is almost insulating (6.0 × 10⁵ S m−1) in nature.27 The electrical conductivity of the as-prepared graphene is very close to that of pure graphene. This is due to the good order degree and the low degree of oxidation of the as-prepared graphene.
| Samples | Resistance (Ω) | Electrical conductivity (S m−1) |
|---|---|---|
| Graphene oxide | 88.5 | 20.7 |
| Pure graphene | 0.69 | 4760 |
| As-prepared graphene | 0.71 | 4618 |
In summary, high-quality and low-cost graphene was prepared by ball-milling and graphitization with discarded polyethylene plastic bags. Raman spectrum shows the typical graphitization feature (G band and 2D band) of the as-prepared graphene, which is of few layers. The XRD pattern reveals that the as-prepared graphene has an obvious characteristic peak at 26°. The atomic ratio of C and O for the as-prepared graphene is more than 54. The SEM and TEM images show that the size range and the layer number of the as-prepared graphene are 4–10 μm and 2, respectively. The BET SSA of the as-prepared graphene is 1521.3 m2 g−1. The electrical conductivity of the as-prepared graphene is up to 4618 S m−1 at ambient temperature. Its relatively high conductivity value and ease of preparation make it potentially useful in the fabrication of supercapacitors, flexible electrodes and biosensors.
Conflicts of interest
There are no conflicts to declare.Notes and references
- A. K. Geim, Science, 2009, 324, 1530–1534 CrossRef CAS.
- G. Kalita, M. E. Ayhan, S. Sharma, S. M. Shinde, D. Ghimire, K. Wakita, M. Umeno and M. Tanemura, Corros. Sci., 2014, 78, 183–187 CrossRef CAS.
- K. S. Novoselov, V. I. Falko, L. Colombo, P. R. Gellert, M. G. Schwab and K. Kim, Nature, 2012, 490, 192–200 CrossRef CAS.
- J. Ning, L. Hao, X. F. Zhang, M. H. Liang and L. J. Zhi, Sci. China: Chem., 2014, 57, 259–263 CrossRef CAS.
- J. Gu, X. P. Zhang, A. M. Pang and J. Yang, Nanotechnology, 2016, 27, 165704 CrossRef.
- R. S. Edwards and K. S. Coleman, Nanoscale, 2012, 5, 38–51 RSC.
- W. C. Ren and H. M. Cheng, Nat. Nanotechnol., 2014, 9, 726–730 CrossRef CAS.
- F. Bonaccorso, A. Lombardo, T. Hasan, Z. Sun, L. Colombo and A. C. Ferrari, Mater. Today, 2012, 15, 564–589 CrossRef CAS.
- N. J. Song, C. M. Chen, C. X. Lu, Z. Liu, Q. Q. Kong and R. Cai, J. Mater. Chem. A, 2014, 2, 16563–16568 RSC.
- S. Abdolhosseinzadeh, H. Asgharzadeh, H. S. Kim and K. S. Novoselov, Sci. Rep., 2015, 5, 10160 CrossRef CAS.
- J. N. Coleman, Acc. Chem. Res., 2013, 46, 14–22 CrossRef CAS.
- N. Mishra, J. Boeckl, N. Motta and F. Iacopi, Phys. Status Solidi, 2016, 213, 2277–2289 CrossRef CAS.
- Y. Zhang, L. Y. Zhang and C. W. Zhou, Acc. Chem. Res., 2013, 46, 2329–2339 CrossRef CAS.
- B. Tang and G. X. Hu, Chem. Vap. Deposition, 2014, 20, 14–22 CrossRef CAS.
- A. J. Strudwick, N. E. Weber, M. G. Schwab, M. Kettner, R. T. Weitz, J. R. Wünsch, K. Müllen and H. Sachdev, ACS Nano, 2015, 9, 31–42 CrossRef CAS.
- A. Ohidul, B. Mukaddis and Y. J. Ding, Resour., Conserv. Recycl., 2018, 132, 121–129 CrossRef.
- R. M. Miller, Thesis Submitted for MSc in Sustainable Development, Faculty of Geosciences, Universiteit Utrecht, 2012.
- K. Murad and N. Ramlee, 2012 IEEE Symposium on Business, Engineering and Industrial Applications, 2012, pp. 244–249.
- B. Luijsterburg and H. Goossens, Resour., Conserv. Recycl., 2014, 85, 88–97 CrossRef.
- S. G. Kang and J. X. Zhu, Adv. Mater. Res., 2014, 878, 112–121 Search PubMed.
- E. R. Zettler, T. J. Mincer and L. A. Amaral-Zettler, Environ. Sci. Technol., 2013, 47, 7137–7146 CrossRef CAS.
- N. A. El Essawy, S. M. Ali, H. A. Farag, A. H. Konsowa, M. Elnouby and H. A. Hamad, Ecotoxicol. Environ. Saf., 2017, 145, 57–68 CrossRef CAS.
- W. A. Algozeeb, P. E. Savas, D. X. Luong, W. Y. Chen, C. Kittrell, M. Bhat, R. Shahsavari and J. M. Tour, ACS Nano, 2020, 14(11), 15595–15604 CrossRef.
- M. G. Stanford, K. V. Bets, D. X. Luong, P. A. Advincula, W. Y. Chen, J. T. Li, Z. Wang, E. A. McHugh, W. A. Algozeeb, B. I. Yakobson and J. M. Tour, ACS Nano, 2020, 14(10), 13691–13699 CrossRef CAS.
- Z. L. Zhang, X. W. Zhang, Y. L. Wang, Y. Wang and H. T. Wang, ACS Nano, 2019, 9, 3999–4006 Search PubMed.
- S. Bose, T. Kuila, M. E. Uddin, N. H. Kim, A. K. T. Lau and J. H. Lee, Polymer, 2010, 51, 5921–5928 CrossRef CAS.
- C. Shan, H. Yang, D. Han, Q. Zhang, A. Ivaska and L. Niu, Langmuir, 2009, 25, 12030–12033 CrossRef CAS.
Footnote |
| † Electronic supplementary information (ESI) available. See DOI: 10.1039/d0cc06999j |
| This journal is © The Royal Society of Chemistry 2021 |


