
 Open Access Article
 This Open Access Article is licensed under a Creative Commons Attribution-Non Commercial 3.0 Unported Licence
Dual concentration-dependent effect of ascorbic acid on PAP(248–286) amyloid formation and SEVI-mediated HIV infection†
Satabdee
Mohapatra‡
 a,
Guru Krishna Kumar
Viswanathan‡
a,
Lukas
Wettstein‡
b,
Elad
Arad
c,
Ashim
Paul
a,
Vijay
Kumar
a,
Raz
Jelinek
c,
Jan
Münch
b and
Daniel
Segal
*a
a,
Guru Krishna Kumar
Viswanathan‡
a,
Lukas
Wettstein‡
b,
Elad
Arad
c,
Ashim
Paul
a,
Vijay
Kumar
a,
Raz
Jelinek
c,
Jan
Münch
b and
Daniel
Segal
*a
aShmunis School of Biomedicine and Cancer Research, George S. Wise Faculty of Life Sciences, Tel Aviv University, Tel Aviv 69978, Israel. E-mail: dsegal@post.tau.ac.il
bInstitute of Molecular Virology, Ulm University Medical Center, Ulm, 89081, Germany
cDepartment of Chemistry and Ilse Katz Institute for Nanoscale Science and Technology, Ben Gurion University of the Negev, Beer Sheva 8410501, Israel
First published on 10th August 2021
Abstract
Human semen contains various amyloidogenic peptides derived from Prostatic Acid Phosphatase (PAP) and Semenogelin proteins that are capable of enhancing HIV-1 infection when assembled into fibrils. The best characterized among them is a 39 amino acid peptide PAP(248–286), which forms amyloid fibrils termed SEVI (semen-derived enhancer of viral infection) that increase the infectivity of HIV-1 by orders of magnitude. Inhibiting amyloid formation by PAP(248–286) may mitigate the sexual transmission of HIV-1. Several vitamins have been shown to reduce the aggregation of amyloids such as Aβ, α-Synuclein, and Tau, which are associated with neurodegenerative diseases. Since ascorbic acid (AA, vitamin C) is the most abundant vitamin in semen with average concentrations of 0.4 mM, we here examined how AA affects PAP(248–286) aggregation in vitro. Using ThT binding assays, transmission electron microscopy, and circular dichroism spectroscopy, a dual and concentration-dependent behavior of AA in modulating PAP(248–286) fibril formation was observed. We found that low molar ratios of AA:PAP(248–286) promoted whereas high molar ratios inhibited PAP(248–286) fibril formation. Accordingly, PAP(248–286) aggregated in the presence of low amounts of AA enhanced HIV-1 infection, whereas excess amounts of AA during aggregation reduced the infectivity enhancing effect in cell culture. Collectively, this work provides a biophysical insight into the effect of AA, an important seminal component, on SEVI fibrillation which might impact amyloid formation kinetics, thereby modulating the biological activity of semen amyloids.
1 Introduction
Acquired Immune Deficiency Syndrome (AIDS), a disease associated with progressive immune system failure, is caused by the Human Immunodeficiency Virus type 1 (HIV-1, HIV). Being a global pandemic and contagious disease, the vast majority (∼80%) of HIV infections are due to sexual transmission of the virus.1,2 However, rates of sexual HIV transmission are low, with rates of 1–2 cases per 1000 coital acts.1 During acute infection, high viral titers may increase the probability of heterosexual transmission.2 Various other biological factors play an additional role in the sexual transmission of the virus. For example, in vitro studies showed that semen enhances HIV infection of several cell types, including primary macrophages and CD4+ T cells.3,4 Since semen is the primary carrier for sexual viral transmission, it has been hypothesized that cofactors in seminal plasma play an important role in the transmission of the virus by increasing its infectivity.5 Extensive analysis of semen-derived components indicated that various amyloidogenic fragments derived from peptides of Prostatic Acid Phosphatase (PAP) and Semenogelin proteins are present in semen and enhance HIV infection when assembled into fibrils.4–8 The 39 amino acid peptide PAP(248–286) is the best characterized amyloidogenic peptide in semen.5,6 PAP(248–286) has been shown to form positively charged amyloid fibrils termed SEVI (semen-derived enhancer of viral infection) that are capable of increasing the infectivity of HIV by orders of magnitude.4,5The highly cationic nature and the fibrillar form of SEVI6 facilitate the formation of an electrostatic bridge between the anionic membranes of virions and cells, which leads to increased viral attachment and hence enhanced fusion and infection rates.7–9 Antagonizing the HIV-enhancing activity of SEVI might abrogate or reduce sexual HIV-1 transmission rates. Several compounds have been tested in the past decade to minimize the viral infection-enhancing activity of semen amyloids for lowering the sexual transmission of HIV, including small molecules, peptides, metal ions, polyanions, and nanoparticles.6,10–17
Small molecules, in particular naturally derived active compounds, have been amongst the most promising candidates for anti-amyloid drugs.18 In this context, vitamins have been extensively studied and found to have a protective effect towards amyloid aggregation implicated in neurodegenerative disorders such as Alzheimer's disease (AD) and Parkinson's disease (PD).19,20 Vitamin B12 was demonstrated to inhibit α-synuclein fibrillogenesis and reduce amyloid-induced cytotoxicity in vitro.21 Likewise, Vitamin K was shown to interact with the N-terminus of α-synuclein and modulate its fibrillization in vitro.22 Vitamins A, C, E, and K were found to inhibit Aβ aggregation and destabilize preformed Aβ fibrils in a dose-dependent manner.23–27 Similarly, folic acid (Vitamin B6) and Vitamin B12 also inhibited in vitro Tau aggregation.28 Notably, oral supplementation of vitamin C and E was demonstrated to reduce amyloid deposition in both the cortex and the hippocampus of transgenic mice model of Alzheimer's disease.29–31
Human seminal plasma, the cell-free fraction of semen, is a mixture of several components, including metal ions, sugars, and proteins, and also contains significant concentrations of vitamins B, C, and E.32 Among them, vitamin C is present at the highest concentration of 380 ± 115 μM.33,34 Given that vitamin C and SEVI fibrils are present in semen, we were wondering whether “anti-amyloidogenic” vitamin C affects SEVI formation and function. To this end, we examined the effect of vitamin C, also called ascorbic acid (AA), on the formation of PAP(248–286) fibrils using biophysical techniques and evaluated its impact on SEVI mediated HIV infection using cell-based assays. Using ThT binding assay, transmission electron microscopy, and circular dichroism spectroscopy, a dual and concentration-dependent behavior of AA in modulating PAP(248–286) fibril formation was investigated. We observed that at low molar ratios, AA promoted PAP(248–286) fibril formation, and at higher molar ratios, AA inhibited it. We also found that at equimolar or higher concentrations of AA, SEVI-mediated infectivity enhancement was reduced, whereas a 5- and 10-fold excess of SEVI over AA resulted in increased infection rates. Collectively, this work provides a biophysical insight into the effect of AA, an important seminal component, on SEVI fibrillation and modulation of semen-mediated HIV infection.
2 Materials and methods
2.1 Materials
All chemicals were obtained from Sigma-Aldrich (Rehovot, Israel) unless otherwise stated. Synthetic PAP(248–286) peptide (>95% purity, theoretical pI/Mw: 10.21/4551.44) was purchased from GenScript (Piscataway, USA). All chemicals and reagents were of analytical grade. TZM-bl cells were obtained from the NIH ARRRP from Dr John C. Kappes, Dr Xiaoyun Wu, and Tranzyme, Inc. The cell titer glo® Luminescent Cell Viability Kit was obtained from Promega (Walldorf, Germany).2.2 Stock preparation
Phosphate-Buffered Saline (PBS 200 mL, 1.6 g of NaCl, 0.04 g of KCl, 0.288 g of Na2HPO4, 0.048 g of KH2PO4), pH 7.4 was prepared and filtered through a 0.22 μm filter (Millex-GV, Merck Millipore, MA, USA). Stock of 4 mg mL−1 PAP(248–286) was prepared by dissolving the lyophilized peptide in PBS, followed by sonication (3 cycles × 3 min). A 10 mM stock solution of AA was freshly prepared in PBS each time before the aggregation assays, and the pH was adjusted to 7.4 using sodium hydroxide solution. A stock solution of Thioflavin T (ThT, 4 mM) was prepared in PBS and filtered using a 0.22 μm syringe filter.2.3 PAP(248–286) fibrillation monitored using ThT fluorescence
PAP(248–286) in a reaction concentration of 2 mg mL−1 was allowed to aggregate in the absence or presence of AA at various molar ratios (PAP(248–286)![[thin space (1/6-em)]](https://www.rsc.org/images/entities/char_2009.gif) :AA – 10:1, 5:1, 1:1, 1:5 and 1:10) in PBS. The reaction mixtures were incubated in a thermoshaker (MRC Instruments) at 37 °C with continuous orbital shaking (1200 rpm) for 84 h. An aliquot of 10 μL was withdrawn from each reaction mixture at 12 h intervals and frozen at −20 °C. At the end of 84 h, samples were thawed to room temperature, ThT was added to a final concentration of 50 μM and incubated in the dark for 2 h at 37 °C. Subsequently, samples were transferred to a 384-well flat black plate (Corning), and the ThT fluorescence intensity (λex = 440 nm; λem = 480 nm) was measured using a microplate reader (Infinite M200, Tecan, Switzerland). All measurements were performed in triplicate, and the assay was repeated to ensure reproducibility.
:AA – 10:1, 5:1, 1:1, 1:5 and 1:10) in PBS. The reaction mixtures were incubated in a thermoshaker (MRC Instruments) at 37 °C with continuous orbital shaking (1200 rpm) for 84 h. An aliquot of 10 μL was withdrawn from each reaction mixture at 12 h intervals and frozen at −20 °C. At the end of 84 h, samples were thawed to room temperature, ThT was added to a final concentration of 50 μM and incubated in the dark for 2 h at 37 °C. Subsequently, samples were transferred to a 384-well flat black plate (Corning), and the ThT fluorescence intensity (λex = 440 nm; λem = 480 nm) was measured using a microplate reader (Infinite M200, Tecan, Switzerland). All measurements were performed in triplicate, and the assay was repeated to ensure reproducibility.
2.4 PAP(248–286) aggregation monitored by measuring intrinsic tyrosine fluorescence
Intrinsic Tyrosine fluorescence of aggregating PAP(248–286) sample was monitored by incubating 2 mg mL−1 of peptide in the absence or presence of AA at various molar ratios (PAP(248–286):AA – 10:1, 5:1, 1:1, 1:5 and 1:10) in PBS as mentioned in Section 2.3. At the end of 84 h, samples were thawed to room temperature and transferred to a 96 well flat black plate (Corning). The total volume used for analysis was made up to 100 μL using PBS. Subsequently, the Tyrosine-specific fluorescence intensity was recorded on a microplate reader (Infinite M200, Tecan, Switzerland). The excitation and emission wavelengths were 276 nm and 303 nm, respectively. All measurements were performed in triplicate, and the assay was repeated to ensure reproducibility.
2.5 ANS fluorescence assay
A 10 μL aliquot from PAP(248–286) samples aggregated in the absence or presence of different concentrations of AA were mixed with an equimolar ratio of ANS and incubated in the dark for 2 h at room temperature. Subsequently, samples were transferred to a 384-well flat black plate, and the ANS fluorescence intensity was recorded with λex = 380 nm and λem between 420 nm and 700 nm.2.6 Circular dichroism spectroscopy
Circular dichroism (CD) spectra of PAP(248–286) samples (0.44 mM) aggregated in the absence or presence of various concentrations of AA were measured by using a Chirascan spectrometer at room temperature. Samples were diluted to 0.35 mM, and a 250 μL aliquot from this was transferred to a quartz cuvette (path length: 1 mm) for the far-UV measurements (190–260 nm). CD spectra of blank solutions, i.e., buffer with different AA concentrations in the absence of PAP(248–286), were subtracted from the sampled signal.2.7 Transmission electron microscopy
Samples were prepared for Transmission electron microscopy (TEM) by drop-casting 10 μL aliquot of the aggregated PAP(248–286) with various AA concentrations onto carbon-coated copper grids (400 mesh, Electron Microscopy Sciences (EMS), Hatfield, PA, USA). The samples were allowed to adhere for 1 min, and the excess sample was blotted off using filter paper. The grids were negatively stained with 1% phosphotungstic acid. Excess fluid was removed, and the grids were left to dry overnight before imaging. The samples were imaged by a JEM-1400 TEM (JEOL, Tokyo, Japan), operated at 80 kV.2.8 Dynamic light scattering
Dynamic light scattering measurements of the aggregated sample after 84 h of incubation was carried out using Zetasizer NanoZS (Malvern Instruments, Malvern, UK). Prior to the measurement, samples were filtered through 1 mL filter tips, and changes in the aggregation behavior were measured by calculating the hydrodynamic diameter (Dh) of the aggregated species in the solution. A 633 nm wavelength He–Ne-laser was used to detect backscattered light at a fixed angle of 173°. Scattering data were collected as an average of 3 measurements with 12 scans for each measurement. Data were processed with the Malvern Zetasizer Software (Malvern Instruments).2.9 Isothermal titration calorimetry
ITC measurements were performed as described previously, with minor modifications.35,36 Briefly, fresh monomeric PAP(248–286) (600 μM) was dissolved in deionized water (DIW), and PBS was added to a final 1× concentration. AA (50 mM) was freshly dissolved in DIW and titrated with NaOH (5 M) up to physiological pH, and the sample was diluted with DIW and PBS to a working concentration of 80 μM. Both solutions were separately incubated in an ITC degassing chamber for 10 min at 37 °C before the ITC measurements. A sample of 300 μL AA was inserted into the Nano ITC low volume cell (TA Instruments, Newcastle, DE, USA), and the titrating syringe was filled with 52 μL of fresh monomeric PAP(248–286) solution. The system was allowed to reach a stable temperature of 37 °C along 7000 s and collected baseline for 180 s. Subsequently, monomeric PAP(248–286) was titrated to the AA solution or PBS. Titration was carried out in 2.5 μL aliquots and allowed to equilibrate for 300 s before the next drop, along twenty drops, of a total 48.75 μL (1st was half volume). The resulting isotherm was analyzed using Nanoanalyze software using an independent interaction model, and the statistical analysis was applied using 10000 iterations to 99% fitting. Baseline correction was performed by titrating PAP(248–286) to PBS.
2.10 Molecular docking
The 3D structures of the monomeric PAP(248–286) peptide and AA were retrieved from the Protein Data Bank (PDB ID: 2L3H),37 and PubChem (CID: 54670067), respectively. The molecular docking study of PAP(248–286) with AA was performed using AutoDock 4.2 software (v1.5.6).38 Water molecules and other heteroatoms were removed from the PDB-retrieved peptide structure. Polar hydrogen atoms were added, and the Kollman united atomic partial charges were assigned to the peptide. The grid size was set to 65 × 60 × 60 points along the X, Y, and Z axes, respectively, with a grid spacing of 0.425 Å, and the grid map covering the whole peptide was calculated using the autogrid. The default search function in the Lamarckian genetic algorithm was used for the docking analysis. Docking of the ligand was performed on the whole peptide sequence. Three independent docking runs were carried out for the system. LigPlot+39 and PyMOL (https://pymol.org/2/) were used for the visualization and analysis of the docked conformations.2.11 HIV infection assay
10000 TZM-bl (obtained through the NIH AIDS Reagent Program, Division of AIDS, NIAID, NIH: TZM-bl from Dr John C. Kappes, Dr Xiaoyun Wu, and Tranzyme Inc.) cells per well were seeded in 100 μL of DMEM supplemented with 10% fetal bovine serum, 2 mM glutamine, 100 U mL−1 penicillin, 100 μg mL−1 streptomycin (DMEM complete) in a 96-well flat-bottom plate. The next day, the medium was replaced by 180 μL of DMEM complete. Serial dilutions of HIV-1 strain NL4-3 92TH014.12 were mixed 1:1 with PAP(248–286) previously aggregated in the presence or absence of AA (PAP(248–286):AA – 10:1, 5:1, 1:1, 1:5 and 1:10) and incubated for 5 min at RT. 20 μL of HIV: PAP(248–286):AA were used to infect TZM-bl cells in triplicates. At 3 days post-infection, infection rates were assessed by measuring β-galactosidase activity in relative light units per second (RLU per s) using the one-Step Tropix Gal-Screen Kit.
2.12 Cell viability and HIV-1 stability assay
Cells were cultured as described above. The day after seeding, medium was replaced by 80 μL of DMEM complete and 20 μL of serially diluted AA were added. Cell viability was assessed at 3 days after addition of AA by measuring ATP levels in cell lysates using the Cell titer glo® Luminescent Cell Viability Kit. For assessing the impact of preincubation of HIV-1 with AA, HIV-1 strain NL4-3 92TH014.12 was mixed 1:1 with serial dilutions of AA and incubated for 5 min at RT. 20 μL of HIV-1: AA were used to infect TZM-bl cells in triplicates. Infection rates were measured as described above.
2.13 Statistics and analysis
Statistical analysis was performed in GraphPad Prism version 9.1.1 using 2-way ANOVA with Dunnett's multiple comparisons test as indicated in the figure legends.3 Results
The profound inhibitory effect of vitamins (A, B6, B12, C, E, and K) on amyloid-related diseases is well established.26,27,29–31 Seminal plasma contains several vitamins, out of which vitamin C (ascorbic acid, henceforth AA) is present at a concentration of ∼0.4 ± 0.1 mM.33 SEVI fibrils, which are present in seminal plasma under physiological conditions, are considered functional amyloid as they are involved in spermatozoa quality control, selection, clearance,40 and exert antimicrobial activity.41 In the present study, we aimed to evaluate the effect of AA on PAP(248–286) aggregation into amyloid fibrils and SEVI-mediated enhancement of HIV-1 infection.3.1 Ascorbic acid modulates SEVI fibril formation
To understand the effect AA on the aggregation of PAP(248–286), ThT-based fluorescence assays were performed. PAP(248–286) peptide monomer (0.44 mM) was incubated in the absence or presence of five different concentrations of AA (0.044 mM, 0.088 mM, 0.44 mM, 2.2 mM and 4.4 mM) and allowed to aggregate for 84 h at 37 °C, 1200 rpm. The results of the aggregation assay are shown in Fig. 1a. ThT is a benzothiazole-based molecule that shows an enhanced fluorescence emission upon binding to the cross β-sheet structure of amyloids and is hence widely used as an amyloid reporter dye.42 PAP(248–286) monomers (0.44 mM) in the absence of AA formed amyloidogenic aggregates after 84 h under assay conditions, as evident from a marked increase in ThT fluorescence intensity. The ThT fluorescence in the absence of AA shows a characteristic sigmoidal pattern specific to aggregation kinetics of amyloid formation42 with a lag phase of >24 h (initial nucleation process) followed by an exponential increase (oligomerization process) and plateau fluorescence (fibril maturation process). A decrease in ThT signal was noted after a plateau fluorescence was reached, which is typically seen in the aggregation of other amyloids, including SEVI.43–47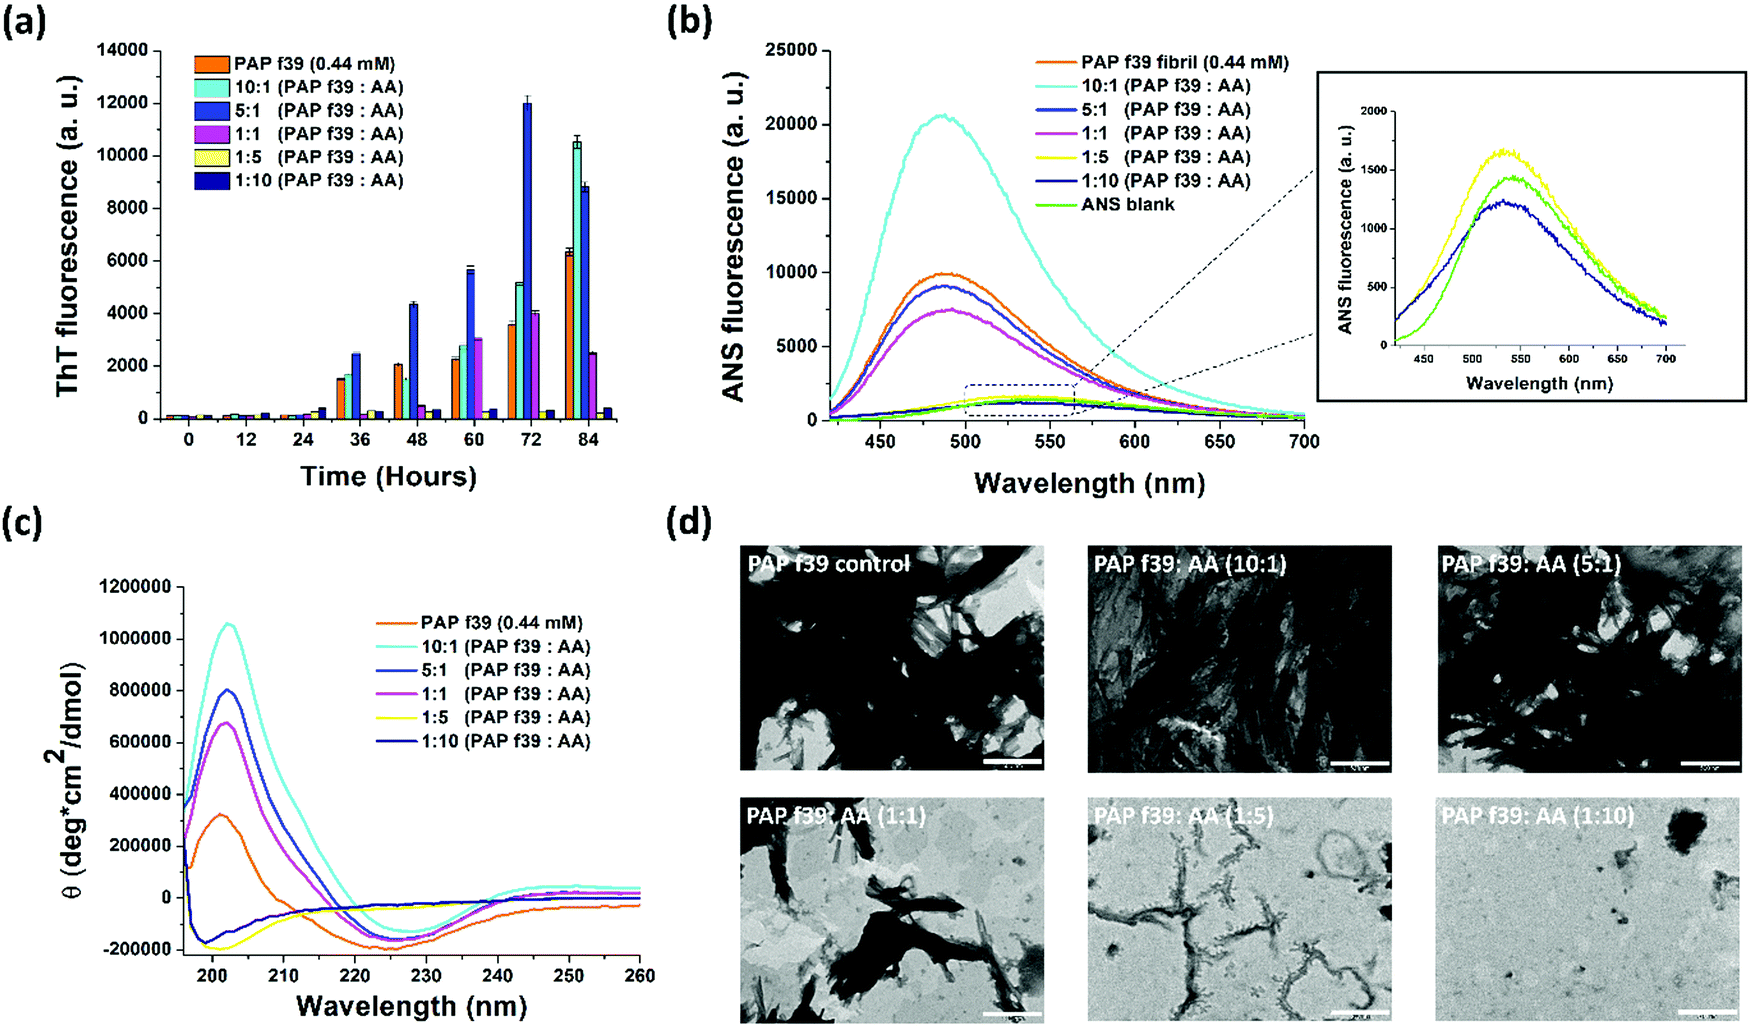 | ||
| Fig. 1 (a) ThT fluorescence assay and (b) ANS fluorescence assay showing the effect of various concentrations of ascorbic acid (AA) on PAP(248–286) aggregation; inset in ANS plot shows zoomed-in data points of 5- and 10-molar excess of AA along with ANS blank. (c) Circular dichroism spectroscopy showing the formation of β-sheets by PAP(248–286) in the absence of AA and the retention of native random coil structure of PAP(248–286) monomers in the presence of 5- and 10-molar excess of AA. (d) Representative TEM images depicting the effect of AA on PAP(248–286) fibril formation. Scale represents 500 nm. | ||
Incubation of PAP(248–286) with AA resulted in three types of ThT fluorescence patterns. (i) When incubated with low concentrations of AA (i.e., 0.044 mM and 0.088 mM) corresponding to a 10:1 or 5:1 molar ratio of PAP(248–286):AA, respectively, a lag phase in kinetics was observed, comparable to control PAP(248–286) in the absence of AA (Fig. S1, ESI†). However, these samples exhibited a drastic increase in fluorescence intensity, several folds higher than the control sample indicating a higher fibril content than the control PAP(248–286) (Fig. 1a). (ii) At an equimolar ratio i.e., 1:1 PAP(248–286):AA, which is similar to the physiological concentration of AA (0.44 mM) in the seminal plasma, a prolonged lag phase in PAP(248–286) aggregation kinetics (up to ∼48 h) was observed (Fig. S1, ESI†), while ThT signals after 60 and 72 h were comparable to PAP(248–286) signals in the absence of AA (Fig. 1a). (iii) PAP(248–286) aggregated in the presence of excess of AA (i.e., 2.2 mM and 4.4 mM) corresponding to 1:5 and 1:10 molar ratio of PAP(248–286):AA, respectively, resulted in a significantly prolonged lag phase (up to 84 h) of aggregation along with a notable decrease in levels of ThT fluorescence intensity (Fig. 1a and Fig. S1, ESI†). This outcome indicates that a higher concentration of AA curbed PAP(248–286) amyloid formation.
Intrinsic fluorescence measurement is a probe-less method based on aromatic residues present in the protein that gives insights into the early stages of protein aggregation.48,49 Aggregation of PAP(248–286) in the absence or presence of AA was monitored using intrinsic Tyrosine fluorescence. When PAP(248–286) was allowed to aggregate in the absence of AA, intrinsic fluorescence contributed by two Tyrosine residues located at the C-terminus of the peptide started decaying after 36 h, signifying an initial oligomerization of the peptide (Fig. S2, ESI†). This data is comparable to the aggregation kinetics (lag phase) monitored using ThT fluorescence (Fig. 1a). The drop in Tyrosine fluorescence emission signal further continued until the endpoint of the assay suggestive of aggregation mediated quenching of its fluorescence due to the burial of Tyrosine residues in the aggregate core (Fig. S2, ESI†).50,51 Interestingly, a dose-dependent effect appeared evident when the peptide was allowed to aggregate in the presence of AA. At lower AA concentrations (44 μM and 88 μM, corresponding to PAP(248–286):AA of 10:1 or 5:1, respectively), a notable reduction in the fluorescence was observed at early time points (12–24 h) owing to the extensive fibrillation. Conversely, at higher concentrations of AA (2.2 mM and 4.4 mM) a time-dependent increase in the Tyrosine fluorescence signal was visualized, which suggested the stabilization of the peptides’ native conformation and inhibition of higher-order aggregate formation.
To substantiate the findings of ThT assay and intrinsic Tyrosine fluorescence assay, we employed ANS fluorescence assay. ANS is a charged, aromatic fluorescence dye that enables detection of the formation and disruption of solvent-exposed hydrophobic patches of amyloid fibrils.52,53 ANS dye in aqueous solution is weakly fluorescent with λex = 380 nm and λem = 535 nm52 but turns highly fluorescent with a blue shift in its emission spectrum (λem = 460–490 nm) when bound to amyloid structures.53
First, a scan with free ANS dye in PBS without PAP(248–286) (ANS blank) was performed and found that it had an emission maximum at 535 nm (Fig. 1b, inset). Previously, we have shown that the ANS fluorescence emission curve of monomeric PAP(248–286) also had a maximum at 535 nm, thus overlapping with the ANS blank.35 When ANS was incubated with PAP(248–286) fibrillated for 84 h in the absence of AA, a notable blue shift of the ANS emission maximum (λem = 490 nm) with increased fluorescence intensity was observed, validating the presence of amyloid structures. Next, ANS fluorescence spectra of PAP(248–286) samples aggregated for 84 h in the presence of various concentrations of AA were monitored by adding ANS at the endpoint of aggregation reaction. The sample containing 10:1 molar ratio of PAP(248–286):AA was found to have the highest fluorescence intensity with a blue shift of λem to 490 nm, suggesting the presence of higher amyloid content than the control PAP(248–286) aggregates. This observation is in line with the ThT assay data wherein at 84 h, 10:1 molar ratio of PAP(248–286):AA sample displayed the highest ThT fluorescence intensity. A similar blue shift but with lower fluorescence intensity was observed for the other sub- and equimolar ratios of PAP(248–286):AA (5:1 and 1:1) (Fig. 1b). However, a striking change in ANS emission spectra was observed upon incubation with PAP(248–286) samples aggregated in the presence of 5-fold and 10-fold molar excess of AA, which resulted in a fluorescence spectrum coinciding with ANS blank (Fig. 1b, inset). Collectively, ThT and ANS assays suggest that an excess of AA present during the fibrillation process of PAP(248–286) effectively reduces the conversion of PAP (248–286) monomers into amyloid assemblies.
3.2 Molar excess of ascorbic acid preserves the native random coil conformation of PAP(248–286) monomer
The changes in the secondary structure of PAP(248–286) aggregates in the absence or presence of AA were studied using CD spectroscopy. All samples were analyzed at the endpoint of aggregation assay, i.e., 84 h (based on ThT assay). Control PAP(248–286) sample aggregated in the absence of AA showed a negative peak at ∼225 nm and a positive peak at ∼200 nm (Fig. 1c), which depicts a characteristic β-sheet rich conformation of amyloid fibrils.36,54 PAP(248–286) samples aggregated in the presence of sub- or equimolar ratio of PAP(248–286):AA (10:1, 5:1 and 1:1) displayed patterns of CD spectra similar to that of the control, revealing the presence of β-sheet rich amyloid species at the endpoint of the assay (Fig. 1c). This outcome indicated that PAP(248–286) was converted from its initial random coil structure into β-sheet rich structures either in the absence or in the presence of sub- or equimolar ratios of PAP(248–286):AA, mirroring the insights drawn from the ThT and ANS assays.
On the other hand, PAP(248–286) samples aggregated in the presence of high ratios of AA, [PAP(248–286):AA (1:5 and 1:10)] showed striking changes in its secondary structure. As shown in Fig. 1c, peaks corresponding to the β-sheets became non-existent, and only a negative peak at ∼198 nm was recorded for both samples. A negative peak in CD spectra at around 195 nm is the characteristic of random coil conformation of a protein/peptide and is consistent with the structure of PAP(248–286) monomer.55,56 Therefore, at 5-fold or 10-fold molar excess, AA was able to preserve the native random coil structure of PAP(248–286) by halting the β-sheet rich fibrillation process.
3.3 Presence of AA during PAP(248–286) fibrillation alters the fibril morphology
The morphology of PAP(248–286) samples that had aggregated in the absence or presence of AA was examined using Transmission Electron Microscopy (TEM). Representative images of the TEM micrographs are shown in Fig. 1d. The control PAP(248–286) sample, i.e., in the absence of AA was found to possess dense, mature, and thick fibrillar morphology. Similarly, PAP(248–286) samples incubated with a low molar ratio of AA, [PAP(248–286):AA (10:1 and 5:1)], also resulted in dense fibrillar structure. At equimolar concentration, the fibrils were shorter in length and less abundant than the control PAP(248–286) fibrils. Interestingly, for PAP(248–286) samples incubated with a high molar ratio of AA, [PAP(248–286):AA (1:5 and 1:10)], minor or no fibrillar structures were visible, suggesting an effective inhibition of fibril formation. Thus, the TEM micrographs corroborate the results obtained from the ThT and ANS assay, as well as CD spectroscopy, and together, present a concentration-dependent modulatory effect of AA on PAP(248–286) fibril formation.
3.4 Size distribution of PAP(248–286) aggregates in the absence or presence of ascorbic acid
Dynamic light scattering (DLS) is employed for defining the hydrodynamic dimensions and size distribution of particles in a liquid phase.57 Specifically, DLS is used as a direct method to determine the effect of inhibitor molecules on amyloid formation.23 In DLS, all particles in the scattering volume are approximated as spheres, and the hydrodynamic diameter (Dh) is measured.57 The size distribution of PAP(248–286) monomer was calculated and compared with PAP(248–286) aggregates formed in the absence or presence of various concentrations of AA. A Dh value of 468.8 nm was recorded for a freshly prepared PAP(248–286) monomeric sample. Control PAP(248–286) aggregates, i.e., in the absence of AA exhibited a Dh value of 1083 nm (Fig. 2a), whereas in the presence of low molar ratio of AA, [PAP(248–286):AA (10:1 and 5:1)] larger aggregates were observed in comparison to the control. A Dh value of 3247 nm and 2021 nm was calculated for 10:1 and 5:1 molar ratio, respectively (Fig. 2b and c). At an equimolar concentration of PAP(248–286) and AA, the size distribution of aggregates was comparable to that of the control with a Dh value of 999.4 nm (Fig. 2d). In contrast, incubation of PAP(248–286) with high concentrations of AA rendered small aggregates with a Dh value of 702.6 nm and 738.5 nm for 1:5 and 1:10 molar ratio of PAP(248–286):AA, respectively (Fig. 2e and f). The results from DLS measurements are in agreement with the above-mentioned biophysical assays and revealed that concentrations of AA higher than the equimolar ratio resulted in species with lower hydrodynamic diameter reflecting inhibition of PAP(248–286) aggregation.
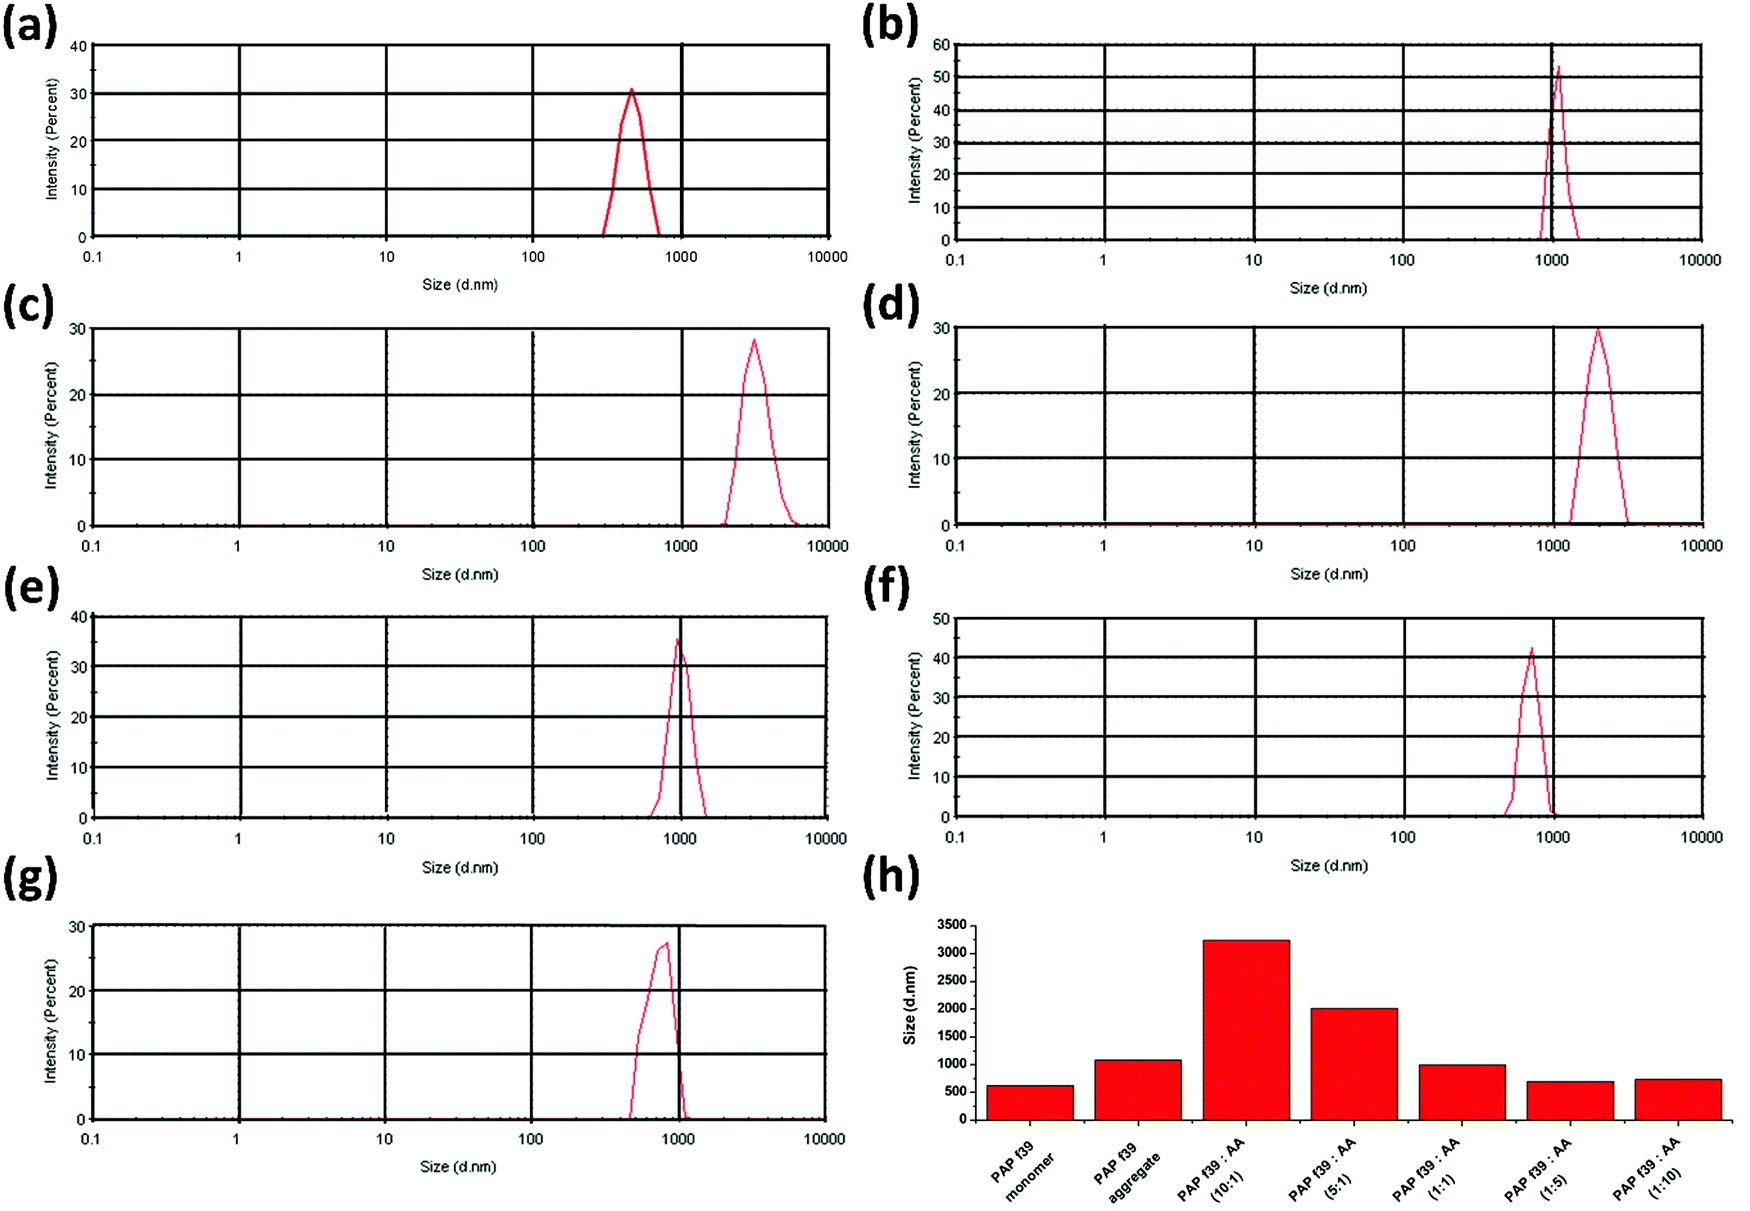 | ||
| Fig. 2 Particle size distribution of PAP(248–286) aggregates measured by DLS. (a) PAP(248–286) monomer (b) control PAP(248–286) aggregate (0.44 mM) in the absence of ascorbic acid. Treatment, molar ratio of PAP(248–286):AA (c) 10:1, (d) 5:1, (e) 1:1, (f) 1:5, and (g) 1:10. (h) Comparison of the hydrodynamic diameter of particles in all tested samples. | ||
3.5 Interaction of ascorbic acid with PAP(248–286) monomer is spontaneous and mediated via hydrogen bonding and electrostatic interactions
The thermodynamic properties of AA binding with PAP(248–286) were evaluated using isothermal titration calorimetry (ITC) measurements. Fresh monomeric preparation of PAP(248–286) (600 μM) was titrated into a cell containing AA (80 μM) to measure the corrected heat and the enthalpy values. Results of this titration and the thermodynamic values calculated are shown in Fig. 3a, b and Table 1. The Kd value of 8.59 μM represented a notable affinitive binding of AA to PAP(248–286) monomers. The stoichiometric ratio (n = 0.79) indicated that, on average more than one AA molecule likely interacted with one PAP(248–286) monomer. Gibbs free energy (ΔG) was calculated from the enthalpy (ΔH) and entropy (ΔS) values and was found to be negative (−30.08 kJ mol−1), suggesting that the binding of AA to PAP(248–286) monomer is a spontaneous process. Furthermore, a negative value of ΔH (−20.49 kJ mol−1) and a positive value for TΔS (9.59 kJ mol−1) were observed at 37 °C. The absolute value of ΔH was larger than TΔS, signifying that the interaction between AA and PAP(248–286) monomer is an enthalpy-driven process. It has been reported that enthalpy-favored binding occurs through hydrogen bonding and electrostatic interactions, whereas entropy-favored binding occurs through hydrophobic contacts.58,59 Therefore, our results indicate that the binding of AA to PAP(248–286) monomer was preferentially due to hydrogen bonding and electrostatic interactions. This phenomenon was specifically significant due to the notable ionic strength of the saline surroundings that could have even partially masked some opposite-charge interactions. In line with these findings, previous studies have attributed the anti-amyloidogenic effect of AA mainly to hydrogen bond formation between the peptide chains and AA.60–64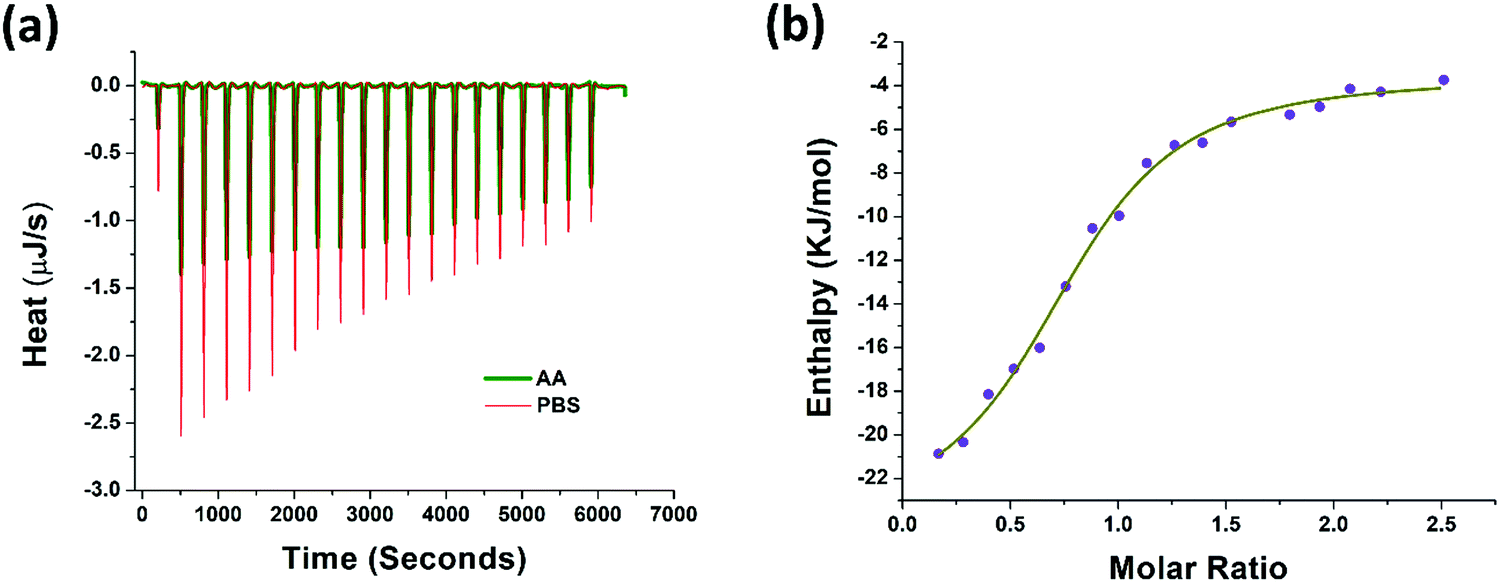 | ||
| Fig. 3 Binding of AA with PAP(248–286) monomer measured by isothermal titration calorimetry (a) heat pattern during PAP(248–286)–AA binding (b) curve showing the enthalpy changes with increasing PAP(248–286) to AA mole fraction. Data were fitted using an independent binding model. | ||
| Parameter | Value | Confidence interval |
|---|---|---|
| K d (M) | 8.59 × 10⁻⁶ | 5.13 × 10⁻⁶ |
| n | 0.791 | 0.06 |
| ΔH (kJ mol−1) | −20.49 | 3.38 |
| ΔS (J mol−1 K−1) | 30.93 | NA |
| ΔG (kJ mol−1) | −30.08 | NA |
3.6 Molecular insights into the interaction of monomeric PAP(248–286) with ascorbic acid
Molecular docking analysis was performed to gain structural insight and to obtain a plausible interaction profile of AA with monomeric PAP(248–286). At the end of the run, ten docked conformations with corresponding binding energies were generated. In the best-docked conformation with the lowest negative binding energy of −4.12 kcal mol−1, AA was predicted to bind with the helical region of PAP(248–286), including residues VAL264–Met271 (Fig. 4a). Here we found that AA formed hydrogen bonds with VAL264, ASN265, HIS270 residues and facilitated hydrophobic contacts with LEU268, ASN269, and MET271 (Fig. 4b). In other docked conformers, AA was found to interact with LYS251 to LEU258, and MET271 to ARG273 regions of PAP(248–286), that were previously reported to bind with small molecules such as EGCG and found to be crucial for modulating PAP(248–286) aggregation43 (Fig. S3, ESI†).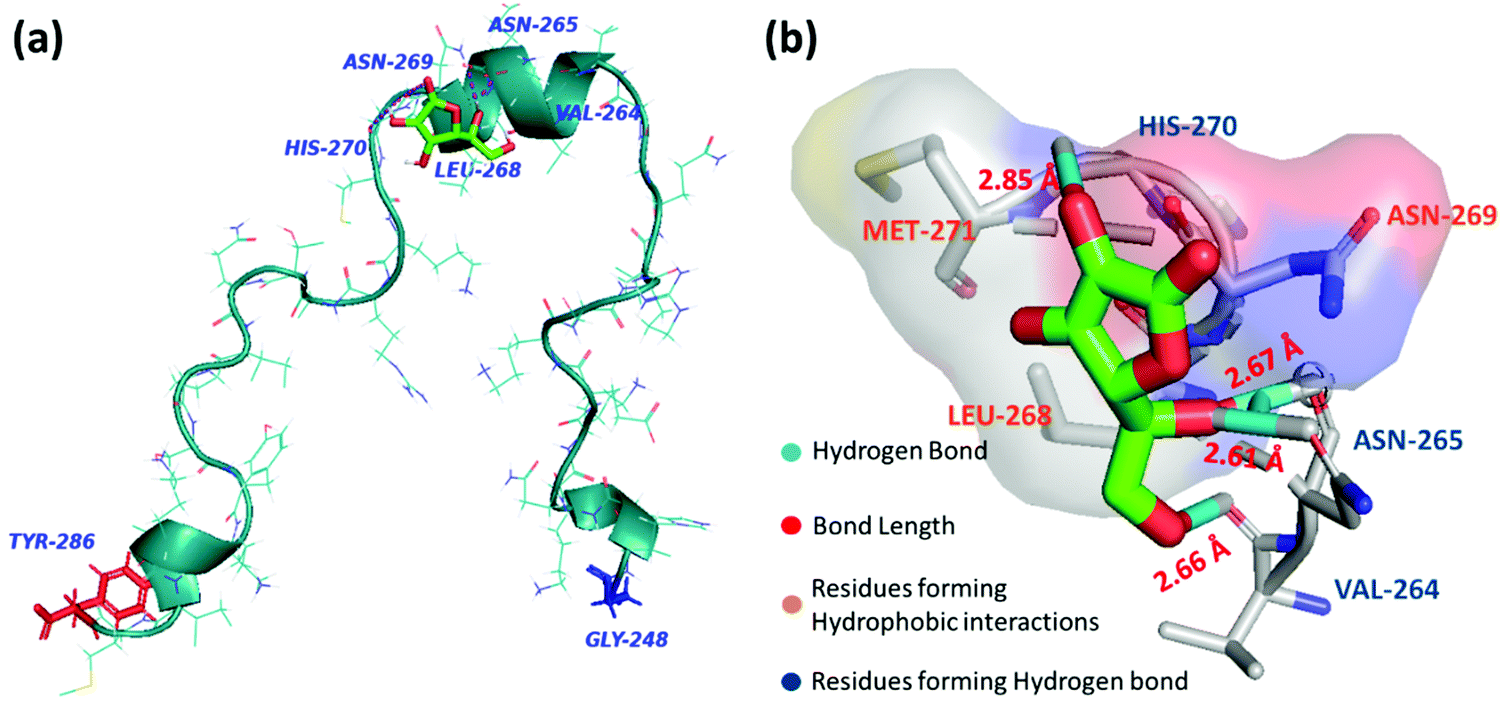 | ||
| Fig. 4 (a) Best docked conformer of PAP(248–286) peptide monomer (turquoise) with AA (green) (b) Interaction diagram of AA with amino acid residues of PAP(248–286) at the binding site. | ||
3.7 Presence of ascorbic acid during PAP(248–286) fibrillation affects HIV infectivity enhancement
We next evaluated how SEVI fibrils that were generated in the presence of different molar ratios of PAP(248–286):AA affect HIV-1 infection. To this end, we first analyzed the effect of AA on cell viability and HIV-1 infection using the widely employed TZM-bl reporter cell line.65–71 To determine the possible cytotoxic effects, cells were incubated with increasing concentrations of AA, and their metabolic activity was measured 3 days later by quantifying intracellular ATP levels using the Cell Titer Glo assay. AA concentrations exceeding 5 mM were highly toxic and resulted in a complete loss of viable cells (Fig. 5a).
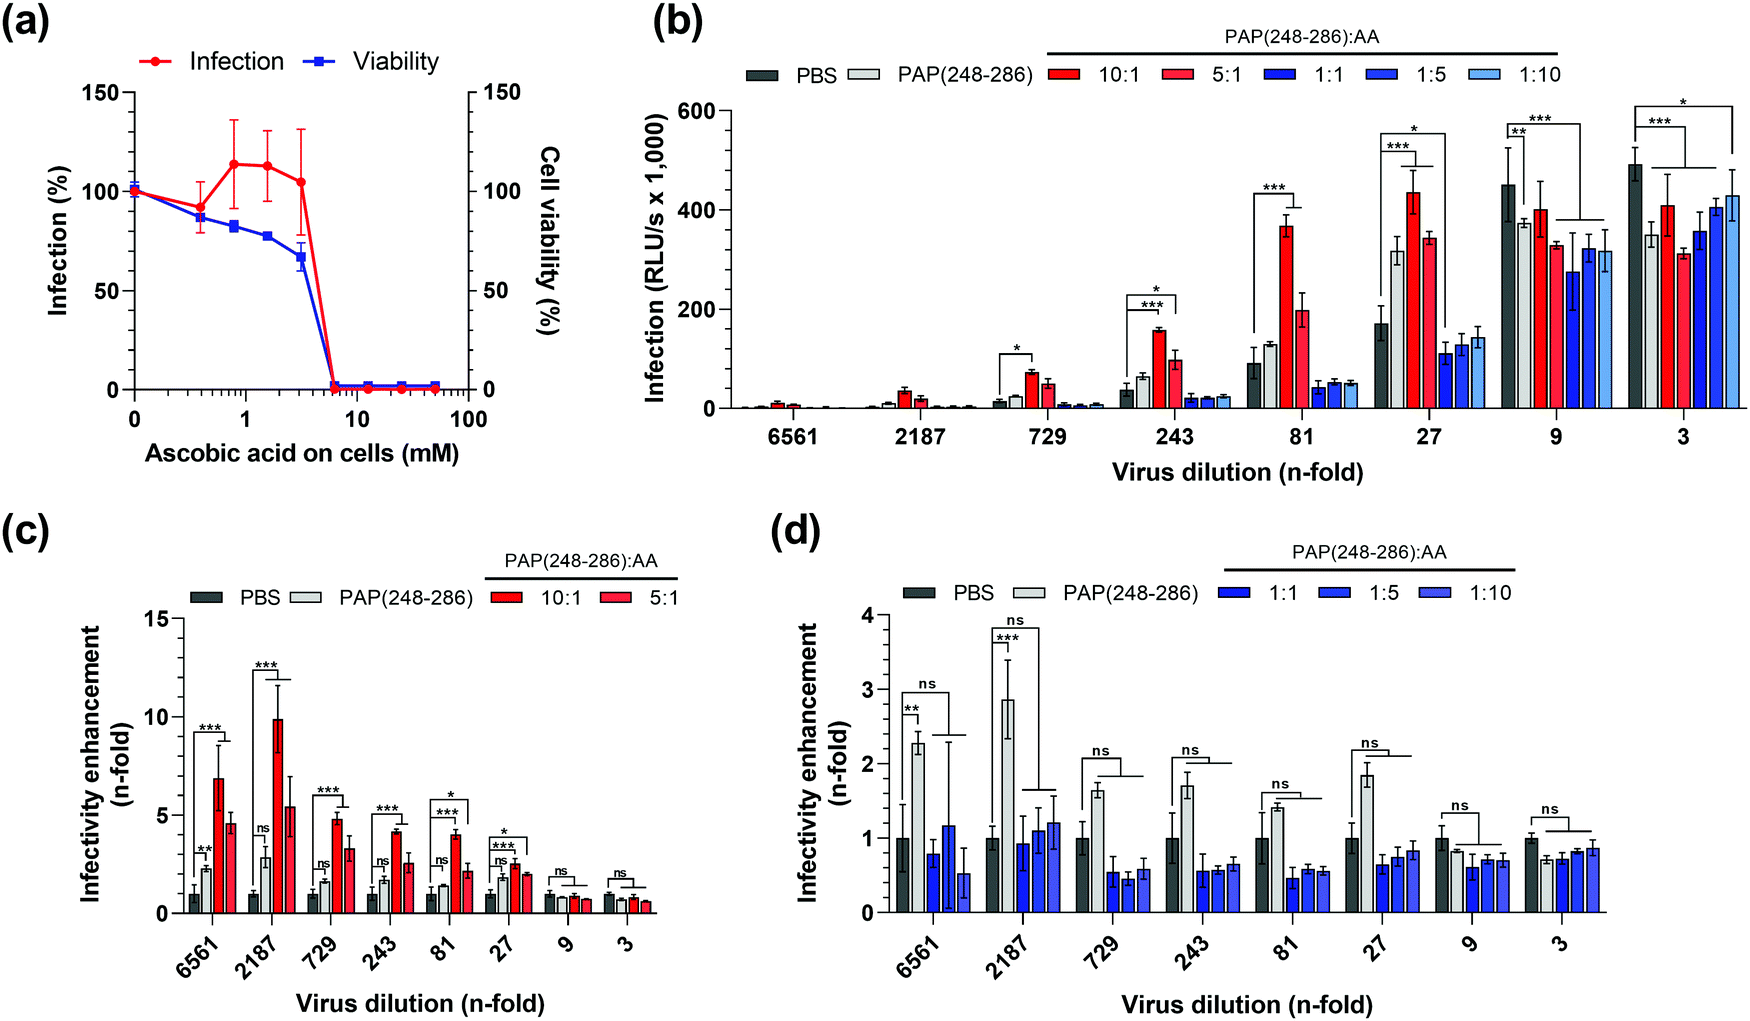 | ||
| Fig. 5 HIV-1 enhancing activity of SEVI fibrils formed in the presence of AA. (a) HIV-1 NL4-3 92TH014.12 was treated with serial dilutions of ascorbic acid (AA) and used to infect TZM-bl cells. Infectivity was assessed at 3 days post-infection by quantifying β-galactosidase signals in cell lysates, and viability of cells was determined by measuring ATP levels in lysates of uninfected TZM-bl cells 3 days post-treatment with AA. (b) PAP(248–286) monomers at 0.44 mM were incubated in the presence of 0; 0.044; 0.088; 0.44; 2.2 and 4.4 mM AA for 84 h, resulting in molar ratios of PAP(248–286):AA of 10:1; 5:1; 1:1; 1:5 and 1:10. Serial dilutions of HIV-1 NL4-3 92TH014.12 were treated with PAP(248–286):AA samples and used to infect TZM-bl cells. Infection rates were assessed by β-galactosidase assay at 3 days post-infection. (c) and (d) Fold change in HIV-1 NL4-3 92TH014.12 infectivity treated with PAP(248–286):AA samples relative to PBS control (calculated from b). Values shown are mean values derived from triplicate infections/measurements relative to the controls containing no AA (a) or raw data in relative light units per s (RLU per s) (b). Asterisks indicate the difference of values compared to PBS control, non-significant ns: P > 0.05, *P ≤ 0.05, **P ≤ 0.01, ***P ≤ 0.001 (2-way ANOVA with Dunett's multiple comparisons test), for clarity non-significant differences were omitted in (b). | ||
Next, we tested the possible pro- or anti-viral effect of AA on HIV-1 infection. For this, cells were exposed to AA and then infected with a CCR5 tropic HIV-1 strain as described.13,62 TZM-bl cells encode a viral promotor-lac Z gene cassette that is transactivated by the viral protein Tat upon successful infection. The β-galactosidase expression can then be quantified in a luminescence assay, which is routinely used as a measure for viral infectivity.65,66 We found that at concentrations up to 5 mM, AA did not affect the β-galactosidase activity and hence viral infection (Fig. 5a). However, at concentrations exceeding 5 mM, that were also highly cytotoxic, β-galactosidase activities decreased to background levels. Thus, concentrations of AA of up to 5 mM do not affect HIV-1 infection, and final concentrations of AA in cell culture of 5 mM or higher could not be analyzed because of confounding cytotoxic effects. To exclude that AA-mediated cytotoxic effects interfere with data interpretation, all subsequent experiments were designed in a way that ensured that the final cell culture concentration of AA never exceeded 100 μM.
Subsequently, we assessed whether the presence of AA during SEVI formation affects its HIV-1 enhancing activity. To test the possible enhancing or antagonizing effects of AA, we used a PAP(248–286) concentration of 0.44 mM. At this concentration, PAP(248–286) forms fibrils that have a modest 2- to 3-fold HIV-1 enhancing activity in the absence of AA (Fig. 5b). This allows to assess possible infection enhancing effects of AA on SEVI-mediated infection enhancement, and vice versa also allows to measure inhibitory effects. Next, PAP(248–286) at 0.44 mM was incubated for 84 h with an equimolar concentration of AA, a 10- and 5-fold molar excess of AA, or 5 and 10-fold lower molar concentrations of AA. The samples were mixed with serial dilutions of HIV-1 particles and used to infect TZMbl cells. Three days later infection rates were determined by the β-galoctosidase assay. At 3- and 9-fold dilution of HIV-1, virus infection resulted in a marked cytopathic effect in all samples as observed by light microscopy, indicating superinfection, and similar reporter gene activities of ∼400.000 RLU per s in most samples (Fig. 5b). Consequently, no HIV-1 enhancing effect of SEVI could be observed when using 3- and 9-fold dilutions (Fig. 5c and d) At higher viral dilutions, between 27-fold and 2187-fold, infection rates decreased (Fig. 5b) and SEVI enhanced infection by 2–3-fold (Fig. 5c and d). Interestingly, when incubating PAP(248–286) with AA molar ratios of 5:1 and 10:1, SEVI fibrils formed that increased HIV-1 infection by 3- to 10-fold (Fig. 5c). In contrast, a molar excess of 5 to 10-fold of AA over PAP(248–286) seemed to partially abrogate SEVI effects (Fig. 5d), while matching concentrations of AA alone (Fig. S4a–c, ESI†) did not affect infectivity of HIV-1. These data show that AA modulates SEVI fibril formation and consequently HIV-1 infection enhancement, which also largely recapitulates data shown in Fig. 1.
4 Discussion
Ascorbic acid (AA) has been shown to have potential therapeutic effects against several neurodegenerative diseases such as AD, PD, Huntington's disease (HD) and ischemic stroke.54,64,72,73 Furthermore, AA has been shown to interact with Aβ, stefin B, and insulin resulting in inhibition of their aggregation.30,60 Human semen, which naturally contains SEVI amyloid, also contains a number of vitamins amongst which AA is in the highest concentration (0.4 ± 0.1 mM).33 The anti-aggregation effect of AA along with its high physiological concentration in seminal plasma prompted us to examine its impact on the in vitro aggregation of PAP(248–286) into SEVI fibrils. To this end, we analyzed the effect of various concentrations of AA on PAP (248–286) fibril formation in vitro, i.e., 5- and 10-times higher and lower than the average physiological concentration of AA.We found a bi-directional effect of AA on PAP(248–286) fibril formation, which was dependent on the concentration of AA in the reaction mixture. When AA was incubated with monomeric PAP (248–286) peptide at lower than equimolar ratio, ThT fluorescence, and intrinsic Tyrosine fluorescence assays indicated higher fibril level than for PAP(248–286) in the absence of AA. In contrast, at higher than equimolar ratios, AA inhibited PAP(248–286) amyloid formation. This pattern of fibril modulation by different AA concentrations was also supported by the results of ANS fluorescence assay and TEM micrographs.
Based on the in vitro results, we hypothesize that the presence of PAP(248–286) amyloids in the seminal plasma can be attributed to the fibril-promoting effects of the physiological concentration of AA in seminal plasma. In vitro concentrations of AA higher than its physiological concentration resulted in PAP(248–286) species with lower hydrodynamic diameter than control fibrils (i.e., fibrils formed in the absence of AA), reflecting inhibition of its aggregation as measured by DLS. The inhibitory effect was evident by the preservation of the native conformation of monomeric PAP(248–286) as observed from CD spectroscopy, where random coil secondary structure was found upon incubation of PAP(248–286) with AA at concentrations higher than its physiological concentration. The observed bidirectional effect of AA cannot be ascribed to pH change since the AA stock solution was adjusted to pH 7.4 before adding it to the reaction mixture.
Other natural small molecules such as EGCG10,43 have also been shown to inhibit PAP(248–286) fibril formation at 5-fold molar excess like AA, whereas Brazilin was reported to have a notable inhibitory effect on PAP(248–286) fibrillation at equimolar concentration.11 However, to the best of our knowledge, dual effects have not been reported, neither for the ability of AA to modulate fibril formation of various amyloids nor for other small molecules studied against PAP(248–286) fibril formation.6
SEVI fibrils may play an important role in the sexual transmission of HIV-1 by enhancing viral infectivity. The highly cationic fibrils effectively capture viruses and promote their attachment to target cells by neutralizing the inherent electrostatic repulsion between the negative charges on the surfaces of HIV-1 virions and target cells.8 Thus, neutralizing the infection enhancing activity of SEVI has been an attractive strategy for developing drug candidates for reducing sexual transmission of HIV.6 The apparent dual modulatory effect of AA on the formation of SEVI fibrils in vitro, motivated us to examine the consequent effect on viral infection enhancement of the SEVI fibrils formed in the presence of AA. Interestingly, a 3- to 10-fold HIV infection enhancement was observed by SEVI fibrils formed in the presence of concentrations of AA lower than equimolar ratio (PAP(248–286):AA). In contrast, concentration higher than equimolar ratio appeared to partially abrogate infection enhancement as compared to untreated SEVI fibrils. This effect on HIV-1 infection is solely due to the SEVI fibrils themselves since AA exhibited no direct microbicidal effect on the HIV-1 viral strains at tested concentration range. Collectively, our results demonstrate a concentration-dependent dual modulatory effect of AA on SEVI fibrils which in turn affected the downstream effect of HIV-1 infection enhancement by these fibrils.
Several studies of AA supplementation by oral, intraperitoneal, and intravenous administration have found moderate benefits on cognition, oxidative stress markers, and amyloid-related pathology in mouse models of aging and neurodegenerative diseases.30,74,75 It has been reported that in different AD model mice, even a moderate intracellular AA deficiency had an appreciable effect of accelerating amyloid aggregation.74–76 This was particularly seen during the early stages of the disease development, whereas a lifelong deficiency in AA presented amyloid accumulation in the mice brains starting at a much earlier stage.76 Another study had documented a correlation between lower blood AA levels and cognitive impairment in older people.77 Being a natural antioxidant, deficiency of AA causes oxidative stress, which in turn can affect protein homeostasis and may be a contributing factor to amyloid fibril formation.64,78
The mode of action of AA on PAP(248–286) fibrillation remains to be elucidated. However, the present study provides some pertinent insights. Using isothermal titration calorimetry, we observed spontaneous interaction of AA with PAP(248–286) monomers which is preferentially due to hydrogen bonding and electrostatic interactions and by molecular docking, we elucidated the plausible binding residues of PAP(248–286) with AA. Our findings are in agreement with the inhibitory effect of AA towards other amyloids, including β-lactoglobulin, insulin, amylin, lysozyme, and stefin B, in which AA interacts with exposed hydrogen atoms of the N–H groups in the β-sheet backbone.60–64 In addition to interaction with the β-sheet backbone of amyloids, AA has been shown to exert inhibition of amyloid fibril formation through its degradation products, such as ascorbate anions and dehydroascorbic acid.72,73 The stability of AA varies with pH and incubation temperature, where self-degradation products are obtained within ∼6 hours under physiological pH at 37 °C.60,72 These degradation products were found to inhibit fibrillation and disrupt preformed mature amyloid fibrils of insulin, with an activity positively correlated with the degree of AA degradation.72,73 The metabolites of AA were shown to shield the electrostatic interactions between the β-sheet forming areas of protein monomers prone to form amyloid structures and to disrupt β-sheet stacking.60 Since in our in vitro assay, effects on fibril formation were seen after 24 hours, we speculate that such degradation products might contribute to the amyloid inhibitory effects observed at concentrations of AA higher than its physiological concentration.
Fresh liquified human ejaculates contain mature HIV-enhancing amyloid fibrils,66 which hinders the direct assessment of the effect of increasing concentration of AA on fibril formation and infection enhancement in the physiological environment. However, our study shows that AA affects SEVI fibril formation in a dual and concentration-dependent manner and suggests that the effect of AA and perhaps also other anti-amyloidogenic compounds should be evaluated over a broad concentration range to ensure that unwanted effects (e.g., accelerated fibril formation) can be excluded.
Author contributions
GKV and DS conceived the project and designed the experiments. SM performed all the in vitro assays. LW performed the viral assays. EA executed the ITC experiment. AP helped in performing CD and DLS studies. VK performed intrinsic fluorescence assay and CD de-convolution. SM, GKV, LW wrote the manuscript with RJ, JM and DS. All authors read and approved the manuscript.Conflicts of interest
Authors declare to have no conflict of interest.Acknowledgements
J. M. acknowledges funding by the German Research Foundation (DFG) through CRC1279, the Leibniz Foundation (Controlling and Switching of Function of Peptide and Protein based BioSurfaces: From Fundamentals to Applications) and the Volkswagen Stiftung.References
- R. H. Gray, M. J. Wawer, R. Brookmeyer, N. K. Sewankambo, D. Serwadda, F. Wabwire-Mangen, T. Lutalo, X. Li, T. VanCott and T. C. Quinn, Lancet, 2001, 357, 1149–1153 CrossRef CAS.
- C. D. Pilcher, H. C. Tien, J. J. Eron, P. L. Vernazza, S. Y. Leu, P. W. Stewart, L. E. Goh and M. S. Cohen, J. Infect. Dis., 2004, 189, 1785–1792 CrossRef PubMed.
- S. R. Galvin and M. S. Cohen, Nat. Rev. Microbiol., 2004, 2, 33–42 CrossRef CAS PubMed.
- N. R. Roan and W. C. Greene, Cell, 2007, 131, 1044–1046 CrossRef CAS PubMed.
- J. Münch, E. Rücker, L. Ständker, K. Adermann, C. Goffinet, M. Schindler, S. Wildum, R. Chinnadurai, D. Rajan, A. Specht, G. Giménez-Gallego, P. C. Sánchez, D. M. Fowler, A. Koulov, J. W. Kelly, W. Mothes, J. C. Grivel, L. Margolis, O. T. Keppler, W. G. Forssmann and F. Kirchhoff, Cell, 2007, 131, 1059–1071 CrossRef PubMed.
- A. Röcker, N. R. Roan, J. K. Yadav, M. Fändrich and J. Münch, Chem. Commun., 2018, 54, 7557–7569 RSC.
- K. A. Kim, M. Yolamanova, O. Zirafi, N. R. Roan, L. Staendker, W. G. Forssmann, A. Burgener, N. Dejucq-Rainsford, B. H. Hahn, G. M. Shaw, W. C. Greene, F. Kirchhoff and J. Münch, Retrovirology, 2010, 7, 55 CrossRef PubMed.
- L. M. Castellano and J. Shorter, Biology, 2012, 1, 58–80 CrossRef PubMed.
- J. S. Olsen, J. T. M. DiMaio, T. M. Doran, C. Brown, B. L. Nilsson and S. Dewhurst, J. Biol. Chem., 2012, 287, 11842–11849 CrossRef CAS PubMed.
- I. Hauber, H. Hohenberg, B. Holstermann, W. Hunstein and J. Hauber, Proc. Natl. Acad. Sci. U. S. A., 2009, 106, 9033–9038 CrossRef CAS PubMed.
- M. Li, X. Dong, Y. Liu and Y. Sun, Chem. – Asian J., 2017, 12, 1062–1068 CrossRef CAS PubMed.
- J. G. LoRicco, C. S. Xu, J. Neidleman, M. Bergkvist, W. C. Greene, N. R. Roan and G. I. Makhatadze, J. Biol. Chem., 2016, 291, 14045–14055 CrossRef CAS PubMed.
- N. R. Roan, S. Sowinski, J. Münch, F. Kirchhoff and W. C. Greene, J. Biol. Chem., 2010, 285, 1861–1869 CrossRef CAS PubMed.
- J. S. Olsen, C. Brown, C. C. Capule, M. Rubinshtein, T. M. Doran, R. K. Srivastava, C. Feng, B. L. Nilsson, J. Yang and S. Dewhurst, J. Biol. Chem., 2010, 285, 35488–35496 CrossRef CAS PubMed.
- T. Xun, W. Li, J. Chen, F. Yu, W. Xu, Q. Wang, R. Yu, X. Li, X. Zhou, L. Lu, S. Jiang, L. Li, S. Tan and S. Liua, Antimicrob. Agents Chemother., 2015, 59, 5123–5134 CrossRef CAS PubMed.
- E. Lump, L. M. Castellano, C. Meier, J. Seeliger, N. Erwin, B. Sperlich, C. M. Stürzel, S. Usmani, R. M. Hammond, J. Von Einem, G. Gerold, F. Kreppel, K. Bravo-Rodriguez, T. Pietschmann, V. M. Holmes, D. Palesch, O. Zirafi, D. Weissman, A. Sowislok, B. Wettig, C. Heid, F. Kirchhoff, T. Weil, F. G. Klärner, T. Schrader, G. Bitan, E. Sanchez-Garcia, R. Winter, J. Shorter and J. Munch, eLife, 2015, 4, e05397 CrossRef PubMed.
- D. A. Sheik, L. Brooks, K. Frantzen, S. Dewhurst and J. Yang, ACS Nano, 2015, 9, 1829–1836 CrossRef CAS PubMed.
- P. Velander, L. Wu, F. Henderson, S. Zhang, D. R. Bevan and B. Xu, Biochem. Pharmacol., 2017, 139, 40–55 CrossRef CAS PubMed.
- G. Aliev, M. Obrenovich, V. Reddy, J. Shenk, P. Moreira, A. Nunomura, X. Zhu, M. Smith and G. Perry, Mini-Rev. Med. Chem., 2008, 8, 1395–1406 CrossRef CAS PubMed.
- X. Zhao, M. Zhang, C. Li, X. Jiang, Y. Su and Y. Zhang, Oxid. Med. Cell. Longevity, 2019, 2019 Search PubMed.
- L. Jia, Y. Wang, W. Wei, W. Zhao, F. Lu and F. Liu, Food Funct., 2019, 10, 2861–2870 RSC.
- F. L. Da Silva, E. Coelho Cerqueira, M. S. De Freitas, D. L. Gonçalves, L. T. Costa and C. Follmer, Neurochem. Int., 2013, 62, 103–112 CrossRef CAS PubMed.
- P. Alam, S. K. Chaturvedi, M. K. Siddiqi, R. K. Rajpoot, M. R. Ajmal, M. Zaman and R. H. Khan, Sci. Rep., 2016, 6, 26759 CrossRef CAS PubMed.
- R. Checker, D. Sharma, S. K. Sandur, N. M. Khan, R. S. Patwardhan, V. Kohli and K. B. Sainis, Free Radical Research, Informa Healthcare, 2011, vol. 45, pp. 975–985 Search PubMed.
- C. Annweiler, B. Brugg, J. M. Peyrin, R. Bartha and O. Beauchet, Neurobiol. Aging, 2014, 35, 331–335 CrossRef CAS PubMed.
- V. Lee, E. Rekhi, J. Hoh Kam and G. Jeffery, Neurobiol. Aging, 2012, 33, 2382–2389 CrossRef CAS PubMed.
- P. D. Q. Huy, Y. C. Yu, S. T. Ngo, T. Van Thao, C. P. Chen, M. S. Li and Y. C. Chen, Biochim. Biophys. Acta, Gen. Subj., 2013, 1830, 2960–2969 CrossRef CAS PubMed.
- S. Ghasemzadeh and G. H. Riazi, Int. J. Biol. Macromol., 2020, 154, 1505–1516 CrossRef CAS PubMed.
- K. Ono, Y. Yoshiike, A. Takashima, K. Hasegawa, H. Naiki and M. Yamada, Exp. Neurol., 2004, 189, 380–392 CrossRef CAS PubMed.
- S. Y. Kook, K. M. Lee, Y. Kim, M. Y. Cha, S. Kang, S. H. Baik, H. Lee, R. Park and I. Mook-Jung, Cell Death Dis., 2014, 5(2), e1083 CrossRef CAS PubMed.
- A. Kontush and S. Schekatolina, Annals of the New York Academy of Sciences, New York Academy of Sciences, 2004, vol. 1031, pp. 249–262 Search PubMed.
- D. H. Owen and D. F. Katz, J. Androl., 2005, 26, 459–469 CrossRef CAS PubMed.
- M. Nouri, A. Ghasemzadeh, L. Farzadi, V. Shahnazi and M. G. Novin, Iran. J. Reprod. Med., 2008, 6, 1–5 CAS.
- P. Zareba, D. S. Colaci, M. Afeiche, A. J. Gaskins, N. Jørgensen, J. Mendiola, S. H. Swan and J. E. Chavarro, Fertil. Steril., 2013, 100, 1572–1579 CrossRef CAS PubMed.
- V. Guru KrishnaKumar, S. Mohapatra, A. Paul, E. Arad, R. Jelinek, E. Gazit and D. Segal, Molecules, 2018, 23(12), 3279 CrossRef PubMed.
- G. K. Viswanathan, D. Shwartz, Y. Losev, E. Arad, C. Shemesh, E. Pichinuk, H. Engel, A. Raveh, R. Jelinek, I. Cooper, F. Gosselet, E. Gazit and D. Segal, Cell. Mol. Life Sci., 2020, 77, 2795–2813 CrossRef CAS PubMed.
- R. P. R. Nanga, J. R. Brender, S. Vivekanandan, N. Popovych and A. Ramamoorthy, J. Am. Chem. Soc., 2009, 131, 17972–17979 CrossRef CAS PubMed.
- G. M. Morris, H. Ruth, W. Lindstrom, M. F. Sanner, R. K. Belew, D. S. Goodsell and A. J. Olson, J. Comput. Chem., 2009, 30, 2785–2791 CrossRef CAS PubMed.
- R. A. Laskowski and M. B. Swindells, J. Chem. Inf. Model., 2011, 51, 2778–2786 CrossRef CAS PubMed.
- N. R. Roan, N. Sandi-Monroy, N. Kohgadai, S. M. Usmani, K. G. Hamil, J. Neidleman, M. Montano, L. Ständker, A. Röcker, M. Cavrois, J. Rosen, K. Marson, J. F. Smith, C. D. Pilcher, F. Gagsteiger, O. Sakk, M. O’Rand, P. V. Lishko, F. Kirchhoff, J. Münch and W. C. Greene, eLife, 2017, 6, e24888 CrossRef PubMed.
- D. Easterhoff, F. Ontiveros, L. R. Brooks, Y. Kim, B. Ross, J. N. Silva, J. S. Olsen, C. Feng, D. J. Hardy, P. M. Dunman and S. Dewhurst, Antimicrob. Agents Chemother., 2013, 57, 2443–2450 CrossRef CAS PubMed.
- C. Xue, T. Y. Lin, D. Chang and Z. Guo, R. Soc. Open Sci., 2017, 4(1), 160696 CrossRef PubMed.
- N. Popovych, J. R. Brender, R. Soong, S. Vivekanandan, K. Hartman, V. Basrur, P. M. MacDonald and A. Ramamoorthy, J. Phys. Chem. B, 2012, 116, 3650–3658 CrossRef CAS PubMed.
- A. Paul, K. C. Nadimpally, T. Mondal, K. Thalluri and B. Mandal, Chem. Commun., 2015, 51, 2245–2248 RSC.
- M. Kumar, Y. Hong, D. C. Thorn, H. Ecroyd and J. A. Carver, Anal. Chem., 2017, 89, 9322–9329 CrossRef CAS PubMed.
- V. Foderà, M. Groenning, V. Vetri, F. Librizzi, S. Spagnolo, C. Cornett, L. Olsen, M. van de Weert and M. Leone, J. Phys. Chem. B, 2008, 112, 15174–15181 CrossRef PubMed.
- G. M. Kirsten, B.-M. Luis M, W. Benedikt, B. Johannes, R.-A. Marina, N. Hironobu and O. Daniel, Amyloid, 2017, 24, 1–16 Search PubMed.
- M. Amaro, D. J. S. Birch and O. J. Rolinski, Phys. Chem. Chem. Phys., 2011, 13, 6434–6441 RSC.
- O. J. Rolinski, M. Amaro and D. J. S. Birch, Biosens. Bioelectron., 2010, 25, 2249–2252 CrossRef CAS PubMed.
- T. Šmidlehner, H. Bonnet, S. Chierici and I. Piantanida, Bioorg. Chem., 2020, 104, 104196 CrossRef PubMed.
- I. B. Bekard and D. E. Dunstan, Biophys. J., 2009, 97, 2521–2531 CrossRef CAS PubMed.
- G. Weber and D. J. Laurence, Biochem. J., 1954, 56, xxxi CAS.
- A. Hawe, M. Sutter and W. Jiskoot, Pharm. Res., 2008, 25, 1487–1499 CrossRef CAS PubMed.
- A. Paul, B. D. Zhang, S. Mohapatra, G. Li, Y. M. Li, E. Gazit and D. Segal, Front. Mol. Biosci., 2019, 6, 16 CrossRef CAS PubMed.
- Z. Ye, K. C. French, L. A. Popova, I. K. Lednev, M. M. Lopez and G. I. Makhatadze, Biochemistry, 2009, 48, 11582–11591 CrossRef CAS PubMed.
- D. S. Blokhin, A. V. Filippov, O. N. Antzutkin, F. K. Karataeva and V. V. Klochkov, J. Mol. Struct., 2014, 1070, 38–42 CrossRef CAS.
- A. M. Streets, Y. Sourigues, R. R. Kopito, R. Melki and S. R. Quake, PLoS One, 2013, 8(1), e54541 CrossRef CAS PubMed.
- P. D. Ross and S. Subramanian, Biochemistry, 1981, 20, 3096–3102 CrossRef CAS PubMed.
- S. H. Wang, F. F. Liu, X. Y. Dong and Y. Sun, J. Phys. Chem. B, 2010, 114, 11576–11583 CrossRef CAS PubMed.
- W. Lee, I. Kim, S. W. W. Lee, H. Lee, G. Lee, S. Kim, S. W. W. Lee and D. S. Yoon, Macromol. Res., 2016, 24, 868–873 CrossRef CAS.
- P. Alam, A. Z. Beg, M. K. Siddiqi, S. K. Chaturvedi, R. K. Rajpoot, M. R. Ajmal, M. Zaman, A. S. Abdelhameed and R. H. Khan, Arch. Biochem. Biophys., 2017, 621, 54–62 CrossRef CAS PubMed.
- S. K. Azzam, H. Jang, M. C. Choi, H. Alsafar, S. Lukman and S. Lee, Mol. Pharmaceutics, 2018, 15, 2098–2106 CrossRef CAS PubMed.
- P. Patel, K. Parmar, D. Patel, S. Kumar, M. Trivedi and M. Das, Int. J. Biol. Macromol., 2018, 114, 666–678 CrossRef CAS PubMed.
- S. Hasanbašić, A. Jahić, S. Berbić, M. T. Znidarič and E. Zerovnik, Oxid. Med. Cell. Longevity, 2018, 8613209 Search PubMed.
- N. R. Roan, J. A. Müller, H. Liu, S. Chu, F. Arnold, C. M. Stürzel, P. Walther, M. Dong, H. E. Witkowska, F. Kirchhoff, J. Münch and W. C. Greene, Cell Host Microbe, 2011, 10, 541–550 CrossRef CAS PubMed.
- O. Zirafi, K. A. Kim, N. R. Roan, S. F. Kluge, J. A. Müller, S. Jiang, B. Mayer, W. C. Greene, F. Kirchhoff and J. Münch, Sci. Transl. Med., 2014, 6(262), 262ra157 CrossRef PubMed.
- E. J. Platt, M. Bilska, S. L. Kozak, D. Kabat and D. C. Montefiori, J. Virol., 2009, 83, 8289–8292 CrossRef CAS PubMed.
- Y. Takeuchi, M. O. McClure and M. Pizzato, J. Virol., 2008, 82, 12585–12588 CrossRef CAS PubMed.
- X. Wei, J. M. Decker, H. Liu, Z. Zhang, R. B. Arani, J. M. Kilby, M. S. Saag, X. Wu, G. M. Shaw and J. C. Kappes, Antimicrob. Agents Chemother., 2002, 46, 1896–1905 CrossRef CAS PubMed.
- C. A. Derdeyn, J. M. Decker, J. N. Sfakianos, X. Wu, W. A. O’Brien, L. Ratner, J. C. Kappes, G. M. Shaw and E. Hunter, J. Virol., 2000, 74, 8358–8367 CrossRef CAS PubMed.
- E. J. Platt, K. Wehrly, S. E. Kuhmann, B. Chesebro and D. Kabat, J. Virol., 1998, 72, 2855–2864 CrossRef CAS PubMed.
- L. F. Yang and C. M. Zeng, Molecules, 2018, 23(12), 3121 CrossRef PubMed.
- E. S. Lobbens, V. Foderà, N. T. Nyberg, K. Andersen, A. K. Jäger, L. Jorgensen and M. van de Weert, PLoS One, 2016, 11, e0149148 CrossRef PubMed.
- K. Murakami, N. Murata, Y. Ozawa, N. Kinoshita, K. Irie, T. Shirasawa and T. Shimizu, J. Alzheimer's Dis., 2011, 26, 7–18 CAS.
- F. E. Harrison, A. H. Hosseini, M. P. McDonald and J. M. May, Pharmacol., Biochem. Behav., 2009, 93, 443–450 CrossRef CAS PubMed.
- S. Dixit, A. Bernardo, J. M. Walker, J. A. Kennard, G. Y. Kim, E. S. Kessler and F. E. Harrison, ACS Chem. Neurosci., 2015, 6, 570–581 CrossRef CAS PubMed.
- S. Rivière, I. Birlouez-Aragon, F. Nourhashèmi and B. Vellas, Int. J. Geriatr. Psychiatry, 1998, 13, 749–754 CrossRef.
- K. Ono, T. Hamaguchi, H. Naiki and M. Yamada, Biochim. Biophys. Acta, Mol. Basis Dis., 2006, 1762, 575–586 CrossRef CAS PubMed.
Footnotes |
| † Electronic supplementary information (ESI) available. See DOI: 10.1039/d1cb00084e |
| ‡ Equal contribution. |
| This journal is © The Royal Society of Chemistry 2021 |