
 Open Access Article
 This Open Access Article is licensed under a Creative Commons Attribution-Non Commercial 3.0 Unported Licence
Glycan–protein interactions determine kinetics of N-glycan remodeling†
Corina
Mathew‡
 a,
R. Gregor
Wei߇
b,
Christoph
Giese
c,
Chia-wei
Lin
ad,
Marie-Estelle
Losfeld
a,
Rudi
Glockshuber
c,
Sereina
Riniker
b and
Markus
Aebi
*a
a,
R. Gregor
Wei߇
b,
Christoph
Giese
c,
Chia-wei
Lin
ad,
Marie-Estelle
Losfeld
a,
Rudi
Glockshuber
c,
Sereina
Riniker
b and
Markus
Aebi
*a
aInstitute of Microbiology, Department of Biology, Swiss Federal Institute of Technology, ETH Zürich, 8093 Zürich, Switzerland. E-mail: aebi@micro.biol.ethz.ch
bLaboratory of Physical Chemistry, Department of Chemistry and Applied Biosciences, Swiss Federal Institute of Technology, ETH Zürich, 8093 Zürich, Switzerland
cInstitute of Molecular Biology & Biophysics, Department of Biology, Swiss Federal Institute of Technology, ETH Zürich, 8093 Zürich, Switzerland
dFunctional Genomics Center Zürich, 8057 Zürich, Switzerland
First published on 16th April 2021
Abstract
A hallmark of N-linked glycosylation in the secretory compartments of eukaryotic cells is the sequential remodeling of an initially uniform oligosaccharide to a site-specific, heterogeneous ensemble of glycostructures on mature proteins. To understand site-specific processing, we used protein disulfide isomerase (PDI), a model protein with five glycosylation sites, for molecular dynamics (MD) simulations and compared the result to a biochemical in vitro analysis with four different glycan processing enzymes. As predicted by an analysis of the accessibility of the N-glycans for their processing enzymes derived from the MD simulations, N-glycans at different glycosylation sites showed different kinetic properties for the processing enzymes. In addition, altering the tertiary structure of the glycoprotein PDI affected its N-glycan remodeling in a site-specific way. We propose that the observed differential N-glycan reactivities depend on the surrounding protein tertiary structure and lead to different glycan structures in the same protein through kinetically controlled processing pathways.
Introduction
N-Glycoprotein biogenesis in eukaryotes is initiated in the Endoplasmic Reticulum (ER) by the oligosaccharyltransferase, an enzyme complex which covalently links a uniquely defined oligosaccharide, Glc3Man9GlcNAc2, to the side-chain amide nitrogen atom of asparagines within –N–X–S/T-sequons. It thereby modifies a large number of proteins, many of them at multiple sites.1–4 After the transfer to the protein, processing of the N-linked glycans is initiated by ER-localized hydrolases. The removal of the three glucoses is hereby coupled to the folding of the glycoproteins by providing ligands for lectin chaperones such as calnexin or calreticulin.5,6 The quality control of protein folding relies on glycans and the information they provide about the conformational state of the covalently bound protein.7After the exit from the ER, N-glycoproteins are further processed by Golgi specific hydrolases and transferases that generate the final structures of N-glycans.8 This remodeling pathway is characterized by individual reactions that rarely go to completion and the processing of a glycan being different for each site of the glycoproteome. Consequently, a site-specific heterogeneity of N-glycan structures is observed. Early on, it was suggested that this differential processing might be due to the tertiary structure of the glycoprotein. In 1984, Savvidou et al. hypothesized that the decreased amount of bisecting N-glycans on one specific glycosylation site of human IgG was due to specific interactions between this glycan and the protein.9 In the following, several NMR studies demonstrated interactions between N-glycans and the protein surface. They are primarily facilitated by the reducing-end GlcNAc of an N-glycan.10,11 A most recent example of tertiary structure context dependent glycan processing is the discovery that only a single of the eight N-glycans in the filamentous urinary glycoprotein uromodulin (UMOD) remains a high-mannose type glycan, while all other N-glycans are further processed to complex-type N-glycans. It is however the single high-mannose type UMOD glycan that mediates encapsulation and aggregation of uropathogens by UMOD filaments via interactions with mannoside-specific pilus lectins from the pathogens.12 In addition, the rise of computational glycobiology allowed the simulation of glycan–protein interactions13,14 and indicated that these interactions could reduce the accessibility of the glycan to glycan-processing enzymes.15 Consequently, glycan–protein interactions are considered a major determinant of N-glycan microheterogeneity.15,16 Several studies have used this knowledge to engineer glycoproteins by site-directed mutagenesis. Chen et al. introduced new glycan–protein interactions into IgG and could thereby significantly improve the stability of IgG against thermal and low pH induced aggregation.17 In contrast, site-directed amino acid replacements disrupting interactions between the glycan and the protein lead to improved processing of the “freed” N-glycans.18,19
Understanding site-specific N-glycan processing as it occurs in vivo requires a detailed knowledge of the specificity and localization of the individual hydrolases and glycosyltransferases.20 While being transported from the ER through the cis-, medial, and trans-Golgi, a glycoprotein encounters a different set of glycan processing enzymes in each compartment for a limited amount of time. Hereby, the product of an enzyme acting earlier in the pathway serves as a substrate for the enzyme acting afterwards.21 After the removal of the three terminal glucoses in the ER, the α-1,2-mannosidase ER mannosidase I (ER Man I) removes the terminal mannose from the B-branch of the N-glycan resulting in a Man8GlcNAc2 glycan. Even though ER Man I has a high specificity towards this terminal mannose, it is capable of trimming all α-1, 2-linked mannoses from an N-glycan.22,23 In the Golgi, the glycan is further processed by Golgi Mannosidase I (GM I). This enzyme belongs to the same glycoside hydrolase family as ER Man I (GH 47), and is therefore also able to remove all α-1,2-linked mannoses from the N-glycan. However, in contrast to ER Man I, which in vivo performs only one mannose trimming step, GM I completes several trimming steps and removes up to three mannoses from a Man8GlcNAc2 glycan generating a Man5GlcNAc2 glycan.24 When confronted with a Man9GlcNAc2 glycan, GM I works least efficiently on the terminal B-branch mannose, the preferred mannose of ER Man I.25
The product of GM I, a Man5GlcNAc2 glycan, is further processed by N-acetylglucosaminyltransferase I (GnT I), which transfers one GlcNAc to the A-branch of the glycan and uses UDP-GlcNAc as a donor substrate.26 Its action is essential, as the transfer of a GlcNAc initiates the formation of hybrid N-glycans (glycans which contain unsubstituted terminal mannose residues as well as mannose residues with a GlcNAc linkage).27 The generated GlcNAcMan5GlcNAc2 serves as a substrate for Golgi mannosidase II (GM II) which can cleave two mannoses with different glycosidic linkages (α-1,3 and α-1,6 linked), of the B- and the C-branch, with a single catalytic site. First, the α-1,6-linked, terminal mannose is removed, followed by the α-1,3 linked mannose.28,29 By the removal of these two mannoses GM II initiates the synthesis of complex glycan structures (glycans which have added GlcNAc residues at both the α-3 and α-6 mannose sites and no more free, terminal mannose residues).30
As these above mentioned enzymes, ER Man I, GM I, GnT I and GM II act early in the N-glycan processing pathway of the ER and Golgi they generate the glycosubstrates of all following glycan modifying enzymes and are therefore essential for generating the final N-glycan structures presented on a protein.
Even though there are multiple publications describing the in vitro activity of these enzymes, the majority of these studies was done on free glycans or glycopeptides.25,26,29 Therefore, little is known about their activity on a glycoprotein and how the interaction of glycans with the surface of the protein they are attached to influences glycan processing. To answer these open questions, we used yeast protein disulfide isomerase (PDI) as a model protein with five N-glycosylation sites to investigate site-specific N-glycan processing in the context of an intact glycoprotein.15 We performed in-depth molecular dynamics (MD) simulations to analyze the dynamics and the interactions of the N-linked glycans and experimentally addressed site-specific processing by ER Man I, GM I, GnT I and GM II in vitro. Initial velocities and KM values demonstrated that the glycan of each glycosylation site represents a unique substrate to glycan-processing enzymes. MD simulations explained the site-specific properties that were primarily determined by protein–glycan and glycan–glycan interactions. Altering the protein structure changed site-specific glycan processing, validating the conclusion that intramolecular protein/glycan interactions slow or even prevent individual steps of glycan processing.
Results
Molecular dynamics simulations of PDI
Fig. 1A schematically illustrates the chemical composition of a Man9GlcNAc2 glycan, the most abundant structure bound to the glycosylation sites of PDI in the ER. The U-shaped PDI structure shown in Fig. 1B consists of four thioredoxin-like domains termed a, b, b′, and a′, of which the domains a and a′ possess a catalytic cysteine pair (CGHC in Fig. 1B).31 Additionally, the a-domain contains a structural disulfide bond (C–C in Fig. 1B). The glycosylation sites 1 and 2 are located on the a-domain, while the b-domain contains sites 3 and 4. Site 5 is distantly located from the other glycosylation sites on the a′-domain. | ||
| Fig. 1 Structural assessment of the site-specific glycan accessibility. (A) Simplified representation of a branched Man9GlcNAc2 oligosaccharide. The schematic also exemplifies on the A-branch the considered branch lengths for the accessibility assessment when accounting for one (dotted line), two (dashed line), or three monomers (dotted-dashed line). (B) Structure of a Man9GlcNAc2 glycoform of PDI. The secondary structure of the protein is shown as ribbon representation, the glycans are in a licorice representation with mannose residues in green and N-acetylglucosamine residues in blue. The four thioredoxin domains are labeled in different colors (a, orange; b, yellow; b′, green; a′, blue). The sequence of PDI indicates the three disulfide bonds. The first disulfide bond on the a domain and the one on the a′ domain are the active sites of PDI (CGHC). The second disulfide bond on the a domain (C–C) is structural. The glycosite positions are also indicated. (C) Accessibility analysis of the Man9GlcNAc2 glycans of PDI. The bar plots show the sum of probabilities from the stationary distribution of microstates that are classified as ‘free’ (blue) and in ‘contact’ (brown). The striped color refers to ‘free’ and ‘contact’ states that have either the A, B, C, or any branch exposed. The abscissa labels the classifications based on one, two, or three branch monomers. | ||
We conducted explicit-water MD simulations to produce an aggregate sampling of 75 μs for the full-length glycoprotein with glycosylated sites 1–4 and 110 μs for the a′-domain with glycosylated site 5. In both cases, the aggregate sampling comprises hundreds of individual simulations ranging from 100 ns to 400 ns that were carried out in parallel from different starting configurations. The MD trajectories were partitioned into structural microstates and analyzed using Markov state modeling (MSM),32,33 typically used to reconstruct thermodynamic and kinetic properties of a simulated ensemble. From the MSM, we retrieved the stationary probability distribution of the structural glycan microstates to quantify the amount of accessible glycan conformations. Further details on the MD simulations, microstate definition, MSM construction, and accessibility assessment are given in the Methods section.
Conformations of PDI glycans
We distinguished four categories in total for the branch accessibility. The two categories with ‘free’ glycan classification with or without exposed branch(es) were labeled as ‘free & exposed branch’ and ‘free & collapsed branch’, respectively. Exemplifying illustrations are shown in Fig. S1 (ESI†). The other two categories differentiate glycan conformations in ‘contact’ with the protein environment but with or without branch exposure, respectively labeled as ‘contact & exposed branch’ and ‘full contact’. The quantitative classification is described in the Method section. Thus, the classification ‘exposed’ indicated glycan structures, for which a branch was stretching into the water while the others could still be interacting with the protein, neighboring glycans, or other branches within the same glycan. From the enzymatic point of view, extended glycan conformations are preferred because the catalytic sites in GH47 α-mannosidases, such as ER Man I, are known to be deep funnels binding only one extended branch at a time.34 Hence, the ‘contact & exposed branch’ conformations could be more beneficial for the deep binding funnels than the ‘free & collapsed branch’ conformations.The accessibility assessment of sites 1–5 is shown in Fig. 1C. Each histogram refers to a given site as labeled above each plot. The histograms are split into the classification of individual A, B, and C branches as well as a separate bar that shows if ‘any’ branch is accessible. The latter category renders the crudest approach that neglects possible branch selectivity of the maturation. Also, this category clarifies that conformations of individual branches are not exclusive nor additive and at most correlated. Further, the abscissa coordinate labels the number of considered monomers in the accessibility classification. The ordinate gives the occurrence of a given category. Sites 1 and 3 exhibited the largest populations of ‘free’ conformations (solid + striped blue bars) in which the glycan was barely interacting with its surrounding protein environment or neighboring glycans. Site 2 also showed a clear but reduced fraction of ‘free’ conformations (solid + striped blue bars) but had a considerable amount of ‘exposed’ microstates (striped blue + brown bars). Interestingly, a common pattern of ‘exposed’ branches was shared among sites 1–3 and 5. The ‘exposed’ microstates were dominated by ‘exposed’ A-branch conformations, the most flexible branch. A generally minimal exposure of the B branch may be related to its central location within the glycan. Naturally, the percentages of exposed conformations declined when considering an increasing number of monosaccharides per branch (see the abscissa coordinate of each histogram). This gradient was site-specific. In contrast, the same assessment of the glycan on site 4 showed a significantly different pattern. The percentage of ‘full contact’ conformations (solid brown bar) on site 4 was most dominant across all levels of branch lengths, while the fraction of ‘free’ conformations (blue bars) was the lowest compared to all other sites. Furthermore, the amount of conformations in which a single branch is completely solvent exposed (i.e. ‘free & exposed’ conformations) was reduced at site 4. Also, the preference of A and C branch exposure over the B branch was lost at site 4, and all three branches had similar fractions of ‘exposed’ conformations (striped bars). In summary, our glycan-centric, quantitative analysis of the microstates of the MSMs suggested that the Man9GlcNAc2 was least accessible on site 4. Sites 2 and 5 tended to expose individual branches while they were still in contact with their environment. Sites 1 and 3 exhibited patterns with the comparatively largest solvent exposure. These observations indicated site-specific differences between the five (Man9GlcNAc2) sites in their reactivity with ER Man I despite their identical chemical structures.
The above analysis of individual glycan conformations was not accounting for the particular contacts and interactions with the glycans’ environments that would lead to the ‘free’, ‘contact’, and ‘exposed’ classifications. For instance, as illustrated in Fig. 1B, sites 1 and 3 are in close proximity to each other such that glycan–glycan interactions contributed dominantly to the fraction of ‘contact’ conformations. Hence, a competition of site 1 and 3 during glycan–enzyme interaction could reduce the trimming of the branches on either site. Fig. 1B shows further that the glycan on site 5 can easily extend to free conformations but potentially forms frequent interactions with the acidic, C-terminal α-helical PDI segment. Thus, while the amount of free conformations was clearly affected by the glycan–protein interactions at site 5, the individual branches are still exposed during the contact with the neighboring α-helix. In addition, the protein surface shape is convex at site 2, which is in contrast to a rather concave topology at site 4. These topological differences of the surrounding protein surface pose different glycan–protein contact possibilities (Fig. 1B and Fig. S1, ESI†). At site 2, the surrounding protein surface has a positive curvature such that the branches are easily extended when the glycan is ‘free’ or in ‘contact’ (Fig. S1, ESI†). In contrast, the concave protein surface around site 4 hinders ‘exposed’ branches in the ‘contact’ and ‘free’ conformations.
In vitro processing of PDI N-glycans
After incubation of glycosylated PDI with the respective remodeling enzyme, the site-specific glycoform distributions were obtained by mass spectrometry (MS) of tryptic glycopeptides (Fig. S4B, S6 and S7, ESI†).
Site-specific processing of N-glycans by different enzymes
For an initial assessment of site-specific glycan processing enzyme activity, we chose an end-point analysis to determine the optimal time frame the individual enzymes require.For processing of Man9GlcNAc2-PDI (60 μM) by ER Man I (0.3 μM), we observed efficient conversion (90%) from Man9GlcNAc2 to Man8GlcNAc2 for sites 1–3 and 5 within approximately three minutes. In contrast, the glycan from glycosite 4 was processed significantly slower. After 60 minutes only 85% conversion was obtained. On site 2, we additionally observed a decrease of the Man8GlcNAc2 product after 10 minutes, corresponding to additional mannose trimming by ER Man I (Fig. 2A).
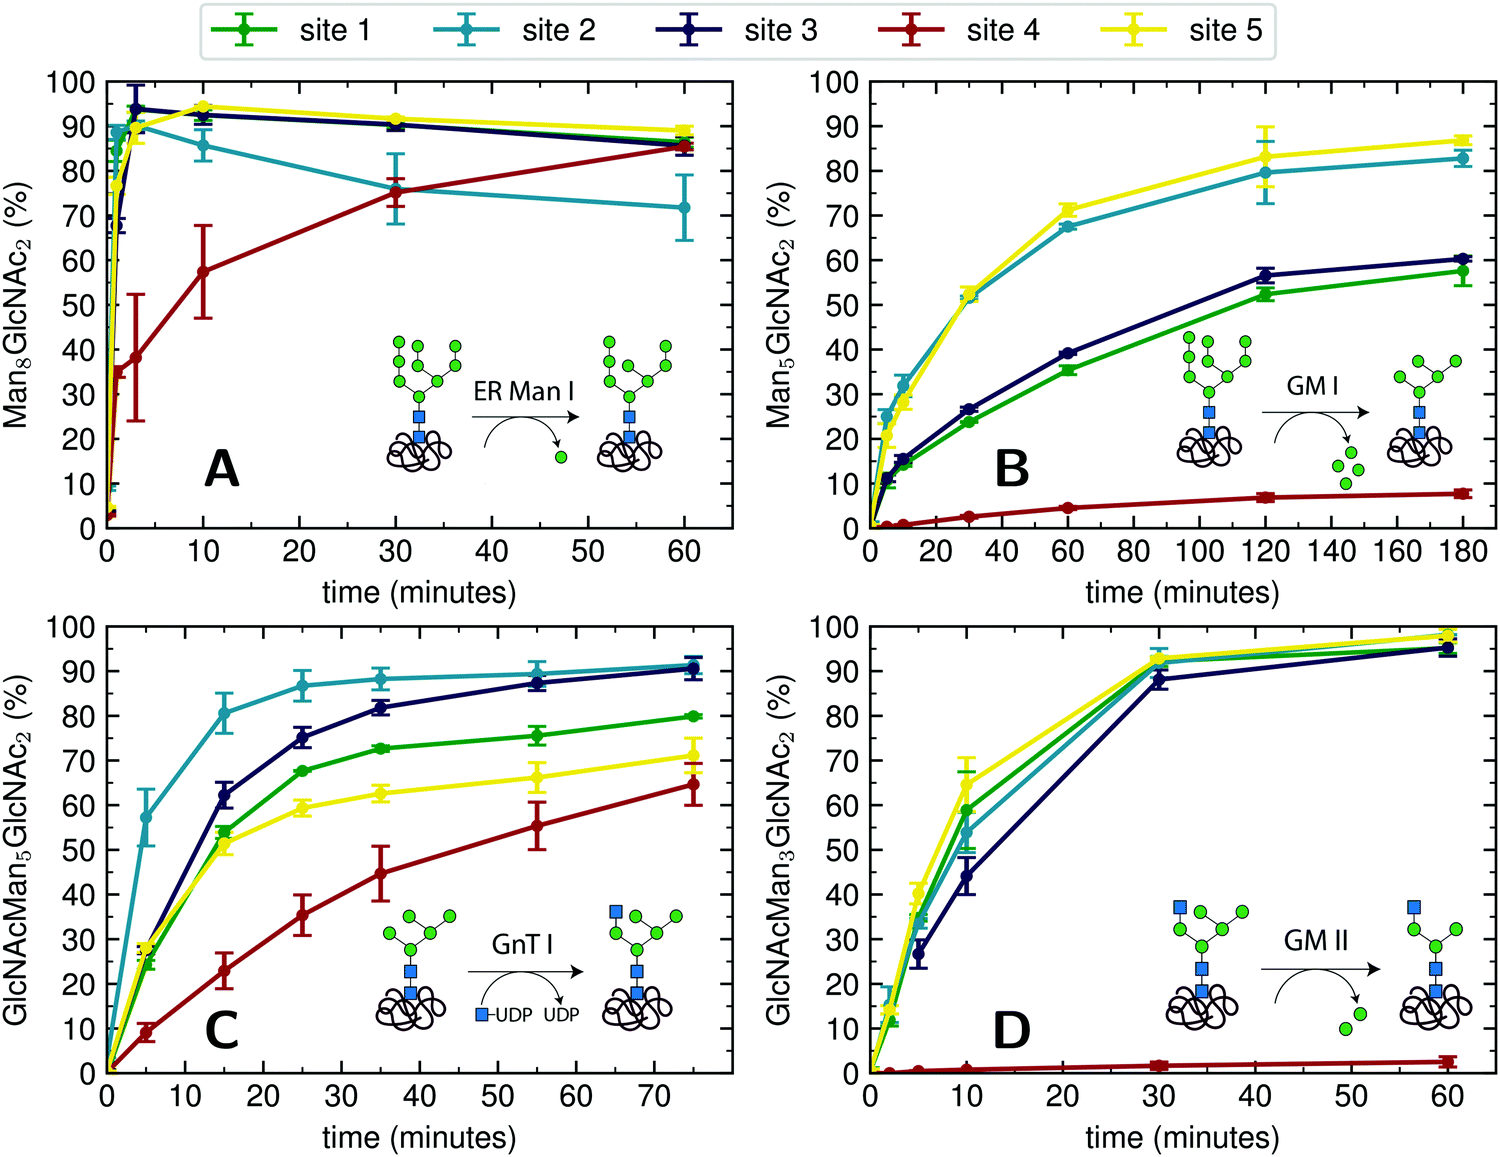 | ||
| Fig. 2 Site-specific processing of PDI N-glycans by four different enzymes. (A) Reaction catalyzed by ER Man I: removal of one α-1,2-linked mannose from the B-branch of Man9GlcNAc2, resulting in Man8GlcNAc2. Man9GlcNAc2-PDI was incubated with purified ER Man I, shown is the conversion of Man9GlcNAc2 to Man8GlcNAc2 on each site over 60 minutes. Error bars represent the standard deviation of three independent experiments (n = 3). (B) reaction catalyzed by GM I: Removal of four α-1,2-linked mannoses from Man9GlcNAc2, resulting in Man5GlcNAc2. Man9GlcNAc2-PDI was incubated with GM I, shown is the conversion of Man9GlcNAc2 to Man5GlcNAc2 on each site over 180 minutes (n = 3). Shown in this graph is only the generation of the final product Man5GlcNAc2, a more thorough study of the produced intermediates is shown in Fig. 4A. (C) Reaction catalyzed by GnT I: transfer of a GlcNAc from UDP-GlcNAc to the A-branch of a Man5GlcNAc2 glycan, resulting in GlcNAcMan5GlcNAc2. Man5GlcNAc2-PDI was incubated with purified GnT I and UDP-GlcNAc. Shown is the conversion of Man5GlcNAc2 to GlcNAcMan5GlcNAc2 over 80 minutes (n = 3). (D) Reaction catalyzed by GM II: removal of a α-1,3-linked mannose from the B-branch and a α-1,6-linked mannose from the C-branch of a GlcNAcMan5GlcNAc2 glycan, resulting in GlcNAcMan3GlcNAc2. GlcNAcMan5GlcNAc2-PDI was incubated with purified GM II and shown is the conversion of GlcNAcMan5GlcNAc2 to GlcNAcMan3GlcNAc2 on each site over 60 minutes (n = 3). Shown in this graph is only the generation of the final product GlcNAcMan3GlcNAc2, a more thorough study of the produced intermediates is shown in Fig. 4B. | ||
For processing of Man9GlcNAc2-PDI (20 μM) to Man5GlcNAc2 by GM I (0.1 μM), site 4 again proved to be processed slowest: Only 8% of the site 4 glycans were converted to Man5GlcNAc2 (in contrast to 80% at sites 2 and 5, Fig. 2B).
The processing of Man5GlcNAc2 by glycosyltransferase GnT I also proved to be slowest at site 4. After incubation of Man5GlcNAc2-PDI (30 μM) with GnT I (0.15 μM) and UDP-GlcNAc (5 mM) only about 65% of the site 4 glycans were converted to GlcNAcMan5GlcNAc2, while glycans at sites 2 and 3 were converted to about 90% (Fig. 2C). However, to quantify the effect of site 4 being processed slower we next turned to a Michaelis–Menten analysis instead of an end-point analysis (Fig. 3B).
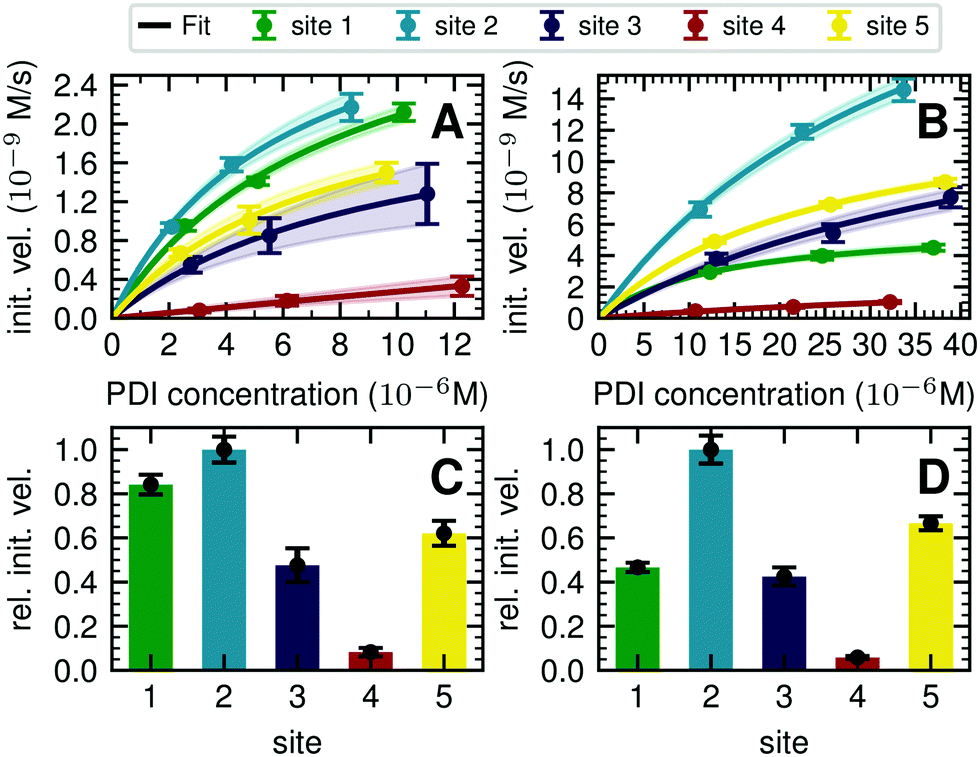 | ||
| Fig. 3 Michaelis–Menten analysis of processing kinetics. (A) Initial velocities of ER Man I are plotted against three different substrate (PDI) concentrations and fitted to Michaelis–Menten kinetics by nonlinear regression (GraphPad Prism software). Error bars represent the standard error of linear regression fits in Fig. S8 (ESI†) (n = 1). The shaded error on the fit functions are individual fits to the upper and lower limit error range of the measured data points. (B) Initial velocities of GnT I are plotted and fitted like described above for A. (C) Relative initial velocities of ER Man I normalized by initial velocity of site 2. Initial velocities were averaged over three different PDI concentrations. Error bars are calculated by Gaussian error propagation of the shaded fit error in panels A and B. (D) Relative initial velocities of GnT I normalized like described above for C. | ||
The largest differences in site-specific remodeling could be observed for GM II (Fig. 2D). Sites 1–3 and 5 of GlcNAcMan5GlcNAc2-PDI (20 μM) reacted to more than 90% to GlcNAcMan3GlcNAc2 in the presence of GM II (67 nM) within 60 minutes, while hardly any conversion could be observed on site 4.
Hence, we observed that for all four enzymes, despite being hydrolases or transferases, site 4 was processed slowest.
Michaelis–Menten analysis of processing kinetics
To quantify the site-specific differences in glycan processing kinetics for the one-step reactions catalyzed by ER Man I and GnT I, we next recorded the dependence of the initial velocity of substrate conversion on PDI concentration at constant processing enzyme concentration (ER Man I: 0.6 nM; GnT I: 67 nM). Site-specific differences in glycosylation site occupancy of PDI (Table S1, ESI†) and efficiency of kifunensine treatment (for the ER Man I assay) or GM I treatment (for the GnT I assay) were analyzed by MS in order to calculate the actual concentration of substrate glycan structure per site.Initial velocities of ER Man I (Fig. 3A) and GnT I (Fig. 3B) for all five sites against PDI concentration were plotted together with fits according to a Michaelis–Menten mechanism. We observed initial velocities increased with PDI concentrations towards saturation (Tables S2, S3 and Fig. S8, ESI†). While the initial velocities of GnT I approached vmax for all sites, they still increased nearly linearly on site 4 for ER Man I. Consequently, determination of catalytic parameters of ER Man I was not possible for site 4. The data, however, implied that KM of ER Man I for site 4 is likely at least one order of magnitude higher than for all the other sites. Also for GnT I, site 4 showed the highest KM value (Table 1).
| Site 1 | Site 2 | Site 3 | Site 4 | Site 5 | ||
|---|---|---|---|---|---|---|
| ER Man I | v max (10−9 m s−1) | 3.8 ± 0.5 | 3.7 ± 0.3 | 2.4 ± 0.2 | ND | 2.7 ± 0.3 |
| K M (10−6 M) | 8.1 ± 1.8 | 5.9 ± 0.9 | 9.4 ± 1.3 | ND | 7.5 ± 1.3 | |
| k cat (s−1) | 6.3 ± 0.8 | 6.2 ± 0.5 | 3.9 ± 0.3 | ND | 4.4 ± 0.4 | |
| k cat/KM (106 M−1 s−1) | 0.8 ± 0.2 | 1.1 ± 0.2 | 0.4 ± 0.1 | ND | 0.6 ± 0.1 | |
| GnT I | v max (10−9 m s−1) | 6.1 ± 0.004 | 31.4 ± 4.1 | 17.7 ± 7.9 | 3.2 ± 1.3 | 14.4 ± 0.006 |
| K M (10−6 M) | 13.2 ± 0.02 | 38.2 ± 8.4 | 52.2 ± 37.1 | 70.4 ± 38.3 | 25.1 ± 0.02 | |
| k cat (s−1) | 0.1 ± 0.0001 | 0.5 ± 0.1 | 0.3 ± 0.1 | 0.05 ± 0.02 | 0.2 ± 0.0001 | |
| k cat/KM (103 M−1 s−1) | 6.8 ± 0.1 | 12.3 ± 3.9 | 5.0 ± 4.5 | 1.4 ± 0.5 | 8.0 ± 0.01 |
In addition to KM, kcat values were calculated for ER Man I and GnT I, showing the highest turnover of substrate molecules on site 1 and 2, respectively. For both enzymes, kcat/KM was highest for site 2, indicating that the glycan from site 2 was the preferred substrate of ER Man I and GnT I.
In order to compare initial velocities between sites, we normalized them by the initial velocity of site 2. These relative initial velocities were averaged over three PDI concentrations and reveal that the trimming of the oligosaccharide by ER Man I was approximately 10 times slower at site 4 compared to site 2 (Fig. 3C). For GnT I, site 4 reached only about 7% of the initial velocity of site 2 (Fig. 3D).
Rate constants describing appearance and disappearance of intermediate structures
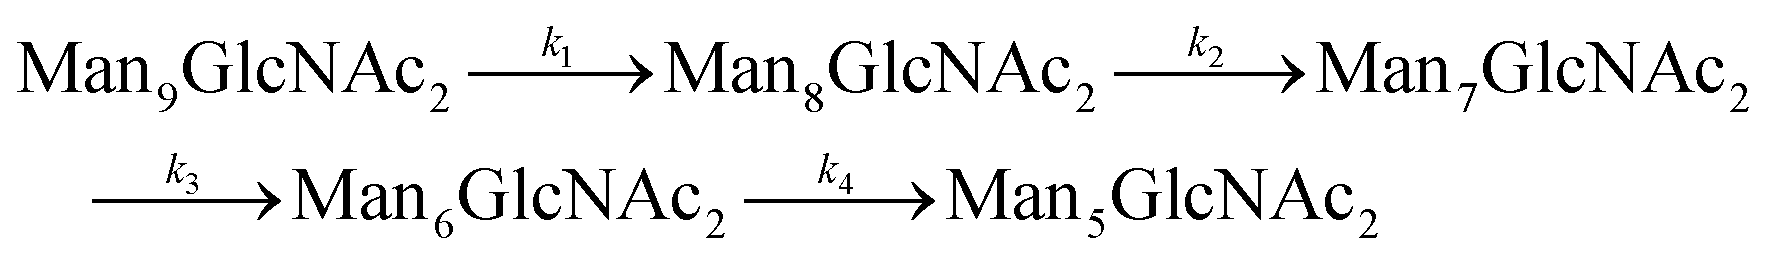
Since GM I and GM II catalyze multiple, consecutive trimming reactions, each processing step was studied separately by recording the disappearance of the substrate, the transient accumulation of reaction intermediates and the formation of the final product. For fitting the dependence of the concentrations of all species on reaction time, we assigned apparent, first-order rate constants (k1–k4) to each reaction step as an approximation (Fig. 4A and B). | ||
| Fig. 4 Site-specific processing by GM I and GM II. (A) Consecutive mechanism for the step-wise removal of terminal mannoses from the Man9GlcNAc2 glycans of PDI by GM I. Conversion of Man9GlcNAc2 to Man8GlcNAc2, Man8GlcNAc2 to Man7GlcNAc2, Man7GlcNAc2 to Man6GlcNAc2, and Man6GlcNAc2 to Man5GlcNAc2 is described by apparent rate constants k1, k2, k3 and k4, respectively. Kinetics of glycan processing are shown for each of the five glycosylation sites of PDI individually. Solid lines represent a global fit of the data from each glycosylation site according to the mechanism shown above. Error bars represent the standard deviation of three independent experiments (n = 3). (B) Consecutive mechanism for the stepwise removal of terminal mannoses from the GlcNAcMan5GlcNAc2 glycans of PDI by GM II. Conversion of GlcNAcMan5GlcNAc2 to GlcNAcMan4GlcNAc2 and GlcNAcMan4GlcNAc2 to GlcNAcMan3GlcNAc2 is described by apparent rate constants k1 and k2, respectively. | ||
PDI (20 μM) was incubated with GM I (0.1 μM) and glycan processing from Man9GlcNAc2 to Man5GlcNAc2, as well as the appearance and disappearance of all intermediate structures was followed (see Fig. S4A (ESI†) for a detailed overview of reactions performed by GM I). Hereby, the conversion of Man9GlcNAc2 to Man8GlcNAc2 (k1) occurred with similar kinetics at all sites. In contrast, values for k2 and k3 at site 4 were ∼10–20 fold lower compared to those at the other sites (inset in Fig. 4A and Table S4, ESI†), evidenced by the transient accumulation of the Man8GlcNAc2 and Man7GlcNAc2 intermediates (Fig. 4A). In addition, the results showed that the conversion of the Man6GlcNAc2 to the Man5GlcNAc2 glycoform was rate-limiting for the formation of the final product Man5GlcNAc2 at all glycosylation sites and occurred 16 to 34 fold slower than the slowest of the other processing steps. Again, site 4 showed the slowest Man6GlcNAc2 to Man5GlcNAc2 conversion with k4 being 4–16 fold lower than the k4 values at the other sites.
The global fits of Man9GlcNAc2 processing at sites 1–5 by GM I agreed reasonably well with the experimental data (Fig. 4A). The largest deviations from the fit were observed for the kinetics of formation of the final product Man5GlcNAc2. This indicated that the processing mechanism might be more complex than a consecutive 4-step mechanism and might include branch points and parallel pathways.25
We therefore extended the reaction mechanism by adding a branch point after Man7GlcNAc2, assuming the formation of two different Man6GlcNAc2 isomers (Fig. S9 and Table S5, ESI†). The corresponding six-parameter fit indeed agreed better with the experimental data, but we consider the results underdetermined, because we could not experimentally distinguish the different Man6GlcNAc2 isomers.
Also, GM II performs multiple mannose trimming steps. It cleaves two mannoses with different glycosidic linkages (α-1,3 and α-1,6 linked) in one catalytic site. However, as shown above (Fig. 2D), hardly any conversion of GlcNAcMan5GlcNAc2 to GlcNAcMan3GlcNAc2 could be observed on site 4. To determine the affected mannose trimming step, we measured kinetics of GM II (67 nM) for the processing of the substrate GlcNAcMan5GlcNAc2-PDI (20 μM). The data of each glycosylation site was fitted according to a consecutive mechanism with two apparent, first-order rate constants k1 and k2 approximating the conversion of GlcNAcMan5GlcNAc2 to the intermediate GlcNAcMan4GlcNAc2 and the product GlcNAcMan3GlcNAc2, respectively (Fig. 4B). At sites 1–3 and 5, both trimming steps occurred with practically identical rates (inset in Fig. 4B and Table S6, ESI†), the substrate was consumed within 30 minutes and the intermediate reached a maximum level of ∼30% after five minutes. In contrast, both steps were significantly slower at site 4, with k1 and k2 being ∼30 fold and 50–100 fold lower compared to the other sites. Consequently, the intermediate had only gradually accumulated to ∼30% after 60 minutes of the reaction and virtually no final product GlcNAcMan3GlcNAc2 was produced (Fig. 4B).
Influence of the protein structure on site-specific mannose trimming
Our atomistic MD simulations revealed an essential role of the tertiary structure context for the site-specific substrate properties of identically composed glycans. PDI contains two catalytic disulfide bonds and one additional, structural disulfide bond (Fig. 1B).31,35 Nearly complete formation of these disulfide bonds (96%) was confirmed by Ellman assay. To probe the influence of glycoprotein structure on site-specific processing kinetics, we altered the structure of PDI by reducing and subsequently alkylating the three disulfide bonds. The alkylation resulted in slight conformational changes as detected by far-UV circular dichroism (CD) spectroscopy (Fig. 5A). As this structural change was by no means comparable to that occurring upon complete denaturation of PDI with 6 M guanidine hydrochloride, the structure of reduced and alkylated PDI still remained native-like.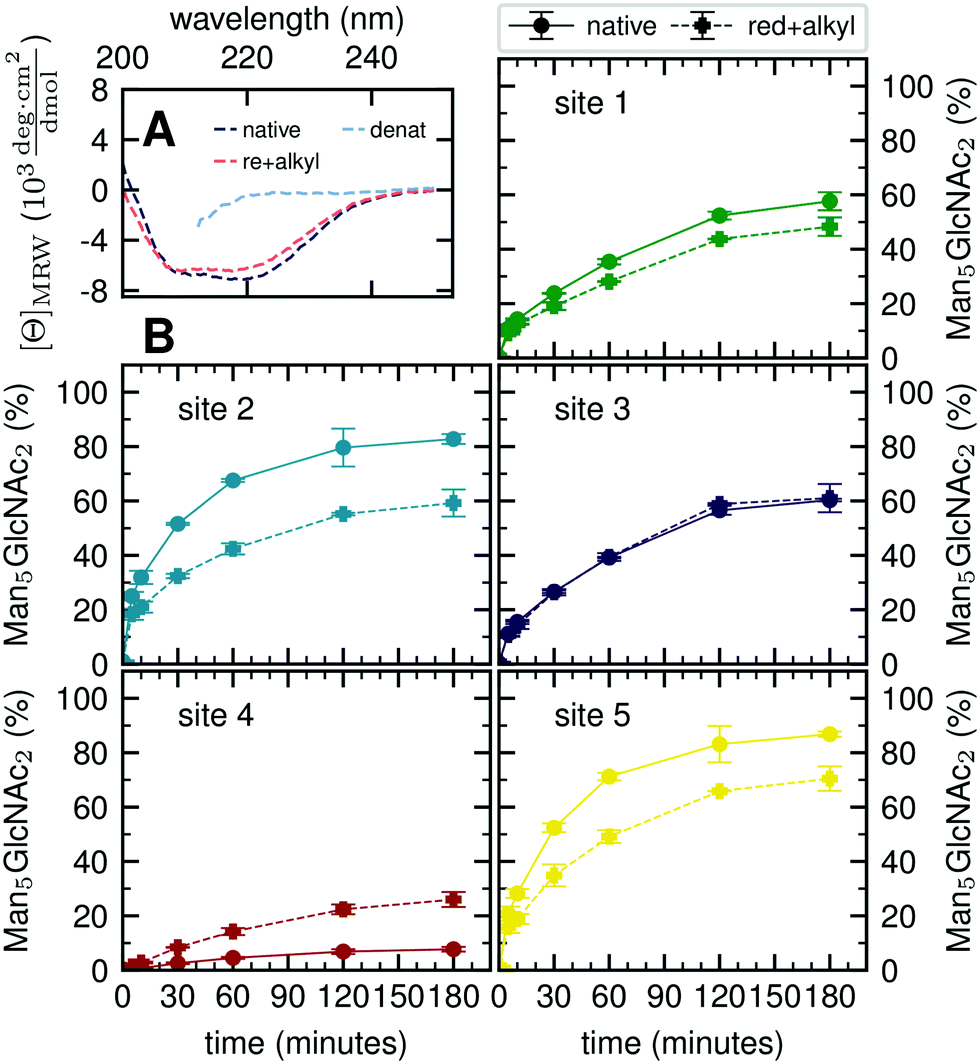 | ||
| Fig. 5 Influence of protein structure on site-specific glycan processing by GM I. (A) Far-UV CD spectra of native, reduced and alkylated, and denatured PDI. Reduction and alkylation of the three disulfide bonds led to a slight change in the structure of PDI. The less pronounced minimum (at 222 nm) and maximum (at 200 nm) indicated a small loss of secondary structure. (B) Reduced and alkylated (dashed line) as well as native (solid line) PDI was incubated with GM I. Shown is the conversion of Man9GlcNAc2 to Man5GlcNAc2 on each site over 180 minutes in comparison to processing of the respective site on native PDI. Error bars represent the standard deviation of three independent experiments (n = 3). | ||
Reduced and alkylated as well as native, oxidized Man9GlcNAc2-PDI (20 μM) was then used as a substrate for GM I (0.1 μM) (Fig. 5B). Site-specific formation of the final product Man5GlcNAc2 was monitored and compared to the respective site on native PDI. We observed that site 4 was processed more efficiently on the reduced and alkylated protein, whereas site 1, 2 and 5 glycans were hydrolyzed slower. For the site 3 glycan, no difference in processing by GM I was observed.
Discussion
We demonstrated that four different, early in the N-glycan maturation pathway acting enzymes (ER Man I, GM I, GnT I and GM II) performed glycan processing at the five sites of PDI with different kinetics. As these enzymes generate the glycosubstrates for all later acting enzymes, they play a crucial role in determining the final glycostructures on PDI. For all the enzymes tested, site 4 was processed the slowest, while sites 2 and 5 were processed most efficiently. This order of reactivity was also observed for the same glycoprotein in vivo in insect and CHO cells.15,19 We therefore concluded that identical glycans at different glycosylation sites presented different substrate properties to the processing enzymes.We used MD simulations to study the glycan conformations and accessibility on the protein surface in order to explain the site-specific substrate properties of the N-linked glycans. The accessibility of ‘free’ and/or ‘exposed’ glycan conformations to processing enzymes exhibited a clear site-specificity. This site-specific substrate availability can be qualitatively compared to the enzyme's particular structure and the specific glycan–enzyme binding modes. For instance, GH47 α-mannosidases typically have a deep and narrow funnel to the catalytic center that binds one glycan branch at a time.34 Hence, the contacting conformations, which expose only individual branches, may still be accessible for enzyme processing. However, even though the MD simulations provided an in-depth analysis of site-specific branch accessibility, the analytical method (MS) was unable to distinguish between different glycan isomers. Therefore, the in vitro assays did not yield information about branch specific processing.
The convex and concave protein surface topologies in the immediate surrounding of sites 2 and 4 (Fig. S1, ESI†) represent different presentation platforms of the N-glycan that also affect the glycan accessibility. At site 2, the positive protein surface curvature potentially minimizes steric clashes when binding to α-mannosidase from the GH47 family. In contrast, the concave protein surface around site 4 potentially interferes with binding by the enzyme even though the glycan conformation might not be in contact with the protein surface. Stretched and extended conformations of glycans may be ideally suited for binding in the deep binding pocket of α-mannosidases. However, at site 4 the steric hindrance of a concave protein surface diminishes the accessibility of the otherwise ‘free’ glycan conformations for processing enzymes. At site 2, the combination of a convex protein surface topology and extended glycan branches may be especially advantageous for unhindered glycan–enzyme complexation. This preference of site 2 over site 4 was observed experimentally and we therefore concluded that the substrate properties of N-linked glycans as observed by MD simulations reflected their biochemical properties.
An N-linked glycan on a convex protein surface represents an ideal substrate for a given enzyme, with the affinity solely determined by the glycan–enzyme interaction. Indeed, for ER Man I and GnT I we found the site 2 glycan to be the preferred substrate (highest kcat/KM value). However, the relative initial reaction rates for the other sites differed between the two enzymes, showing that the interpretation of the ‘in contact & exposed’ glycan conformations in terms of accessibility as well as the influence of the protein surface topology depends on the exact glycoprotein–enzyme complex. For site 4, we noted a higher KM value for both enzymes, indicative for additional protein–glycan interactions due to the concave nature of the protein surface at this glycosylation site. Accordingly, the structural differences of ER Man I and GnT I explain the different site-specific effects on the respective KM values.36,37 When the atomistic details of these complexes will hopefully become available in the future, we anticipate that a quantitative and qualitative analysis of glycans based on MD simulations can be further refined.
We further investigated glycan–protein interactions by reduction and alkylation of PDI. Previously it has been shown that denaturing the glycoprotein soybean agglutinin with 8 M urea improved the processing of its N-glycans by ER Man I.38 However, our data on reduced and alkylated PDI suggest that subtle structural differences can already have site-specific effects: well processed and therefore probably easily accessible N-glycans from sites 1, 2 and 5 showed slower processing kinetics upon alkylation. We hypothesize that the change in protein structure featured new interactions, not present in the native PDI, between the glycans from sites 1, 2 and 5 and the PDI surface. For the site 4 glycan, on the other hand the slight change in protein structure improved processing significantly, while there was no effect detectable for site 3.
Within the framework of our hypothesis, folding intermediates in the ER or conformational isomers of folded proteins in the ER and Golgi may represent distinct substrates for site-specific glycan processing in kinetically controlled processing pathways. The differential processability of a defined N-linked glycan might even display the folding status of the covalently linked protein in processes such as the quality control pathway of protein folding in the ER.5
Our detailed biochemical analysis allowed us to follow enzymes that perform multiple processing steps like GM I and GM II. We identified the rate-limiting step in trimming of a Man9GlcNAc2 to Man5GlcNAc2 by GM I to be the last step (Man6GlcNAc2 to Man5GlcNAc2). Lal et al. argued that the last mannose trimmed by GM I is the terminal mannose from the B-branch of the glycan, which is in vivo trimmed in the ER by ER Man I.25 In case of PDI, this last trimming step was greatly impaired on site 4.
Trimming of two mannoses from GlcNAcMan5GlcNAc2 by GM II is an essential step in the conversion of hybrid to complex N-glycans.39 Our analysis showed that GM II has, compared to the other enzymes tested, the lowest activity on site 4 with a decrease in activity of two orders of magnitude relative to the other sites, which explained why a secreted version of PDI produced in CHO cells showed the highest percentage of hybrid glycan structures on site 4.19 However, our analysis showed that GM II was able to process the site 4 glycan to some degree, indicating a time and/or enzyme-limited process in vivo.
The eukaryotic secretory pathway is organized such that glycoproteins are exposed for a limited time to processing enzymes located in different compartments of the pathway.21,40,41 Therefore, site-specific initial processing velocities are a determining factor for N-glycan processing in vivo, together with the residence times of glycoproteins in the individual compartments of the secretory pathway. In such a kinetically controlled system, small alterations of enzyme levels, as observed for example during cellular differentiation in a multicellular organism, can have strong qualitative and quantitative effects on the glycoproteome. Site-specific glycan structures will be affected differently on proteins with multiple glycosylation sites. Therefore, a quantitative glycoproteomics analysis will become a necessity in order to understand the functional properties of glycoproteins.
Material and methods
MD simulations
The crystal structure from the Protein Data Bank (PDB: 2B5E31) was used as template for PDI. The simulations with the full-length PDI glycoprotein were prepared to account for the flexible nature of the glycans and the protein. The glycoprotein conformations were pre-sampled with the REST2 Hamiltonian replica exchange method42 as described in Section S1 (ESI†). The enhanced conformational sampling was used in two ways: (i) construction of an optimized triclinic box size43 as described in Section S2 (ESI†), and (ii) the sampled structures served as starting configurations for the production runs.All MD simulations were performed using the GROMACS 2018 simulation software.44 The AMBER ff99SB-ILDN force field45 was used for the protein and the GLYCAM06h force field46 for the glycans. One setup contained the full-length PDI protein with Man9GlcNAc2 glycans attached at Asn82 (site 1), Asn117 (site 2), Asn155 (site 3), and Asn174 (site 4). This setup was solvated in 63![[thin space (1/6-em)]](https://www.rsc.org/images/entities/char_2009.gif) 000 TIP5P water molecules47 in the optimized box (see Section S2, ESI†), and 42 sodium ions48 were added to neutralize the system. The choice of the TIP5P water model in combination with the original GLYCAM06h force field parameters was based on the findings in ref. 49–51. A second setup only contained the a′-domain with a Man9GlcNAc2 glycan at Asn425 (site 5), starting from residue Lys366, which was capped by a N-Me amide group. This setup was solvated by 12000 TIP5P water molecules in a 6.4 nm × 6.4 nm × 9.5 nm rectangular box such that the glycan was pointing along the z-direction. For system neutralization, this setup contained 11 sodium ions.48
000 TIP5P water molecules47 in the optimized box (see Section S2, ESI†), and 42 sodium ions48 were added to neutralize the system. The choice of the TIP5P water model in combination with the original GLYCAM06h force field parameters was based on the findings in ref. 49–51. A second setup only contained the a′-domain with a Man9GlcNAc2 glycan at Asn425 (site 5), starting from residue Lys366, which was capped by a N-Me amide group. This setup was solvated by 12000 TIP5P water molecules in a 6.4 nm × 6.4 nm × 9.5 nm rectangular box such that the glycan was pointing along the z-direction. For system neutralization, this setup contained 11 sodium ions.48
All MD simulations were performed using the leapfrog integrator52 with a step size of 2 fs. The solute coordinates were stored every 20 ps. The enhanced sampling and production protocols were carried out under an isothermal–isobaric (NPT) ensemble with periodic boundary conditions. The temperature was kept constant at T = 300 K using the V-rescale thermostat53 with a coupling time of 0.1 ps. The pressure was kept constant at 1 bar using the Parrinello–Rahman barostat54 with a coupling time of 2 ps and a compressibility of 4.5 × 10⁻⁵ bar−1. The Verlet cutoff-scheme55 was applied for non-bonded interactions with a cutoff of 1.0 nm, a neighbor list update frequency of 20 fs, and a buffer tolerance of 10−4. The smooth particle mesh Ewald method56 with a grid spacing of 0.16 nm and interpolation order of four was used for long-range electrostatics. The SHAKE algorithm57 was applied to rigidify all bonds.
For the exhaustive sampling of the glycoprotein ensemble, random frames were chosen from the REST2 replica trajectory at T = 300 K. The glycans in these conformations were removed and new Man9GlcNAc2 glycans were attached using the doGlycans tool.58 These glycan starting conformations were randomly varied within the thermodynamically most stable configurations. The thermodynamically most stable glycosidic bond dihedral angles were taken from ref. 59 and randomly varied within a range ±40° upon a particular MD starting setup. The generated glycoprotein conformations were solvated in the previously optimized box. The first 10 ns of the simulations were discarded as equilibration. The final production trajectories ranged from 100 ns to 400 ns. Multiple trajectories starting from diverse initial configurations were produced to obtain an aggregate sampling of 75 μs and 110 μs for the full-length PDI and the a′-domain setup, respectively.
Markov state modeling
Inverse distances of glycan residues to vicinal hexoses and amino acids (with hydrogen bond donating/accepting side chains) were chosen as features for the MSMs, as described before.13,14 Each glycan was individually analyzed using a site-specific choice of considered neighboring glycans and protein surface residues for the (inverse) distance calculations (Table S7, ESI†). For the distances involving hexoses, the respective O5 atom positions were taken. For amino acids, a side-chain specific atom position was considered (listed in Table S8, ESI†). Note that in contrast to the previous MSMs of glycoproteins,13,14 where very few features were manually selected for the sake of modeling ease, our featurization includes all spatially reachable amino acid and carbohydrate moieties.In the next step, a dimensionality reduction was performed using the principal component analysis (PCA) and choosing the first ten dimensions (n = 10). Subsequently, the hierarchical volume-scaled common nearest neighbor (vs-CNN) clustering algorithm was used to discretize the trajectory into conformational microstates, i.e. clusters.60 We started by finding an initially large cutoff R0, such that 99% of the data was clustered, while the similarity N = 10 was fixed. For sites 1–5 different values were respectively obtained for R0 = {1.4, 1.2, 1.4, 1.4, 1.0}. Next, the cutoff was decreased in steps of Ri+1 = Ri·e−β·ΔF/n where ΔF is the free energy difference between hierarchical levels and β = 1/kBT with kB as Boltzmann constant. Several hierarchical trees were tested using the parameter values ΔF = {0.6, 0.8, 1.0, 1.2, 1.5, 2.0}kBT. In each step i, a given cluster of minimum size Nsplit was updated if it was split into at least two new clusters of minimum size Nkeep. These parameters were chosen as pairs from Nsplit = {101, 1001} and Nkeep = {11, 101, 1001}, while Nsplit ≥ Nkeep was ensured. The transition matrix of a particular microstate state-space was estimated using milestoning in the maximum likelihood estimation from the PyEMMA package.33 Since density-based clustered data was previously shown to improve the Markovian assumption for core-set MSM building,61–63 a lag time of 100 ps could be chosen in this work. The major quantity obtained from the MSM is the stationary probability Pi of microstate i contained in the first eigenvector of the transition probability matrix.61–63
Accessibility assessment
For each microstate the glycan conformations were quantified by the solvent accessible surface area (SASA) Asolv, the number of hydrogen bonds Nh, and the number of atomic contacts Nc with the site-specific glycoprotein environment. The SASA was determined using the Shrake–Rupley algorithm implementation in MDTraj.64,65 The probe sphere radius was set to 1.4 Å and 960 points were used to represent the surface of an atom. For the hydrogen-bond count Nh, a geometric criterion of 0.35 nm donor–acceptor distance and a hydrogen-donor–acceptor angle of 30° was used. For consistency, the contact criterion for Nc also involved an atomic distance threshold of 0.35 nm. During the hydrogen bond and contact analysis of a given mannose residue, the direct neighboring mannoses were excluded. Also, the hydrogen bond count was subtracted from the number of atomic contacts for each frame to avoid double counting.The above quantities were averaged across the conformations in a microstate i for each mannose k, l, and m of branch Y, such as, k = 9, l = 6, and m = 4 of branch A (see Fig. 1A). The average of the full length of branch Y was the sum 〈·〉Y,i = 〈·〉k,i + 〈·〉l,i + 〈·〉m,i. Generally, varying lengths of the branches could be compared whilst taking one {k}, two {k, l}, or three {k, l, m} monosaccharides into account. In the remainder, we use the subscripts in the notation for the average 〈·〉Y,i only if required.
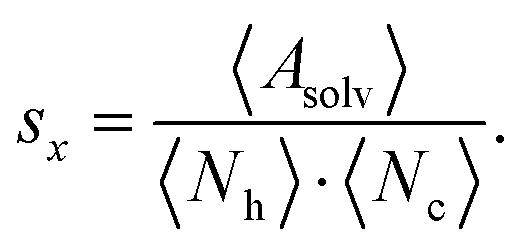
To quantify the accessibility or exposure of a given monosaccharide in a glycan branch, the exposure score sx (x-score) was defined as the combination of the individual measures as follows,
We classified ‘free’ and ‘contact’ microstates via the number of atomic contacts across all full-length glycan branches, i.e., Ntotc = 〈Nc〉A + 〈Nc〉B + 〈Nc〉C. For a given threshold Nthreshc < Ntotc the glycan conformations within the microstate were considered in ‘contact’. Hence, for Nthreshc ≥ Ntotc the glycan conformations of the microstate were considered to be ‘free’. Additionally, branch Y with x-score sYx in a given microstate was considered ‘exposed’ if for a given threshold sthreshx < sYx. In combination with the MSMs, the relative abundance of particularly classified conformations was calculated as the ensemble average based on the stationary probability distribution from the MSMs. For example, the fraction of exposed conformations is 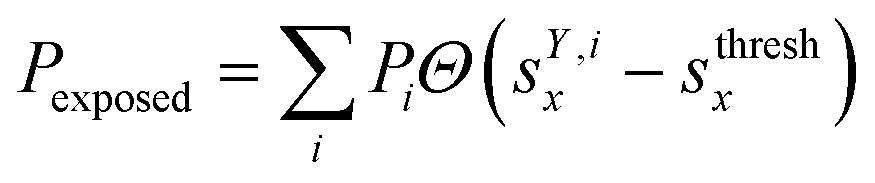 where Θ(x) is the Heaviside step function. Also, combinations of ‘free’ and ‘contact’ with the ‘exposed’ classifications, respectively, were considered, as
 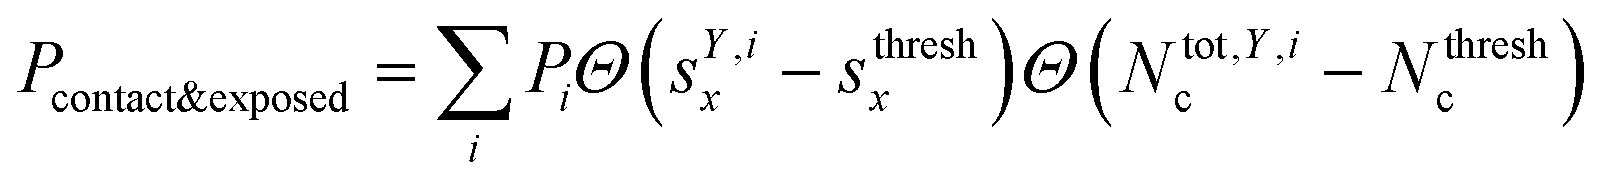 . These ensemble averages and their standard deviation of microstate classification were calculated over several MSMs, i.e., stationary probability distributions Pi from the different clustering results (section Markov state modeling), and varying threshold values of Nthreshc = [{3, 5, 7, 9}] and sxthresh = [{1.0, 1.25, 1.5, 1.75, 2.0}].
Constructs
From the PDI expression construct pRG85,15 the C-terminal sequence “LELQLEHDEL” was removed by using the primers prHI_14_fw and prHI_15_rev (Table S9, ESI†). PCR was performed with Phusion polymerase (Thermo Fisher) and phosphorylated primers. PCR products were ligated with T4 ligase (NEB). The resulting plasmid (pRG85_CM) was transformed into DH5α E. coli cells. Baculovirus stocks for secreted, N-terminally His8-tagged, human glycan processing enzymes ER Man I (MAN1B1), GM I (MAN1A2) and GnT I (MGAT1) were obtained from the glycoenzyme repository http://glycoenzymes.ccrc.uga.edu/.66 Purified, recombinantly produced Drosophila melanogaster Golgi Mannosidase II (α-Man-II a) was kindly provided by Dr Douglas Kuntz from the University of Toronto.67Production and purification of substrate PDI
Recombinant bacmids containing the gene of interest (PDI) were generated according to the Baculovirus Expression system manual (Thermo Fisher Scientific, Cat. No. 10359016). In brief, DH10Bac E. coli cells (Thermo Fisher, Cat. No. 10361-012) were transformed with pRG85_CM and bacmid DNA was subsequently isolated and used to transfect Sf21 cells (Thermo Fisher, Cat. No. 11497013) using the Cellfectin™ II reagent (Thermo Fisher, Cat. No. 10362100). Recombinant viruses were harvested after 72 hours from the supernatant. Expression and purification of PDI was done as described by Hang et al.15 Briefly, High-Five™ cells (Thermo Fisher, Cat. No. B855-02) were infected with the virus stock. For homogenously glycosylated PDI (Man9GlcNAc2 on all sites) 10 μM α-1,2-mannosidase inhibitor kifunensine (Sigma-Aldrich Chemie GmbH, Cat. No. K1140) was added to the cell culture. After 48 hours, cells were lysed and the His10-tagged PDI was purified using Ni-NTA beads (Protino, Cat. No. 745400.100). Purified PDI was buffer exchanged to the activity buffer required by the enzyme used in the assay. PDI concentration was determined using the NanoDrop UV-Vis spectrophotometer (Thermo Fisher). For storage, PDI was flash-frozen in liquid nitrogen and kept at −80 °C. Fig. S10 (ESI†) shows that freezing and thawing of PDI had no influence on the site-specific processing of its N-glycans.Production and purification of glycan processing enzymes
High-Five™ cells were infected with recombinant baculovirus stocks for either ER Man I, GM I or GnT I like described before for PDI. After 72 hours, the cell culture was centrifuged at 3500 rcf for ten minutes, supernatants were filtered using 0.22 μM filters (TRP, Cat. No. 99722) and enzymes were purified via their His-tag. Therefore, 1 ml of Ni-NTA beads per 50 ml supernatant were washed three times with 10 column volumes (CV) phosphate buffered saline (PBS) and subsequently mixed with the supernatant. Batch binding was done on a spinning wheel for three hours at 4 °C. The bound fraction was transferred to a gravity flow column (Macherey-Nagel, Cat. No. 745250.10) and washed with 15 CV washing buffer (25 mM imidazole in PBS, adjusted with HCI to pH 7). Elution was done with 4 CV of elution buffer (250 mM imidazole in PBS, pH 7). Purified enzymes (Fig. S11, ESI†) were buffer exchanged to PBS with 10% Glycerol (v/v), flash frozen in liquid nitrogen and stored at −80 °C.Enzyme in vitro assays
All in vitro assays were performed with PDI as a substrate and either ER Man I, GM I, GnT I or GM II in an enzyme specific activity buffer (Table S10, ESI†). Immediately after addition of the enzyme to PDI, the reaction mix was incubated at 37 °C and shaken at 500 rpm.For in vitro assays with ER Man I and GM I, PDI purified from High-Five™ cells treated with kifunensine was used as a substrate. PDI therefore showed mainly Man9GlcNAc2 on all sites, presenting a homogenous glycosubstrate for the tested enzyme (Fig. S5A, ESI†).
For the GnT I in vitro assay purified PDI (without kifunensine treatment) was pre-incubated over night with the enzyme GM I (enzyme to substrate molar ratio 1:200) at room temperature to hydrolyze glycans (Man9GlcNAc2 to Man6GlcNAc2) to Man5GlcNAc2, the glyco-substrate of GnT I (Fig. S5B, ESI†). The GnT I assay was subsequently performed in GnT I activity buffer68 containing 5 mM of UDP-GlcNAc (Sigma-Aldrich Chemie GmbH).
The substrate preparation for the GM II assay was done by successively incubating PDI (without kifunensine treatment) with two glycan processing enzymes. First with GM I (enzyme to substrate molar ratio of 1:300) for four hours at 37 °C to obtain mainly Man5GlcNAc2 on all sites. After buffer exchange to GnT I activity buffer, 5 mM of UDP-GlcNAc and purified GnT I in an enzyme to substrate molar ratio of 1:300 was added to the reaction mix. After four hours of incubation at 37 °C PDI showed mainly GlcNAcMan5GlcNAc2 on all sites (Fig. S5C, ESI†).
At indicated time points, samples containing a minimum of 50 μg of PDI were taken. To stop the reaction each aliquot was mixed with trichloroacetic acid (15% final concentration) and kept on ice for five minutes. PDI was subsequently pelleted, washed and stored as described by Hang et al.15
Sample preparation and MS measurement
Protein pellets were dissolved in 50 μl of 8 M Urea and loaded onto a 30 K centrifugal filter unit (Merck). Preparation for MS was done as described in ref. 69. Briefly, the protein was reduced by 50 mM dithiothreitol and alkylated by 65 mM iodoacetic acid in 0.05 M ammonium bicarbonate buffer (pH 8.5) to facilitate trypsin digestion (trypsin to PDI weight ratio 1:50) at 37 °C for 16 h. For analysis of glycosite occupancy, Trypsin digest of PDI was followed by digestion of N-glycans with endo-β-N-acetylglucosaminidase H (500 U; NEB) in sodium citrate buffer (50 mm, pH 5.5) at 37 °C for 40 hours.70 Peptides were collected by centrifugation and desalted by Zip-Tip C18. For analysis, samples were dissolved in 2% acetonitrile with 0.1% formic acid and analyzed by one of the two methods described below.
Either by a calibrated LTQ-Orbitrap Velos mass spectrometer (Thermo Fischer) coupled to an Eksigent-Nano-HPLC system (Eksigent Technologies) like described in ref. 15.
Alternatively, by a calibrated Q Exactive™ mass spectrometer (Thermo Fischer) coupled to a Waters Acquity UPLC M-Class system (Waters) with a Picoview™ nanospray source 500 model (New Objective). Samples were loaded onto a Acclaim PepMap 100 trap column (75 μm × 20 mm, 100 Å, 3 μm particle size) and separated on a nanoACQUITY UPLC BEH130 C18 column (75 μm × 150 mm, 130 Å, 1.7 μm particle size), at a constant flow rate of 300 nl min−1, with a column temperature of 50 °C and a linear gradient of 1–35% acetonitrile/0.1% formic acid in 42 min, followed by a sharp increase to 98% acetonitrile in 2 min and then held isocratically for another 10 min. One scan cycle comprised of a full scan MS survey spectrum, followed by up to 12 sequential HCD scans based on the intensity. For glycosylation profiling analysis, full-scan MS spectra (800–2000 m/z) were acquired in the FT-Orbitrap at a resolution of 70000 at 400 m/z, while HCD MS/MS spectra were recorded in the FT-Orbitrap at a resolution of 35000 at 400 m/z. HCD MS/MS spectra were performed with a target value of 5 × 10⁵ by the collision energy setup at a normalized collision energy 22.
Glycoform quantification
Spectra obtained were analyzed with XCalibur 2.2 sp1.48 (Thermo Fisher) like described previously.15 For quantification, extracted ion chromatography of all glycoforms were plotted by their unique mass over charge (m/z) ratio, based on a previous study by Losfeld et al. (Table S11, ESI†).19 Peak area was defined manually and integrated by the program. The relative amount of each glycoform located on the same peptide backbone was calculated as shown before by Hang et al.15
Kinetics of site-specific glycan processing by GM I and GM II
For GM I, the glycan processing kinetics of each site were globally fitted using Dynafit71 according to the following consecutive mechanismwhere the apparent rate constants k1, k2, k3 and k4 describe the consecutive trimming of one terminal mannose residue from the PDI-Man9GlcNAc2 substrate. For GM II, the glycan processing kinetics of each site were globally fitted using OriginPro 2018b (OriginLab) according to the 2-step consecutive mechanism
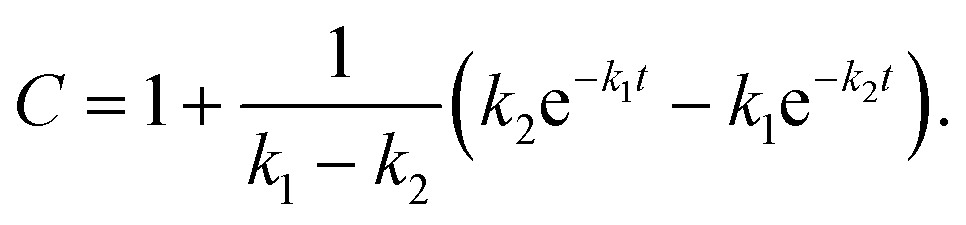
where A, B and C represent PDI-GlcNAcMan5GlcNAc2, PDI-GlcNAcMan4GlcNAc2 and PDI-GlcNAcMan3GlcNAc2. The fractions of these glycoforms are then given by
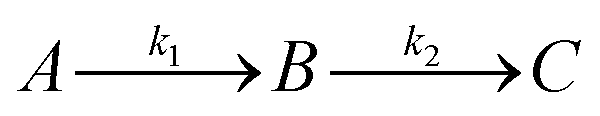
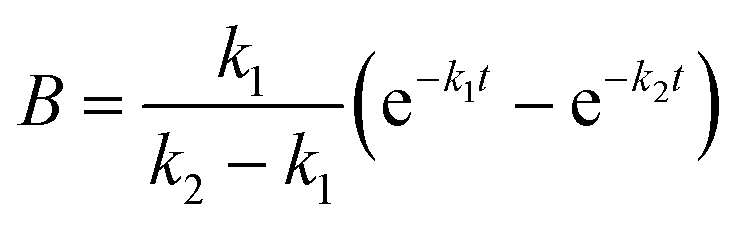
| A = e−k1t |
The apparent rate constants k1 and k2 were shared among the three datasets of each glycosylation site.
Reduction and alkylation of PDI
Reduction and alkylation of PDI was done as described earlier for preparation of proteins for MS.69 The alkylation of cysteines was highly efficient as only alkylated peptides were detected by MS.Circular dichroism
To determine if reduction and alkylation of the protein changed the protein structure, far-UV circular dichroism (CD) spectra were recorded. PDI was purified from kifunensine treated High-Five™ cells. To increase purity of the PDI sample two additional purification steps on a Basic Äkta module (Amersham Biosciences) were introduced. First, PDI (in PBS, pH 7) was submitted to size exclusion chromatography on a Superose™ 12 10/300 GL column (GE Healthcare, Cat. No. 17-5173-01) at a flow rate of 0.5 ml min−1 with PDI eluting between 11 and 14 ml.In the second step, hydrophobic interaction chromatography using a Hi-Trap Butyl-Sepharose column (GE Healthcare, Cat. No. 28411001) with a flow rate of 1 ml min−1 and a gradient from 0.9 M (NH4)2SO4 in PBS to PBS over 5 CV was performed. The peak eluting between 16 and 22.5 ml was collected, and buffer exchanged to PBS.
Far-UV CD spectra of oxidized native, reduced and alkylated and denatured oxidized PDI (with 6 M guanidine hydrochloride) were recorded at a protein concentration of 0.4 mg ml−1 in PBS, pH 7.0 at 25 °C using a temperature-controlled J715 CD spectrometer (Jasco). CD signals were converted to mean residue ellipticity as described by Schmid et al.72
Author contributions
MA and SR designed the research. MEL, CM, and RGW designed the experiments and simulations. CM and CG performed the experiments. RGW performed the simulations. CM, RGW, CG, RG and CWL analyzed the data. CM, RGW, CG, RG, SR, and MA wrote the manuscript. All authors read and approved the final manuscript.Conflicts of interest
The authors declare that they have no conflict of interest.Acknowledgements
We thank Professor Donald Jarvis and Professor Kelley Moremen who developed the “Glycoenzyme repository” from which we obtained the expression constructs for the enzymes ER Man I, GM I and GnT I. Additionally, we would like to thank Dr Douglas Kuntz for kindly providing us with purified GM II enzyme. We also thank the Functional Genomics Centre Zürich for their help with the MS analysis. We thank Tsjerk Wassenaar for providing the source code for the near-densest lattice packing algorithm and the corresponding rotational motion removal in GROMACS 2018. This project was supported by the Swiss National Supercomputing Centre (CSCS) under Project ID s895, the Swiss National Science Foundation Grants 310030_162636 and 310030B_182835 to MA and ETH Zurich.References
- D. J. Kelleher and R. Gilmore, An evolving view of the eukaryotic oligosaccharyltransferase, Glycobiology, 2006, 16(4), 47R–62R CrossRef CAS PubMed.
- R. Wild, et al., Structure of the yeast oligosaccharyltransferase complex gives insight into eukaryotic N-glycosylation, Science, 2018, 359(6375), 545 CrossRef CAS PubMed.
- E. Mohorko, R. Glockshuber and M. Aebi, Oligosaccharyltransferase: the central enzyme of N-linked protein glycosylation, J. Inherited Metab. Dis., 2011, 34(4), 869–878 CrossRef CAS PubMed.
- D. F. Zielinska, et al., Precision mapping of an in vivo N-glycoproteome reveals rigid topological and sequence constraints, Cell, 2010, 141(5), 897–907 CrossRef CAS PubMed.
- A. Helenius and M. Aebi, Roles of N-linked glycans in the endoplasmic reticulum, Annu. Rev. Biochem., 2004, 73(1), 1019–1049 CrossRef CAS PubMed.
- D. N. Hebert, B. Foellmer and A. Helenius, Calnexin and calreticulin promote folding, delay oligomerization and suppress degradation of influenza hemagglutinin in microsomes, EMBO J., 1996, 15(12), 2961–2968 CrossRef CAS PubMed.
- C. A. Jakob, et al., Degradation of misfolded endoplasmic reticulum glycoproteins in Saccharomyces cerevisiae Is determined by a specific oligosaccharide structure, J. Cell Biol., 1998, 142(5), 1223–1233 CrossRef CAS PubMed.
- K. W. Moremen, M. Tiemeyer and A. V. Nairn, Vertebrate protein glycosylation: diversity, synthesis and function, Nat. Rev. Mol. Cell Biol., 2012, 13(7), 448–462 CrossRef CAS PubMed.
- G. Savvidou, et al., Possible role for peptide–oligosaccharide interactions in differential oligosaccharide processing at asparagine-107 of the light chain and asparagine-297 of the heavy chain in a monoclonal IgG1.kappa, Biochemistry, 1984, 23(16), 3736–3740 CrossRef CAS PubMed.
- P. J. A. Erbel, et al., Effects of the N-linked glycans on the 3D structure of the free α-subunit of human chorionic gonadotropin, Biochemistry, 2000, 39(20), 6012–6021 CrossRef CAS PubMed.
- G. Szakonyi, et al., Structure of the Epstein–Barr virus major envelope glycoprotein, Nat. Struct. Mol. Biol., 2006, 13, 996 CrossRef CAS PubMed.
- G. L. Weiss, et al., Architecture and function of human uromodulin filaments in urinary tract infections, Science, 2020, 369(6506), 1005–1010 CrossRef CAS PubMed.
- A. V. Sinitskiy and V. S. Pande, Simulated dynamics of glycans on ligand-binding domain of NMDA receptors reveals strong dynamic coupling between glycans and protein core, J. Chem. Theory Comput., 2017, 13(11), 5496–5505 CrossRef CAS PubMed.
- G. P. Subedi, et al., Intradomain interactions in an NMDA receptor fragment mediate N-glycan processing and conformational sampling, Structure, 2019, 27(1), 55–65 CrossRef CAS PubMed.
- I. Hang, et al., Analysis of site-specific N-glycan remodeling in the endoplasmic reticulum and the Golgi, Glycobiology, 2015, 25(12), 1335–1349 CrossRef CAS PubMed.
- K. Khatri, et al., Integrated omics and computational glycobiology reveal structural basis for influenza A virus glycan microheterogeneity and host interactions, Mol. Cell. Proteomics, 2016, 15(6), 1895–1912 CrossRef CAS PubMed.
- W. Chen, et al., Stabilizing the C(H)2 domain of an antibody by engineering in an enhanced aromatic sequon, ACS Chem. Biol., 2016, 11(7), 1852–1861 CrossRef CAS PubMed.
- X. Yu, et al., Engineering hydrophobic protein–carbohydrate interactions to fine-tune monoclonal antibodies, J. Am. Chem. Soc., 2013, 135(26), 9723–9732 CrossRef CAS PubMed.
- M.-E. Losfeld, et al., Influence of protein/glycan interaction on site-specific glycan heterogeneity, FASEB J., 2017, 31(10), 4623–4635 CrossRef CAS PubMed.
- J. M. Rini and J. D. Esko, in Glycosyltransferases and Glycan-Processing Enzymes, in Essentials of Glycobiology, ed. A. Varki, et al. Cold Spring Harbor Laboratory Press, Copyright 2015–2017 by The Consortium of Glycobiology Editors, La Jolla, California, All rights reserved: Cold Spring Harbor, NY, 2015, pp. 65–75.
- K. W. Moremen, M. Tiemeyer and A. V. Nairn, Vertebrate protein glycosylation: diversity, synthesis and function, Nat. Rev. Mol. Cell Biol., 2012, 13(7), 448–462 CrossRef CAS PubMed.
- T. Calì, O. Vanoni and M. Molinari, The endoplasmic reticulum: Crossroads for newly synthesized polypeptide chains, Prog. Mol. Biol. Transl. Sci., 2008, 83, 135–179 Search PubMed.
- A. R. Herscovics and L. O. Tremblay, The specificity of the yeast and human class I ER alpha 1,2-mannosidases involved in ER quality control is not as strict previously reported., Glycobiology, 2002, 12(4), 14–15 Search PubMed.
- S. W. Mast and K. W. Moremen, Family 47 α-Mannosidases in N-Glycan Processing, Methods Enzymol., 2006, 415, 31–46 CAS.
- A. Lal, et al., Substrate specificities of recombinant murine Golgi α1,2-mannosidases IA and IB and comparison with endoplasmic reticulum and Golgi processing α1,2-mannosidases, Glycobiology, 1998, 8(10), 981–995 CrossRef CAS PubMed.
- N. Harpaz and H. Schachter, Control of glycoprotein synthesis. Bovine colostrum UDP-N-acetylglucosamine:alpha-D-mannoside beta 2-N-acetylglucosaminyltransferase I. Separation from UDP-N-acetylglucosamine:alpha-D-mannoside beta 2-N-acetylglucosaminyltransferase II, partial purification, and substrate specificity, J. Biol. Chem., 1980, 255(10), 4885–4893 CrossRef CAS.
- E. Ioffe and P. Stanley, Mice lacking N-acetylglucosaminyltransferase I activity die at mid-gestation, revealing an essential role for complex or hybrid N-linked carbohydrates, Proc. Natl. Acad. Sci. U. S. A., 1994, 91(2), 728–732 CrossRef CAS PubMed.
- D. R. Tulsiani, et al., Alpha-D-Mannosidases of rat liver Golgi membranes. Mannosidase II is the GlcNAcMAN5-cleaving enzyme in glycoprotein biosynthesis and mannosidases Ia and IB are the enzymes converting Man9 precursors to Man5 intermediates, J. Biol. Chem., 1982, 257(7), 3660–3668 CrossRef CAS.
- N. Shah, D. A. Kuntz and D. R. Rose, Golgi α-mannosidase II cleaves two sugars sequentially in the same catalytic site, Proc. Natl. Acad. Sci. U. S. A., 2008, 105(28), 9570–9575 CrossRef CAS PubMed.
- K. W. Moremen, Golgi α-mannosidase II deficiency in vertebrate systems: implications for asparagine-linked oligosaccharide processing in mammals, Biochim. Biophys. Acta, Gen. Subj., 2002, 1573(3), 225–235 CrossRef CAS.
- G. Tian, et al., The crystal structure of yeast protein disulfide isomerase suggests cooperativity between its active sites, Cell, 2006, 124(1), 61–73 CrossRef CAS PubMed.
- J. H. Prinz, et al., Markov models of molecular kinetics: Generation and validation, J. Chem. Phys., 2011, 134(17), 174105 CrossRef PubMed.
- M. K. Scherer, et al., PyEMMA 2: A software package for estimation, validation, and analysis of Markov models, J. Chem. Theory Comput., 2015, 11(11), 5525–5542 CrossRef CAS PubMed.
- Y. Xiang, K. Karaveg and K. W. Moremen, Substrate recognition and catalysis by GH47 α-mannosidases involved in Asn-linked glycan maturation in the mammalian secretory pathway, Proc. Natl. Acad. Sci. U. S. A., 2016, 113(49), E7890–E7899 CrossRef CAS PubMed.
- B. Wilkinson, R. Y. Xiao and H. F. Gilbert, A structural disulfide of yeast protein-disulfide isomerase destabilizes the active site disulfide of the N-terminal thioredoxin domain, J. Biol. Chem., 2005, 280(12), 11483–11487 CrossRef CAS PubMed.
- R. D. Gordon, et al., X-ray crystal structures of rabbit N-acetylglucosaminyltransferase I (GnT I) in complex with donor substrate analogues, J. Mol. Biol., 2006, 360(1), 67–79 CrossRef CAS PubMed.
- F. Vallée, et al., Crystal structure of a class I alpha 1,2-mannosidase involved in N-glycan processing and endoplasmic reticulum quality control, EMBO J., 2000, 19(4), 581–588 CrossRef PubMed.
- J.-i. Aikawa, I. Matsuo and Y. Ito, In vitro mannose trimming property of human ER α-1,2 mannosidase I, Glycoconjugate J., 2012, 29(1), 35–45 CrossRef CAS PubMed.
- R. Strasser, et al., Molecular cloning and characterization of Arabidopsis thaliana Golgi α-mannosidase II, a key enzyme in the formation of complex N-glycans in plants, Plant J., 2006, 45(5), 789–803 CrossRef CAS PubMed.
- K. Hirschberg and J. Lippincott-Schwartz, Secretory pathway kinetics and in vivo analysis of protein traffic from the Golgi complex to the cell surface. The, FASEB J., 1999, 13(9002), S251–S256 CrossRef CAS PubMed.
- I. Arigoni-Affolter, et al., Mechanistic reconstruction of glycoprotein secretion through monitoring of intracellular N-glycan processing, Sci. Adv., 2019, 5(11), eaax8930 CrossRef CAS PubMed.
- L. L. Wang, R. A. Friesner and B. J. Berne, Replica exchange with solute scaling: A more efficient version of replica exchange with solute tempering (REST2), J. Phys. Chem. B, 2011, 115(30), 9431–9438 CrossRef CAS PubMed.
- T. A. Wassenaar, et al., SQUEEZE-E: The optimal solution for molecular simulations with periodic boundary conditions, J. Chem. Theory Comput., 2012, 8(10), 3618–3627 CrossRef CAS PubMed.
- H. J. C. Berendsen, D. van der Spoel and R. Vandrunen, Gromacs - a message-passing parallel molecular-dynamics implementation, Comput. Phys. Commun., 1995, 91(1–3), 43–56 CrossRef CAS.
- K. Lindorff-Larsen, et al., Improved side-chain torsion potentials for the Amber ff99SB protein force field, Proteins: Struct., Funct., Bioinf., 2010, 78(8), 1950–1958 CrossRef CAS PubMed.
- K. Kirschner, et al., GLYCAM06: A generalizable biomolecular force field. Carbohydrates, J. Comput. Chem., 2008, 29(4), 622–655 CrossRef CAS PubMed.
- M. W. Mahoney and W. L. Jorgensen, A five-site model for liquid water and the reproduction of the density anomaly by rigid, nonpolarizable potential functions, J. Chem. Phys., 2000, 112(20), 8910–8922 CrossRef CAS.
- V. Satarifard, et al., Is the solution activity derivative sufficient to parametrize ion-ion interactions? Ions for TIP5P water, J. Chem. Theory Comput., 2017, 13(5), 2112–2122 CrossRef CAS PubMed.
- J. Sauter and A. Grafmuller, Solution properties of hemicellulose polysaccharides with four common carbohydrate force fields, J. Chem. Theory Comput., 2015, 11(4), 1765–1774 CrossRef CAS PubMed.
- J. Sauter and A. Grafmuller, Predicting the chemical potential and osmotic pressure of polysaccharide solutions by molecular simulations, J. Chem. Theory Comput., 2016, 12(9), 4375–4384 CrossRef CAS PubMed.
- R. J. Woods, Predicting the structures of glycans, glycoproteins, and their complexes, Chem. Rev., 2018, 118(17), 8005–8024 CrossRef CAS PubMed.
- R. W. Hockney, Potential calculation and some applications, Methods Comput. Phys., 1970, 9, 135–211 Search PubMed.
- G. Bussi, D. Donadio and M. Parrinello, Canonical sampling through velocity rescaling, J. Chem. Phys., 2007, 126(1), 014101 CrossRef PubMed.
- M. Parrinello and A. Rahman, Polymorphic transitions in single-crystals – A new molecular-dynamics method, J. Appl. Phys., 1981, 52(12), 7182–7190 CrossRef CAS.
- S. Pall and B. Hess, A flexible algorithm for calculating pair interactions on SIMD architectures, Comput. Phys. Commun., 2013, 184(12), 2641–2650 CrossRef CAS.
- U. Essmann, et al., A smooth particle mesh Ewald method, J. Chem. Phys., 1995, 103(19), 8577–8593 CrossRef CAS.
- J.-P. Ryckaert, G. Ciccotti and H. J. C. Berendsen, Numerical integration of the cartesian equations of motion of a system with constraints: Molecular dynamics of n-alkanes, J. Comput. Phys., 1977, 23(3), 327–341 CrossRef CAS.
- R. Danne, et al., doGlycans-tools for preparing carbohydrate structures for atomistic simulations of glycoproteins, glycolipids, and carbohydrate polymers for GROMACS, J. Chem. Inf. Model., 2017, 57(10), 2401–2406 CrossRef CAS PubMed.
- A. Turupcu and C. Oostenbrink, Modeling of oligosaccharides within glycoproteins from free-energy landscapes, J. Chem. Inf. Model., 2017, 57, 2222–2236 CrossRef CAS PubMed.
- R. G. Weiß, et al., Volume-scaled common nearest neighbor clustering algorithm with free-energy hierarchy, J. Chem. Phys., 2021, 154, 084106 CrossRef PubMed.
- B. G. Keller, X. Daura and W. F. van Gunsteren, Comparing geometric and kinetic cluster algorithms for molecular simulation data, J. Chem. Phys., 2010, 132(7), 074110 CrossRef PubMed.
- O. Lemke and B. G. Keller, Density-based cluster algorithms for the identification of core sets, J. Chem. Phys., 2016, 145(16), 164104 CrossRef PubMed.
- O. Lemke and B. G. Keller, Common nearest neighbor clustering – A benchmark, Algorithms, 2018, 11(2), 19 CrossRef.
- A. Shrake and J. A. Rupley, Environment and exposure to solvent of protein atoms – Lysozyme and insulin, J. Mol. Biol., 1973, 79(2), 351–371 CrossRef CAS PubMed.
- R. T. McGibbon, et al., MDTraj: A modern open library for the analysis of molecular dynamics trajectories, Biophys. J., 2015, 109(8), 1528–1532 CrossRef CAS PubMed.
- K. W. Moremen, et al., Expression system for structural and functional studies of human glycosylation enzymes, Nat. Chem. Biol., 2017, 156–162 Search PubMed.
- J. M. H. van den Elsen, D. A. Kuntz and D. R. Rose, Structure of Golgi α-mannosidase II: a target for inhibition of growth and metastasis of cancer cells, EMBO J., 2001, 20(12), 3008 CrossRef CAS PubMed.
- C. Geisler and D. L. Jarvis, Substrate specificities and intracellular distributions of three N-glycan processing enzymes functioning at a key branch point in the insect N-glycosylation pathway, J. Biol. Chem., 2012, 287(10), 7084–7097 CrossRef CAS PubMed.
- J. R. Wiśniewski, et al., Universal sample preparation method for proteome analysis, Nat. Methods, 2009, 6, 359 CrossRef PubMed.
- K. Poljak, et al., Quantitative profiling of N-linked glycosylation machinery in yeast Saccharomyces cerevisiae, Mol. Cell. Proteomics, 2018, 17(1), 32–44 CrossRef PubMed.
- P. Kuzmič, Program DYNAFIT for the analysis of enzyme kinetic data: Application to HIV proteinase, Anal. Biochem., 1996, 237(2), 260–273 CrossRef PubMed.
- F. Schmid, Spectroscopic techniques to study protein folding and stability, Protein Folding Handb., 2005, 22–44 CAS.
Footnotes |
| † Electronic supplementary information (ESI) available. See DOI: 10.1039/d1cb00019e |
| ‡ Shared first author. |
| This journal is © The Royal Society of Chemistry 2021 |