A study of microbially fabricated bio-conjugated quantum dots for pico-molar sensing of H2O2 and glucose†
Reddhy
Mahle‡
a,
Debabrata
Mandal‡
b,
Partha
Kumbhakar
c,
Amreesh
Chandra
d,
Chandra Sekhar
Tiwary
 *c and
Rintu
Banerjee
 *a
*a
aAgricultural and Food Engineering Department, Indian Institute of Technology Kharagpur, India. E-mail: rb@iitkgp.ac.in
bSchool of Nanoscience and technology, Indian Institute of Technology Kharagpur, West Bengal, India-721302
cDepartment of Metallurgical and Materials Engineering, Indian Institute of Technology Kharagpur, India
dDepartment of Physics, Indian Institute of Technology Kharagpur, West Bengal, India-721302
First published on 21st October 2020
Abstract
Quantum dots (QDs) as bio-detectors have been intensively explored owing to their size dependent optical properties and are still envisioned to be used in a plethora of biomedical and healthcare areas. However, the medical application of the biosensors demands the ultrasensitive detection of the analytes, which is usually limited for the conventional methods of colorimetric and fluorescence detection. The Fluorescence Resonance Energy Transfer (FRET) process, exploited by QDs, translates the close association between the analyte and the detector into optical properties and thus promises the effective detection of biomolecules. FRET based detection systems for biomolecules utilize surface-functionalized QDs which are usually modified post production using different organic groups. In this work, a novel protocol was formulated to produce bio-functionalized QDs with controlled chemical and optical characteristics. Here, we demonstrate the first-ever biological green synthesis of MoS2 QDs using Pseudomonas aeruginosa. The bio-functionalized QDs show green luminescence with a quantum yield of 42%, supporting their application as an optical sensor. These QDs are utilized to detect the pico-molar concentration of glucose, which makes them ideal for early diabetes detection and many biomedical applications. Also, the ability to sense pico-molar levels of H2O2 opens the path for its utilization in apprehending the plant signaling pathways under stress conditions.
1. Introduction
Glucose sensing remains an important research area as its excess, as well as deficiency, has serious consequences on human health. Its accurate detection has a large number of applications and drives multi-billion dollar biomedical industries.1,2 The future of highly selective wearable glucose biosensors depends on making them economically viable with a high level of reproducibility and mechanical and thermal stability.3 Along with glucose, hydrogen peroxide (H2O2) is also a naturally occurring by-product of glucose oxidation in cells, and it can easily damage the cells which is a major risk to human health. By the Fenton reaction, due to the generation of hydroxyl radicals (HO˙) and unbalanced state of glucose, it can lead to health problems such as cytotoxicity, hypoglycemia, hyperglycemia, etc. Therefore, the quantitative determination of H2O2 and glucose contents in biological samples and human blood is being extensively investigated. Few detection methods that are being widely used are optical sensing, colorimetry, fluorescence, etc.4–6The development of sensitive and selective biosensors is the crux of basic biomedical and clinical diagnosis. QDs, photoluminescent semiconductor nanocrystals, as a result of their tunable optical and physical properties offer superior biosensing over conventional methods.7,8 QDs exhibit a high quantum yield (QY), symmetric photoluminescence, and a large Stokes shift which makes them effective probes in medical applications.9 For detecting biomolecules, plenty of QD surface modification strategies are practiced which include lipid encapsulation and organic-ligand exchange.10 The surface modification allows the functionalization of the QD surface which promotes the formation of dangling bonds. The surface bonds conjugate with particular biomolecules, facilitating their detection by translating the binding to changes in the optical or physical properties of QDs. The coupling of biomolecules to the QD surface is achieved through covalent or non-covalent methods that activate or incorporate functional groups on QDs.7 The surface groups are activated post QD synthesis via small ligand exchange, polymer or lipid encapsulation, and biomolecule conjugation of QDs. However, the biological synthesis of QDs circumvents the post-synthesis surface modification and attains surface groups during QD formation. Microbially reinforced fabrication of QDs is hypothesized to be a facile route to achieve biofunctionalized QDs.
MoS2 QDs are reported for their use as glucose sensors via glucosidase coupling to the QDs.11 Non-enzymatic detection of glucose requires the binding of the molecules to the prepared materials, which is inevitably restricted by the chemicals and thermal-based methods of MoS2 synthesis.12–14 Similarly, during signal transduction in plants, H2O2 oxidizes the cysteine based receptors and hence shows an affinity for MoS2 QDs.15 Microbially synthesized QDs have been hypothesized to manifest a non-mediator based detection system for H2O2 signaling molecules. This will make them useful for understanding the ROS signaling in stressed plants. To date, several studies have been carried out where MoS2 QDs act as sensing elements for glucose and H2O2. However, these studies do not demonstrate high sensitivities.
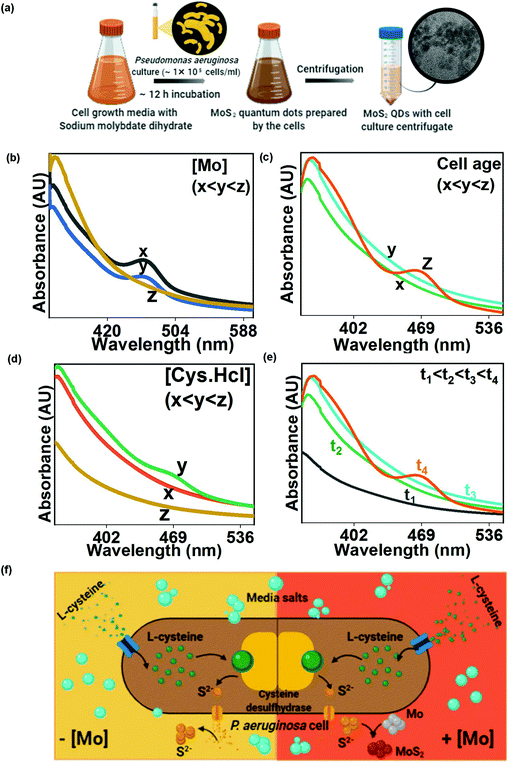
In the current work, we demonstrate the extracellular synthesis of monodisperse bio-functionalized MoS2 QDs, which was carried out by a facultative anaerobe Pseudomonas aeruginosa (as shown in Fig. 1(a)). Here, the optical response of bio-functionalized MoS2 QDs, in the presence of glucose and H2O2, was investigated using the resonance energy transfer mechanism. The bio-based system of QD production required sodium molybdate dihydrate as the Mo source while L-cysteine hydrochloride was utilized by the bacterial cells to produce sulphide.
2. Experimental section
2.1 Bio-synthesis of MoS2 QDs
Molybdenum tolerance of Pseudomonas aeruginosa was estimated by adding molybdenum to the cell culture in a concentration of 0.5–10 mM. Samples were withdrawn after 24 h and analyzed for cell viability and cell growth. Controls were also prepared with no molybdenum addition. The optimized Mo concentration was used for MoS2 QD synthesis. During the experiment, cysteine supplemented actively growing P. aeruginosa cells (growth and culture conditions in the ESI†) were inoculated with 1 mM Na2MoO4. A reddish-brown culture was obtained within 12 hours. The culture was centrifuged at 8000 rpm for 10 min and the supernatant was collected. The impact of the growth parameters and precursor concentration on MoS2 optical properties was also estimated. The impact of cell age on MoS2 formation was established by recording the absorption spectrum of the growth culture at each phase of cell growth. The effect of the sulphur source i.e. cysteine concentration on MoS2 production was measured by recording UV spectra when the cells were grown in the media with a gradient concentration of cysteine i.e. 0.01–0.5%. Time-regulated MoS2 synthesis was evaluated by recording the absorption spectra at different time intervals post culture inoculation to Mo containing media.2.2 Characterization of the microbially prepared MoS2 QDs
The bio-manufactured MoS2 QDs were characterized using powder X-Ray Diffraction (XRD) with monochromatic nickel filtered Cu Kα radiation in the 2θ range of 20 to 80°. The FTIR analysis of MoS2 QDs was carried out using a PerkinElmer spectrometer in the range of 4000 to 400 cm−1. The as-prepared QDs were imaged using a JEOL 2200FS electron microscope and the samples were prepared onto a thin film of amorphous carbon supported by a copper grid. QDs were observed using Atomic Force Microscopy (AFM, Agilent Technologies, USA, Model 5100) where cells were dried on a glass substrate and scanned to obtain high-resolution micrographs of the cells with QDs. All the measurements were carried out in air at room temperature (25° C) using a silicon nitride tip (PPP-NCL) in the intermittent contact mode. The Raman spectra of MoS2 QDs were acquired with an excitation wavelength of 532 nm (Witec UHTS 300). The chemical composition of MoS2 QDs was studied by using X-ray photoelectron spectroscopy (PHI 5000 Versa Probe II, ULVAC-PHI, Inc., Japan) with an incident Al Kα X-ray energy of hν = 1486.6 eV. To study the optical characterization of MoS2 QDs, UV-absorbance spectra of the MoS2 QDs and cell culture media were obtained on a UV-1800 spectrophotometer, SHIMADZU, Japan. The band gap was estimated using Tauc plots generated from the absorption spectra with the assumption of a direct bandgap for MoS2. The emission spectra, collected using a Xenon lamp (450 watt) with a monochromator (Gemini 180), were used to measure QDs' PL spectra at room temperature. The PL data were recorded using a CCD detector (Hamamatsu), conjugated with a monochromator (Horiba Jobin-Y von iHR30).3 Results and discussion
3.1 Biosynthesis of MoS2 QDs
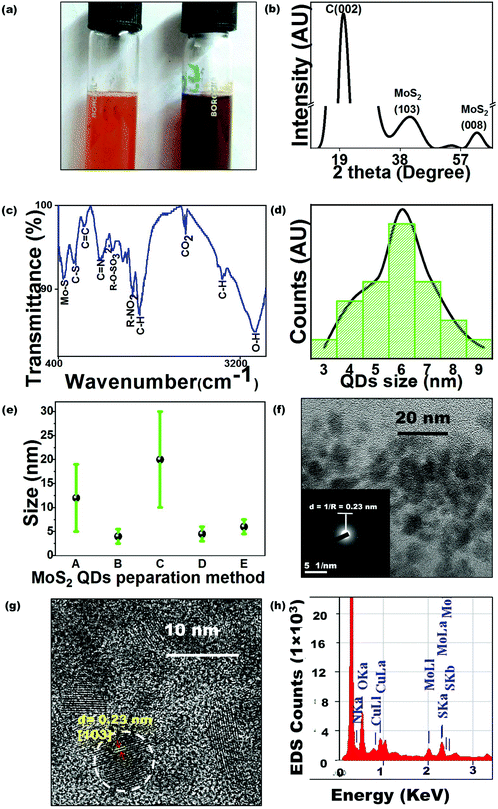
As this is the first-ever report of MoS2 QD synthesis by bacteria, the study requires to comprehend every mode of interaction between molybdate salt and the bacterial cell to establish an optimized protocol. There are reports regarding the bactericidal performance of MoS2,16 and hence the effect of the excess to optimized metal ion concentration on P. aeruginosa cells needed to be probed. Sodium molybdate dihydrate salt solution (0.5–10 mM) was added to P. aeruginosa cells to estimate the tolerance threshold. Generally, molybdenum is transported into the bacterial cells to regulate enzyme synthesis but at higher concentrations, it inhibits the sulfate reduction process which makes it toxic to cells. Cells have been observed to reduce toxic Mo4+ to insoluble MoS2.17 In the present study, the remediation method, carried out by using Pseudomonas, has been hypothesized to involve extracellular cell wall binding, confirmed by the reduction of molybdenum ions into MoS2 QDs in the growth media. Here, no molybdenum toxicity was observed for up to 6 mM molybdate concentration (Table S1†). The effect of molybdenum concentration on MoS2 formation has been demonstrated by plotting absorption versus Mo concentration (Fig. 1(b)). Increasing the molybdenum salt concentration more than the threshold value (≥5 mM) leads to the absence of a peak at 460 nm in the spectra, indicating no QD formation. During MoS2 synthesis, 1 mM Na2MoO4 was inoculated to the cells and the bacterial colonies were found to remove 85% of the molybdenum from the media (Table S2†) in the form of brown-colored colloids identified as MoS2 QDs (Fig. 2(a)). The biological quenching of the salt was typically fathomed out by quantifying the effect of the cell growth parameters and substrates on MoS2 formation. The influence of the cell growth phase on the UV-Vis spectrum of the culture is shown in Fig. 1(c). It is clear from the curve that MoS2 QDs commenced from the late log phase (∼7–8 h) of bacterial growth, manifested by an absorption peak at 460 nm. Cysteine, the sulphur source, has been found to directly impact MoS2 formation and this impact has been determined by preparing experimental media with varying concentrations (0.05–0.6 (w/v %)) of the Cys·HCl (shown in Fig. 1(d)).There was a predictable MoS2 QD formation on increasing cysteine concentration. However, the accelerated amount of cysteine had adverse effects on P. aeruginosa due to cysteine toxicity which has resulted in limited cell growth and consequently less MoS2 formation.18 The absorption spectra of the cells were recorded at different time intervals 0 h, 1 h, 3 h, and 9 h after Mo addition. From the spectra in Fig. 1(e), the characteristic absorption peak was found to occur at ∼9 h beyond which there was no further change in the absorption pattern. The occurrence of the other peak at 460 nm with increasing time indicated the formation of MoS2 QDs with a sizeable lateral dimension. The plausible mechanism of MoS2 QD formation is shown in Fig. 1(f) as validated and suggested by the spectra and other optimization experiments.
3.2 Physical and optical characterization study of the prepared MoS2 QDs
The crystal structure of the prepared QDs was analyzed using XRD (shown in Fig. 2(b)). The peaks at 39.5° and 62°, corresponding to the (103) and (008) planes of MoS2, were observed (JCPDF no.: 37-1492). The intense peak at ∼20° could be attributed to the carbon in the organic molecules present in the bacterial culture. The surface functional groups of MoS2 QDs were studied using FTIR measurements (shown in Fig. 2(c)). The peak at 3443 cm−1 can be ascribed to the O–H stretching bond present as absorbed water on the MoS2 surface. Weak peaks which were observed at 465 cm−1 and 650 cm−1 signified the Mo–S vibrations19 and C–S stretching bonds respectively whereas peaks at 1237 and 2353 cm−1 are assigned to the organic sulphate group and CO2 respectively.20 The presence of functional groups can be attributed to the media components and cell metabolites produced and released during bacterial growth.The surface modification due to organic groups, –OH, –NO2, –SO2, and sulphur bonds, renders the prepared QDs promising for extremely sensitive biosensing and enhances their affinity for biomolecules such as glucose. The particle size distribution of the MoS2 QDs, as measured from the TEM image (Fig. 2(f)), revealed the monodispersity of the QDs (shown in Fig. 2(d)). Further, MoS2 size distribution, obtained for the current study, was compared with the dispersity achieved by the other methods of MoS2 QD preparation (Fig. 2(e)).21–24 From the bar chart, it can be inferred that the present method can be successfully utilized in producing small-sized MoS2 QDs. The size distribution of the prepared QDs is impacted by the presence of biological entities on their surface which further reinforces ligand detection. The formation of crystalline MoS2 QDs is further confirmed using Selected Area Electron Diffraction (SAED) patterns (inset Fig. 2(f)) showing a concentric circle, which is in parity with (103) reflection of MoS2. The HRTEM image of the MoS2 QDs, in Fig. 2(g), showed well-resolved lattice fringes, which implied a highly crystalline nature of the QDs. The lattice spacing value obtained from HRTEM was 2.3 Å, which corresponds to the (103) lattice plane of MoS2.25 The EDX spectrum demonstrated the expected Mo and S peaks (Fig. 2(h)).
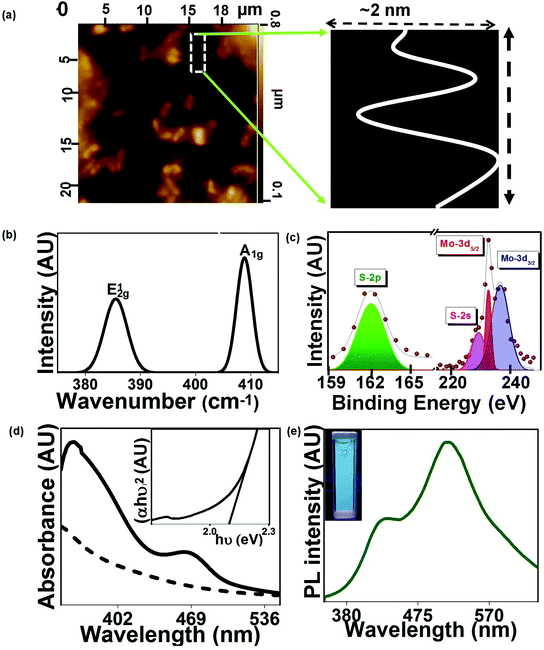
In the current study, the as-prepared MoS2 QDs were visualized using AFM. The obtained surface roughness profile is shown in Fig. 3(a). The thickness of MoS2 QDs was ∼2 nm, suggesting the formation of few-layered QDs, which is well consistent with the high-resolution TEM images. To further confirm the formation of layered MoS2 QDs, the Raman spectrum of the sample was obtained and is shown in Fig. 3(b). The spectrum revealed two prominent Raman peaks at 385 cm−1 and 409 cm−1 referring to E12g (in-plane vibrations of the Mo–S bond) and A1g (out of plane vibrations of S atoms) modes, respectively. The E12g and A1g modes of vibrations in the as-prepared MoS2 QDs had a blue and red shift of 1 cm−1 respectively as compared to bulk MoS2 (E12g and A1g modes of vibrations at 484 and 410 cm−1).
It caused a reduction in the frequency difference between two peaks, indicating the mitigation in the number of layers for the microbially produced MoS2 QDs.26 The surface states and compositions of resultant MoS2 QDs were confirmed by the X-ray photoelectron spectroscopy (XPS) measurement. In Fig. 2(c), the corresponding peaks of Mo4+ 3d5/2 at 229.3 eV and Mo4+ 3d3/2 at 232.6 eV confirm the formation of MoS2 QDs. The S 2p peak shows a doublet due to S 2p1/2 (163.5 eV) and S 2p3/2 (162.4 eV) electrons. The S 2p spectrum is fitted by using a Gaussian–Lorentzian function after baseline correction. UV-visible absorption spectroscopy was utilized to investigate the optical absorption properties of MoS2 QDs. The bulk MoS2 produces the characteristic absorption peaks at 340, 430, 590, and 650 nm where the direct transition from the valence band to the conduction band is ascribed to the peaks at 340 and 430 nm.27 In the case of the as-prepared MoS2 QDs, the peaks were obtained at ∼360 and 460 nm as compared to the UV-Vis spectrum of the bacterial culture (Fig. 3(d)). The optical bandgap of the as-prepared MoS2 QDs was found to be ∼2.0 eV, calculated by using the Tauc plot (Fig. 3(d), inset), which is significantly higher than that of bulk MoS2 (1.2 eV) which is due to the quantum confinement effect.28 The Photoluminescence (PL) emission spectrum of the synthesized MoS2 QDs was also measured and is shown in Fig. 3(e). It showed strong emission bands at 430 and 515 nm. A digital photograph of the aqueous solution of MoS2 QDs under 365 nm excitation further confirmed the strong green emission of the sample (inset of Fig. 3(e)). The calculated PL quantum yield (QY) of the sample was found to be 46% (details in the ESI†), which further confirmed the quantum confinement effect of QDs. The PL emission band around 530 nm is attributed to the surface passivation effect of the MoS2 QDs and the presence of surface dangling bonds and functional groups which actively contribute to the electron transfer process. Furthermore, we have observed another PL emission band at ∼420 nm. This could be linked to the presence of the carbon structure originating during the biological synthesis process of MoS2 QDs.
3.3 Bio-synthesized MoS2 QDs as a H2O2 and glucose sensor
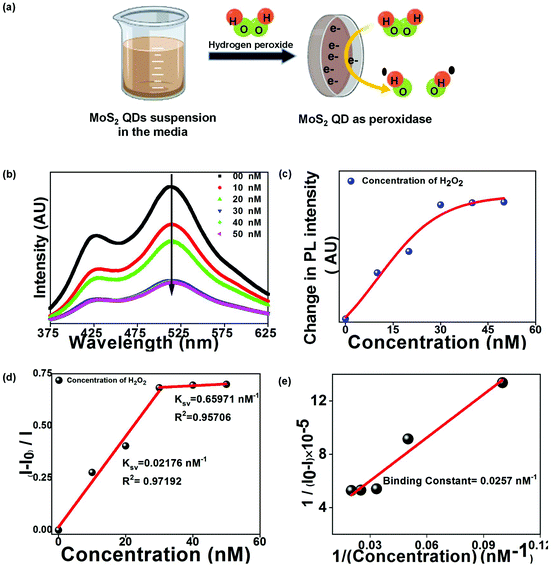
The green PL emission of the functionalized QDs motivated us to use this material as an optical biosensor for detecting H2O2 and glucose molecules. MoS2 QDs exhibit peroxidase-like activity and thus catalyze the decomposition of peroxides into OH radicals,29 as shown in Fig. 4(a). The enzymatic non-mediator based process requires a proximal distance between MoS2 QDs (sensor) and H2O2 (analyte), allowing it to be interpreted by the FRET process, involving molecular interaction between the donor and acceptor.30 The FRET process was examined experimentally by measuring the quenching of the PL intensity of MoS2 QDs with increasing concentration of H2O2, as shown in Fig. 4(b). The surface of the MoS2 QDs was bio-functionalized during the biosynthesis process to bring electrostatic interactions with H2O2 and achieve a strong donor–acceptor complex formation. The electrostatic attraction was created by the surface charge difference between MoS2 QDs and H2O2, which would have resulted in a high bimolecular quenching constant and confirms a strong ground state interaction between the donor and acceptor QDs. To confirm the electrostatic interaction, we have measured the zeta potential of MoS2 QDs after and before the addition of H2O2, at pH 7. We have found that the value of zeta potential reduced from −24 mV to −15.6 mV after the addition of 10 nM H2O2. It was further validated by the spectral overlap between the absorption spectrum of the analyte i.e. energy acceptor (H2O2) and emission spectrum of the sensor i.e. the energy donor (MoS2 QDs) (Fig. S2(a)†). We have also calculated the overlap integral value (for more details, see ESI†) for H2O2 to be 2.40 × 10⁹ M−1 cm−1 nm4. As depicted in Fig. 4(c), there was a reduction in the PL intensity, upon increasing H2O2 concentration. This can be attributed to the change of MoS2 fluorescence caused by H2O2 molecules and energy transfer from MoS2 to H2O2.To further support the binding of H2O2 with MoS2 QDs, UV-Vis absorption spectra for H2O2 suspensions in MoS2 QDs with concentrations of 10, 20, and 50 nM were collected. The prominent shift in the UV-Vis absorption peaks was noted upon decreasing H2O2 concentration (Fig. S2(b)†). The blue-shift and apparent decrease in the absorption peak confirmed the binding of H2O2 on the surface of MoS2 QDs or its breaking into OH˙ radicals. The capability of the analytical system for H2O2 sensing was evaluated by varying the concentration of H2O2 in the MOS2 QD suspension. The relationship between the H2O2 concentration and PL intensity indicated a linear relationship in the concentration with two linear ranges 0 to 30 nM and 30 nM to 50 nM, as shown in Fig. 4(d). The PL quenching of MOS2 QDs with H2O2 was investigated using the Stern–Volmer (SV) plot graphically representing the equation
 | (1) |
 | (2) |
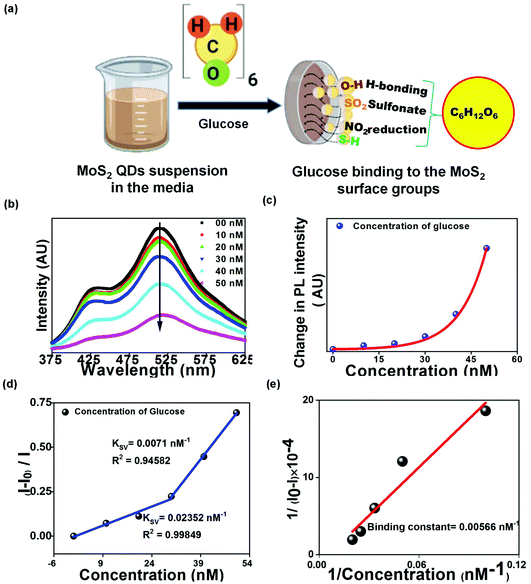
Ordinarily, glucose detection by QDs requires the enzyme conjugation, where QDs couple with glucose oxidase to break down glucose molecules into gluconic acid and H2O2.34 For the present method, owing to the favorable synthesis protocols of the biocompatible QDs, glucose molecules could bind to the surface groups present on the QDs (from the FTIR spectrum given in Fig. 2(c)). The glucose has been hypothesized to bind to either surface hydroxyl or nitro groups or the glucose binding proteins present on MoS2 QDs, as shown in Fig. 5(a). The overlap between the absorption spectrum of glucose and the PL emission spectrum of MoS2 QDs confirmed the FRET between glucose and MoS2 QDs (Fig. S3(a)†). We have also calculated the overlap integral (for more details, see ESI†) values for glucose to be 4.11 × 10⁹ M−1 cm−1 nm4. The PL emission intensity of MoS2 QDs was found to decrease as a result of glucose addition, and the change in the PL emission intensity is shown in Fig. 5(b) and (c). A change in the UV Vis spectra of glucose, with a characteristic peak at 270 nm, was observed upon MoS2 QD addition with different concentrations (Fig. S3(b)†). There was an apparent decrease in the absorption peak, which validated glucose binding or complex formation with MoS2 surface bonds. Additionally, there was a slight increment in the PL intensity up to a glucose concentration of 30 nM, which was followed by an exponential rise until 50 nM (Fig. 5(d)). This can only happen if both static and dynamic PL quenching occur simultaneously.
The PL emission intensity of glucose with MoS2 QDs was also studied using the SV equation. This indicated two linear behaviors. The data could be fitted using the SV equation with a detection limit of 2 pM, a correlation coefficient of 0.99849, and a Stern–Volmer quenching constant of 0.02352 nM−1 in the 0 to 30 nM linear range. Other fitted data shown a linear range 30 to 50 nM with a detection limit of 68 pM, a correlation coefficient of 0.94582, and a Stern–Volmer quenching constant of 0.00710 nM−1 (Fig. 5(d)), which makes the sensing system highly sensitive as compared to previously used methods(Table S4 and Fig. S4(b)†).35–37 The binding constant of the glucose with MoS2 QDs was 0.00566 nM−1, which was calculated by the Benesi–Hildebrand method, as shown in Fig. 5(e).
The FRET efficiency (E) of the system for H2O2 and glucose sensing by MoS2 QDs was calculated using the equation given below
 | (3) |
The stability of the microbially produced bio-conjugated MoS2 QDs was examined by studying their QY for two months i.e. 60 days (see Fig. S7(b)†) with a comparative plot demonstrating the QY (%) for different methods of MoS2 QD preparation38–42 (Fig. S7(a)†). The stability of the biologically prepared QDs can be attributed to the presence of protein molecules in the growth media which prevent their aggregation and allow them to stay stable for an effective period.43
4. Conclusions
In summary, we developed a strategy to fabricate surface-functionalized MoS2 QDs utilizing a sulphide producing facultative anaerobe Pseudomonas aeruginosa. Pseudomonas aeruginosa was selected from a set of cysteine metabolizing bacteria with diverse functions and found to be affirmatively involved in the biological production of MoS2 QDs. This is attributed to changes in pathways involved in cysteine metabolism in P. aeruginosa in comparison to others. The organic surface bonds on MoS2 QDs, detected by FTIR, are impacted by media and bacterial growth components. Similarly, the optical property of the QDs was also influenced by the precursor concentration and cell growth phase. The surface organic groups reinforced the ultra-low detection of glucose and H2O2via promoting the reaction affinity between the QDs and analytes. From the results, few-layered approximately 6 nm MoS2 QDs with a bandgap of ∼2 eV and a quantum yield of 40% achieved a LOD value of 2 pM and 43 pM in the linear range 0–30 nM for glucose and H2O2 respectively. The amenability of the method allows the tailoring of the process to engineer new materials for advanced applications in biological and medicinal areas.Conflicts of interest
There are no conflicts to declare.Acknowledgements
The authors acknowledge the Central Research Facility of the Indian Institute of Technology, Kharagpur, for providing high-end instruments required in the sample analysis.References
- M. S. Hossain, Y. Oomura, T. Fujino and K. Akashi, Neurosci. Biobehav. Rev., 2020, 110, 100–113 CrossRef CAS.
- X. Hu, J. Yu, C. Qian, Y. Lu, A. R. Kahkoska, Z. Xie, X. Jing, J. B. Buse and Z. Gu, ACS Nano, 2017, 11, 613–620 CrossRef CAS.
- G. Li and D. Wen, J. Mater. Chem. B, 2020, 8, 3423 CAS.
- J. Yuan, Y. Cen, X. J. Kong, S. Wu, C. L. Liu, R. Q. Yu and X. Chu, ACS Appl. Mater. Interfaces, 2015, 7, 10548–10555 CrossRef CAS.
- B. Liu, Z. Sun, P. J. J. Huang and J. Liu, J. Am. Chem. Soc., 2015, 3, 1290–1295 CrossRef.
- T. Hu, K. Xu, S. Qiu, Y. Han, J. Chen, J. Xu, K. Chen, Z. Sun, H. Yi and Z. Ni, J. Mater. Chem. B, 2020, 8, 7160–7165 RSC.
- H. Zhu, L. Li, W. Zhou, Z. Shao and X. Chen, J. Mater. Chem. B, 2016, 4, 7333 RSC.
- C. Liao, M. Zhang, L. Niu, Z. Zheng and F. Yan, J. Mater. Chem. B, 2013, 1, 3820 RSC.
- Y. Park, S. Jeong and S. Kim, J. Photochem. Photobiol., C, 2017, 30, 51–70 CrossRef CAS.
- I. L. Medintz, H. T. Uyeda, E. R. Goldman and H. Mattoussi, Nat. Mater., 2005, 4, 435–436 CrossRef CAS.
- J. Tang, Y. Wang, J. Li, P. Da, J. Geng and G. Zheng, J. Mater. Chem. A, 2014, 2, 6153–6157 RSC.
- D. Gopalakrishnan, D. Damien and M. M. Shaijumon, ACS Nano, 2014, 8, 5297–5303 CrossRef CAS.
- S. Chandrasekaran, L. Yao, L. Deng, C. Bowen, Y. Zhang, S. Chen, Z. Lin, F. Peng and P. Zhang, Chem. Soc. Rev., 2019, 48, 4178–4280 RSC.
- C. Tan and H. Zhang, Chem. Soc. Rev., 2015, 44, 2713–2731 RSC.
- N. Smirnoff and D. Arnaud, New Phytol., 2019, 221, 1197–1214 CrossRef CAS.
- C. Liu, D. Kong, P. C. Hsu, H. Yuan, H. W. Lee, Y. Liu, H. Wang, S. Wang, K. Yan, D. Lin, P. A. Maraccini, K. M. Parker, A. B. Boehm and Y. Cui, Nat. Nanotechnol., 2016, 11, 1098–1104 CrossRef CAS.
- K. C. Biswas, N. A. Woodards, H. Xu and L. L. Barton, BioMetals, 2009, 22, 131–139 CrossRef CAS.
- S. Park and J. A. Imlay, J. Bacteriol., 2003, 185, 1942–1950 CrossRef CAS.
- L. Li, Z. Guo, S. Wang, D. Li, X. Hou, F. Wang, Y. Yang and X. Yang, Anal. Methods, 2019, 11, 3307–3313 RSC.
- M. Sanati and A. Andersson, J. Mol. Catal., 1993, 81, 51–62 CrossRef CAS.
- J. Etzkorn, H. A. Therese, F. Rocker, N. Zink, U. Kolb and W. Tremel, Adv. Mater., 2005, 17, 2372–2375 CrossRef CAS.
- X. Ren, L. Pang, Y. Zhang, X. Ren, H. Fan and S. Liu, J. Mater. Chem. A, 2015, 3, 10693–10697 RSC.
- S. Marqus, H. Ahmed, M. Ahmed, C. Xu, A. R. Rezk and L. Y. Yeo, ACS Appl. Nano Mater., 2018, 1, 2503–2508 CrossRef CAS.
- X. Ren, Q. Wei, P. Ren, Y. Wang and Y. Peng, Opt. Mater., 2018, 86, 62–65 CrossRef CAS.
- J. Z. Ou, A. F. Chrimes, Y. Wang, S. Y. Tang, M. S. Strano and K. Kalantar-Zadeh, Nano Lett., 2014, 14, 857–863 CrossRef CAS.
- H. Li, Q. Zhang, C. C. R. Yap, B. K. Tay, T. H. T. Edwin, A. Olivier and D. Baillargeat, Adv. Funct. Mater., 2012, 22, 1385–1390 CrossRef CAS.
- P. Joo, K. Jo, G. Ahn, D. Voiry, H. Y. Jeong, S. Ryu, M. Chhowalla and B. S. Kim, Nano Lett., 2014, 14, 6456–6462 CrossRef CAS.
- J. Mann, Q. Ma, P. M. Odenthal, M. Isarraraz, D. Le, E. Preciado, D. Barroso, K. Yamaguchi, G. von Son Palacio, A. Nguyen, T. Tran, M. Wurch, A. Nguyen, V. Klee, S. Bobek, D. Sun, T. F. Heinz, T. S. Rahman, R. Kawakami and L. Bartels, Adv. Mater., 2014, 26, 1399–1404 CrossRef CAS.
- W. Yin, J. Yu, F. Lv, L. Yan, L. R. Zheng, Z. Gu and Y. Zhao, ACS Nano, 2016, 10, 11000–11011 CrossRef CAS.
- D. E. Prasuhn, A. Feltz, J. B. Blanco-Canosa, K. Susumu, M. H. Stewart, B. C. Mei, A. V. Yakovlev, C. Loukov, J. M. Mallet, M. Oheim, P. E. Dawson and I. L. Medintz, ACS Nano, 2010, 4, 5487–5497 CrossRef CAS.
- T. Wang, H. Zhu, J. Zhuo, Z. Zhu, P. Papakonstantinou, G. Lubarsky, J. Lin and M. Li, Anal. Chem., 2013, 85, 10289–10295 CrossRef CAS.
- T. Zhang, Y. Gu, C. Li, X. Yan, N. Lu, H. Liu, Z. Zhang and H. Zhang, ACS Appl. Mater. Interfaces, 2017, 9, 37991–37999 CrossRef CAS.
- M. H. Irani-nezhad, A. Khataee, J. Hassanzadeh and Y. Orooji, Molecules, 2019, 24, 689 CrossRef CAS.
- X. Li, Y. Zhou, Z. Zheng, X. Yue, Z. Dai, S. Liu and Z. Tang, Langmuir, 2009, 25, 6580–6586 CrossRef CAS.
- Y. Miao, Sens. Biosensing Res., 2015, 5, 112–116 CrossRef.
- H. Maaoui, F. Teodoresu, Q. Wang, G. H. Pan, A. Addad, R. Chtourou, S. Szunerits and R. Boukherroub, Sensors, 2016, 16, 1720 CrossRef.
- X. Shan, L. Chai, J. Ma, Z. Qian, J. Chen and H. Feng, Analyst, 2014, 139, 2322–2325 RSC.
- H. Lin, C. Wang, J. Wu, Z. Xu, Y. Huang and C. Zhang, New J. Chem., 2015, 39, 8492–8497 RSC.
- J. Y. Wu, X. Y. Zhang, X. D. Ma, Y. P. Qiu and T. Zhang, RSC Adv., 2015, 5, 95178–95182 RSC.
- Y. Li, X. Wang, M. Liu, H. Luo, L. Deng, L. Huang, S. Wei, C. Zhou and Y. Xu, Nanomaterials, 2019, 9, 906 CrossRef CAS.
- D. Haldar, A. Ghosh, S. Bose, S. Mondal, U. K. Ghorai and S. K. Saha, Opt. Mater., 2018, 79, 12–20 CrossRef CAS.
- X. Li, D. W. He, Y. S. Wang, Y. Hu, X. Zhao, C. Fu and J. Y. Wu, Chin. Phys. B, 2018, 27, 56104 CrossRef.
- A. Ahmad, P. Mukherjee, D. Mandal, S. Senapati, M. I. Khan, R. Kumar and M. Sastry, J. Am. Chem. Soc., 2002, 124, 12108–12109 CrossRef CAS.
Footnotes |
| † Electronic supplementary information (ESI) available. See DOI: 10.1039/d0bm01206h |
| ‡ These authors contributed equally. |
| This journal is © The Royal Society of Chemistry 2021 |

