DOI:
10.1039/D0BM00991A
(Paper)
Biomater. Sci., 2021,
9, 148-156
Liquid exfoliated biocompatible WS2@BSA nanosheets with enhanced theranostic capacity†
Received
16th June 2020
, Accepted 20th August 2020
First published on 26th August 2020
Abstract
Ultrathin transition metal dichalcogenides (TMDs) seem to have a promising future in the field of theranostic agents due to their excellent near-infrared light absorption capacity and large specific surface area. Plenty of previous studies focused on the therapeutic effects of the materials, but were less concerned with the detailed studies of biocompatibility for clinical transformation. In this work, ultrathin WS2 nanosheets coated with bovine serum protein (BSA) (WS2@BSA NSs) were selected as experimental subjects with favorable biocompatibility to explore their potential as a theranostic agent. Firstly, ultrathin WS2 nanosheets were prepared by ultrasound-assisted exfoliation using n-methyl pyrrolidone (NMP) as the liquid phase, followed by coating with bovine serum protein. The physical and chemical properties of WS2@BSA NSs were investigated. Secondly, the biocompatibility experiments that are most relevant to clinical transformation were divided into cell level experiments and in vivo experiments with zebrafish as the model organism. Finally, to explore further applications for the diagnosis and treatment of tumors, the in vitro photothermal effect and the X-ray computed tomography (CT) imaging capability of WS2@BSA NSs were investigated. The obtained results were promising in terms of biocompatibility and theranostics, which suggested the potential of WS2@BSA NSs for use as a multifunctional theranostic agent in clinics.
Introduction
TMD nanomaterials are layered compounds composed of transition metal elements and sulfur group elements, such as molybdenum disulfide and tungsten disulfide. The structure of TMDs is similar to that of graphene which is connected by van der Waals force between every single layer.1 This special structure allows them to be easily exfoliated by mechanical forces to form single or a few layers of nanomaterials.2 The ultrathin physical structure gives the nanosheet unique properties compared to ordinary nanoparticles. At present, there have been a lot of studies on the application of electrical properties,3,4 optical properties,5,6 and mechanical properties7,8 of TMD nanomaterials. Of course, there are also many applications in nanotechnology assisted theranostics.9–11
Nanotechnology offers innumerous possibilities for cancer diagnosis and treatment, as well as many unique ideas for improving patient survival expectations. As a non-invasive and efficient tumor treatment method, photothermal therapy utilizes drugs with photothermal transformation ability to increase the temperature of the tumor site under the stimulation of a near-infrared laser, thus promoting tumor apoptosis.12 The TMD nanomaterial is a kind of material with excellent near-infrared light absorption capacity and converts light energy into heat energy through local surface plasmon resonance.13 From this perspective, ultra-thin TMD nanomaterials have the potential to be used as photothermal agents. In terms of tumor diagnosis, some TMD nanomaterials have the potential of auxiliary medical imaging, because some transition metals have strong X-ray attenuation ability.14,15 Through excellent in vivo circulation ability and the ability to accumulate in tumors, the X-ray attenuation ability of the tumor site is enhanced, and the resolution of the final imaging of the tumor area is greatly improved, which is significant for tumor diagnosis and clinical surgical assistance. It can be seen that TMD nanomaterials have great potential for use as theranostic agents. As one of the TMD materials, WS2 is cheap and easy to obtain and has the characteristics of TMD materials, so it is a good experimental material to study the properties of TMD materials.
Biocompatibility of the nanomaterials is the most important problem in clinical transformation of theranostic agents, but its detailed research strategies are less studied to some extent.16 Existing biocompatibility assessment methods are still in development and need to be tried out, which will determine the further application of theranostic agents.17 Zebrafish, as a model organism with a high homology with human genes, has been mainly applied in the fields of behavior,18,19 genetics20,21 and fluorescent probe development.22,23 Zebrafish have a number of advantages as model organisms, including small size, optical transparency, rapid growth and reproduction, and so on.24 Under these conditions, it will be very valuable to study zebrafish as an in vivo model to assess the biocompatibility of nanomaterials.25–27
Herein, we chose the WS2@BSA NSs as the research object to explore the potential of transition metal dichalcogenide nanomaterials to be transformed into theranostic agents. The WS2@BSA NSs were prepared by ultrasound-assisted liquid phase exfoliation. Then BSA was coated on the surface of WS2@BSA NSs to improve the biocompatibility. Biocompatibility as the most critical issue in clinical translation, not only had it testing at the cellular level, but it was also innovatively used zebrafish as a model organism to evaluate the influence of TMD nanomaterials on the hatch and growth of zebrafish embryos, which had rarely been seen in studies using zebrafish embryos to measure the toxicity of materials. Moreover, the photothermal transformation ability and photothermal therapy at the cellular level of WS2@BSA NSs were investigated. CT imaging of WS2@BSA NSs had also been explored.
Experimental section
Chemicals
Tungsten disulfide (WS2, AR, Energy chemical, China), N-methyl pyrrolidone (NMP, AR, Energy chemical, China), bovine serum albumin (BSA, 66.4 kDa, Sigma-Aldrich, America), dimethylsulfoxide (DMSO, Sigma-Aldrich, America), MTT assay (Beyotime Biotechnology, China), CCK-8 assay (Yeasen, China), a regenerated cellulose dialysis membrane (MWCO = 7000, Shanghai yuanye Bio-Technology Co., Ltd, China), and calcein-AM/PI (AR, Yeasen, China) were used.
Preparation of WS2@BSA NSs and composite materials
First, NMP was used as the liquid phase to strip the bulk tungsten disulfide into a single layer of tungsten disulfide. Briefly, 0.75 g WS2 powder was mixed with 100 mL NMP, and left overnight after 4 h of ultrasound for natural precipitation. The upper 3/4 supernatant was taken, put into a 250 mL flask, and stirred in an oil bath at 130 °C for 6 h. After the reaction, the flask was sealed, the solution was cooled naturally overnight, and the upper clear solution was taken after stratification to obtain the separated WS2 NS dispersion solution, and the organic solvent was removed after dialysis for 24 h. Then, two kinds of composite nanomaterials with WS2 NSs as the carrier were prepared. The WS2@BSA NSs were first prepared: 0.05 g of BSA was taken and dissolved in 50 mL deionized water (DI water), and 50 mL of the separated WS2 was added. At room temperature, the WS2@BSA NSs were obtained by stirring at room temperature for 24 h and drying at room temperature.
Characterization
A Malvern Zeta sizer Nano ZS90 (USA) was used to measure the average hydrated particle size and zeta potential of the materials. An X-ray diffraction analyzer is used to analyze the crystal structure of the material. The morphology of materials was observed using a scanning electron microscope Hitachi S-4800. The FTIR absorption spectra were analyzed using a Nicolet 6700 FTIR spectra analyzer. And the UV-Visible absorption spectra were recorded using a Varian Cary-Eclipse 500 spectrophotometer.
Photothermal conversion effect and photothermal therapy
The material was diluted to 6.25 ppm, 12.5 ppm, 25 ppm and 50 ppm as the experimental group, and DI water was used as the control group. Both the experimental group and the control group were irradiated with a near-infrared laser with a power density of 1.5 W cm−2 and a wavelength of 808 nm for 5 min. During the irradiation, the temperature change of the solution was measured and recorded using a thermocouple thermometer at the same location of the container. The influence of power density on photothermal performance was investigated by selecting a material with a concentration of 25 ppm. An 808 nm near-infrared laser with a power density of 1.0 W cm−2, 1.5 W cm−2 and 2.0 W cm−2 was used to irradiate for 5 min, and the temperature change was recorded. HeLa cells were used as a model to investigate the photothermal effect of the material on cells. First, 8000–10![[thin space (1/6-em)]](https://www.rsc.org/images/entities/char_2009.gif) 000 HeLa cells were inoculated into each well of the 96-well plate and cultured for 24 hours. Then, the cells were incubated with materials of 0–50 ppm concentration prepared with DMEM cell medium containing 10% FBS for 24 hours. After that, the cells were irradiated with an infrared laser (808 nm, 1.5 W cm−2) for 5 min, and the cell viability was measured by the cck-8 method. Calcein-AM and pyridine iodide (PI) staining was further used to investigate the photothermal therapeutic effect of the material on cells. First, 10000–12000 HeLa cells were inoculated into each well of the 6-well plate and cultured for 24 h. Next, the cells were incubated with 25 ppm materials prepared with RMPI-1640 complete medium for 24 h. The cells were irradiated with a near-infrared laser with a wavelength of 808 nm and a power density of 1.5 W cm−2 for 5 min. Finally, the cells were stained with calcein-AM/PI and observed under a fluorescence inverted microscope. Calcein-AM can emit green fluorescence in living cells and PI can emit red fluorescence in dead cells. The calculation method of photothermal conversion efficiency is shown below:
000 HeLa cells were inoculated into each well of the 96-well plate and cultured for 24 hours. Then, the cells were incubated with materials of 0–50 ppm concentration prepared with DMEM cell medium containing 10% FBS for 24 hours. After that, the cells were irradiated with an infrared laser (808 nm, 1.5 W cm−2) for 5 min, and the cell viability was measured by the cck-8 method. Calcein-AM and pyridine iodide (PI) staining was further used to investigate the photothermal therapeutic effect of the material on cells. First, 10000–12000 HeLa cells were inoculated into each well of the 6-well plate and cultured for 24 h. Next, the cells were incubated with 25 ppm materials prepared with RMPI-1640 complete medium for 24 h. The cells were irradiated with a near-infrared laser with a wavelength of 808 nm and a power density of 1.5 W cm−2 for 5 min. Finally, the cells were stained with calcein-AM/PI and observed under a fluorescence inverted microscope. Calcein-AM can emit green fluorescence in living cells and PI can emit red fluorescence in dead cells. The calculation method of photothermal conversion efficiency is shown below:| |  | (1) |
| |  | (2) |
| |  | (3) |
In the formula, h represents the thermal conversion efficiency in the system; S represents the surface area of the container; Q0 represents the variation of heat in the blank group; I represents the laser power density (unit: W cm−2); A represents the samples under the excitation wavelength absorbance value; Tmax and Tsurr represent the highest temperature after irradiation and environmental temperature; m represents the solution quality; C represents the specific heat; ΓS represents the system time constant; Δt represents the time in the process of cooling; lnθ represents the thermal drive constant; T represents the real-time temperature in the process of cooling.
Measurement of X-ray attenuation
The material was diluted to 1, 2, 3, 4, 5, and 6 mmol L−1 and placed in a 1.5 ml centrifuge tube, respectively. The same concentration of iohexanol was used as the control group, and the Brilliance 64 secting system (Philips Healthcare, Andover, MA) was used for scanning. The section thickness was set at 0.625 mm, the bulb tube voltage was 120 kV, and the field of view (FOV) was 25.0 cm. The GSI Viewer was used to process the captured images and detect the CT signal strength. The CT value of the region was measured by selecting the same layer and area on the six groups of scanned images. The CT imaging effect of the material of different concentrations in PBS solution was reflected by the value of Hounsfield Unit commonly used in clinical practice.
In vitro biocompatibility experiments
HeLa cells (human cervical cancer cells) were used as the cell model and cultured at 37 °C with a concentration of 5% CO2. The DMEM medium was replaced every 48 h. The cell growth and morphology were observed using a fluorescence inverted microscope (Olympus, IX71, Japan). The cytotoxicity of the material was analyzed by MTT assay. First, 8000–10000 HeLa cells were inoculated into each well of the 96-well cell culture plate and incubated for 24 hours at 37 °C with a concentration of 5% CO2 to keep the cells in a good state of growth. Then, the old medium was discarded, and 100 μL of DMEM complete medium with concentration gradients of 0, 6.25, 12.5, 25, and 50 ppm containing materials were added to each well, followed by routine culture for 24 h and 48 h. Meanwhile, a blank control group was set. After the termination of the culture, the supernatant was discarded, 100 μL 1 mg mL−1 MTT solution was added to each well, and the cells were incubated at 37 °C for 4 h, and the living cells were stained. After 4 h, the liquid was discarded, 150 μL DMSO was added to each well, placed in a shaker, and shaken evenly for 10 min. OD values of each well at 490 nm were measured and recorded. After comparison with the data of the blank control group, the relationship between the cell survival rate and incubation concentration was obtained. Calcein-AM and PI were used to stain cells after culture termination to evaluate the effect of the material on cell viability. First, 10000–12000 HeLa cells were inoculated into each well of the 6-well cell culture plate and incubated for 24 hours at 37 °C with a concentration of 5% CO2. Then, the old medium was discarded, and 1 mL of complete medium with a concentration gradient of 6.25, 12.5, 25, and 50 ppm materials were added to each well for routine culture for 24 hours. Meanwhile, a blank control group was set. After the culture was terminated, the supernatant was discarded, and 2 mM 5 L calcein-AM and 1.5 mM 15 L PI were mixed with 5 mL 1× Buffer, and incubated at 37 °C for 10 min. The cell staining was observed and photographed using an inverted fluorescence microscope.
Biocompatibility experiments on zebrafish
Zebrafish fertilized embryos were used as an in vivo model to investigate the biocompatibility. Zebrafish embryos were purchased from the zebrafish testing platform of the Chinese Academy of Sciences and produced 4 hours (4 hpf) after fertilization. In the control group, 5 mL E3 medium was placed in each well of the 6-well plate, and 20 zebrafish embryos were further cultured at 28 °C. In the experimental group, fish embryos were incubated in E3 medium with concentrations of 0–50 ppm WS2@BSA NSs. The experiment was repeated 5 times to ensure the accuracy of each group of data. During each incubation period, the development of embryos was observed with an inverted microscope, the number of surviving and hatching embryos was recorded carefully, and the survival rate and hatching rate were calculated using the following formula.| |  | (4) |
| |  | (5) |
Results and discussion
Preparation and characterization of WS2@BSA NSs
The synthesis process of WS2@BSA NSs is shown in Scheme 1A, and the Experimental operation section can also help to understand the specific process. Bulk-WS2 was used as the raw material, the ultrathin WS2 NSs were obtained by ultrasound-assisted exfoliation under NMP as an organic liquid phase, and then BSA was coated to enhance biocompatibility.
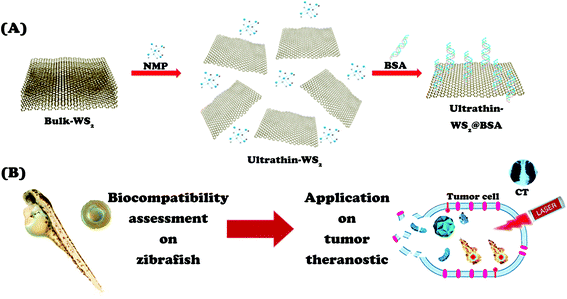 |
| | Scheme 1 (A) The preparation process of WS2@BSA NSs. (B) The zebrafish embryo model for evaluating the biocompatibility of WS2@BSA NSs and application in tumor theranostics. | |
In order to observe the morphology of WS2@BSA NSs, the as-prepared WS2@BSA NSs were characterized by scanning electron microscopy (SEM). As shown in Fig. 1a, the WS2@BSA NSs that were ultrasound-assisted exfoliated in liquid phase exhibit a shape of broken nanosheets, scattered on the sample unit. Moreover, the WS2@BSA NSs were dispersed evenly and there was no obvious agglomeration. Through observation of Fig. 1c and d carefully, except for a small number of folded nanosheets, we can see that most of them had a very thin thickness. In the insertion diagram of Fig. 1b, the dynamic light scattering (DLS) method was used to measure the hydrodynamic size of the WS2@BSA NSs, and it can be seen that the hydration particle size of WS2@BSA NSs is 150–200 nm and WS2@BSA NSs have a narrow particle size distribution. At the same time, we randomly selected 300 samples from the SEM photos to analyze the particle size distribution of the WS2@BSA NSs. According to statistics, as shown in Fig. S1,† the average diameter of the nanosheet is about 150 nm, which coincides with DLS results.
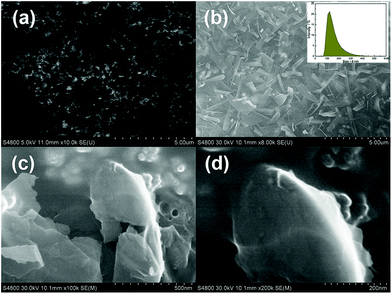 |
| | Fig. 1 (a–d) SEM images of WS2@BSA NSs under different magnifications. Inset of (b): The size distribution analysis of WS2@BSA NSs. | |
Then, the physical and chemical properties of WS2@BSA NSs were characterized. Firstly, the XRD of the WS2@BSA NSs, WS2 NSs and bulk-WS2 was compared (Fig. 2a). Since the XRD reflected is the change of the crystal structure before and after exfoliation, we can see from Fig. 2a that the crystal structure changes as the original interlaminar forces disappear after exfoliation. A part of the lattice was destroyed, resulting in the decrease of (100), (004) and (101) characteristic peaks, but the major characteristic peak positions did not change significantly. Further BSA coating also had no effect on the crystal structure compared to the WS2 NSs without BSA coating. In order to demonstrate the success of the BSA package, WS2@BSA NSs were analyzed by UV-Vis absorption spectroscopy and FTIR spectroscopy (Fig. 2b and c). It can be seen in the UV-Vis absorption spectra that the WS2@BSA NSs and WS2 NSs have a characteristic peak of WS2 at 641 nm. At the same time, there is an extra characteristic peak of BSA at 278 nm in the UV-Vis absorption spectra of WS2@BSA NSs.28 The information of functional groups of materials can be obtained from FTIR spectra. By comparing the FTIR spectra of WS2 NSs before and after coating the BSA, the spectra of WS2@BSA NSs had the –OH stretching vibration peak at 3442 cm−1, amide linkage characteristic peak at 1639 cm−1, and methylene fluctuations, bending vibration and primary amine C–N stretching vibration peaks at 1448 cm−1 and 1066 cm−1. Combined with the information obtained from the UV-Vis and FTIR spectra, it is possible to determine that the BSA was successfully coated on the surface of WS2 NSs. Then the mechanism of BSA binding on WS2 NSs was investigated. A zeta potentiometer was used to test the surface electrical properties of WS2@BSA NSs, WS2 NSs and BSA. It was found that the zeta potential of BSA, WS2 NSs and WS2@BSA NSs was −27.4 mV, 20.8 mV and −19.8 mV, respectively (Fig. 2d). This indicated that the surface of the unmodified WS2 NSs has a certain amount of positive charge, while the surface of the BSA has negative charge. Obviously, the two materials are bound together by electrostatic adsorption due to their different electronegativity. The electronegativity of the WS2@BSA NSs is consistent with that of the BSA, illustrating the successful coating of the BSA. Finally, the stability of the WS2@BSA NSs was investigated and the UV-Vis spectra of WS2@BSA NSs in different solvent systems and pH environments were analyzed (Fig. 3a and b). In different solution systems and pH environments, the characteristic absorption peak of WS2 at 641 nm and the characteristic absorption peak of BSA at 278 nm can be seen in the spectra. This phenomenon shown that the WS2@BSA NSs can be stable in different solution environments and pH, and can handle the complex humoral biological environment. After being left standing for 24 hours, there was no obvious agglomeration of the WS2@BSA NSs, indicating their good stability.
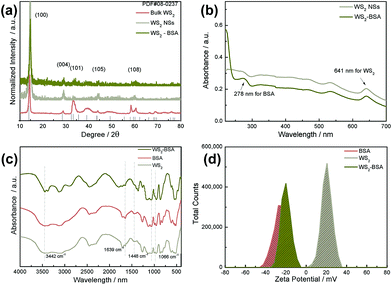 |
| | Fig. 2 (a) XRD images of WS2@BSA NSs, WS2 NSs and bulk-WS2. (b) UV-Vis absorption spectra of WS2@BSA NSs and WS2 NSs. (c) FTIR absorption spectra of WS2, BSA and WS2@BSA NSs. (d) Zeta potential analysis of WS2 NSs, BSA and WS2@BSA NSs. | |
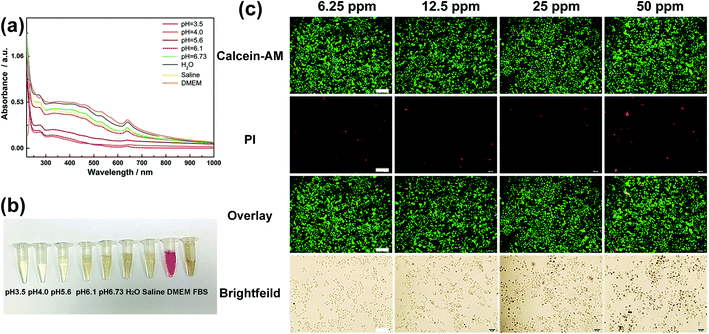 |
| | Fig. 3 (a) UV-Vis spectra of WS2@BSA NSs in different solvent systems and pH environments. (b) Digital photo of WS2@BSA NSs left standing for 24 hours. (c) The fluorescence inverted microscope images of HeLa cells stained with calcein-AM/PI after the co-incubation with WS2@BSA NSs for 24 h. (Scale bar: 40 μm). | |
Biocompatibility of WS2@BSA NSs at the cellular level and zebrafish in vivo model
For clinical application, the toxicity and biocompatibility of WS2@BSA NSs are the most important factors. In order to explore the biotoxicity and biocompatibility of WS2@BSA NSs, the cytotoxicity experiments were carried out firstly. As shown in Fig. 3c, the cells were incubated with a series of gradient concentrations of WS2@BSA NSs for 24 h and then stained with calcein-AM/PI. With the increase of concentration, the red fluorescence did not increase and remained at a low level, indicating that the number of apoptotic cells was small. In the fluorescence channel overlay diagram, the green fluorescence still occupies the largest part of the area, and the change of material concentration has little effect on the cell activity.
Similarly, MTT assay was used for cytotoxicity analysis of WS2@BSA against HeLa cells. As can be seen in Fig. 4a, the minimum value of cell viability is still above 70% after incubation for 48 h. At other times, there was almost no effect on cell activity, and in terms of concentration, at concentrations as high as 50 ppm, cell survival remains above 80%, which meant that the effect of the WS2@BSA NSs on cell activity could even be ruled out. The trend of cell activity at different concentrations can also be seen in Fig. 4b. With the extension of time, the cell activity was basically the same without significant change.
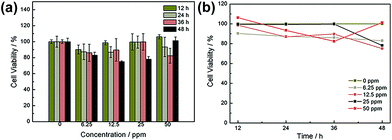 |
| | Fig. 4 (a) CCK-8 analysis of cell viability under gradient concentration and gradient incubation time. (b) CCK-8 analysis shows the trend of changes in cell viability. | |
As a highly homologous organism with human genes, zebrafish is an excellent subject of biocompatibility experiments. In order to further investigate the biocompatibility of the WS2@BSA NSs, zebrafish embryos were used as biological models in the experiment to explore the effects of the materials on the survival rate and hatching rate of zebrafish fertilized embryos. Fig. 5a–e show the survival rate of zebrafish embryos in different culture stages. The data showed that the survival rate of zebrafish embryos was above 80% in the incubation process of up to 120 hpf. The same trend was also displayed in Fig. 5f. The survival rate of zebrafish embryos was basically the same as that of the control group without WS2@BSA NSs, indicating that the presented WS2@BSA NS materials have little impact on the survival rate of zebrafish embryos.
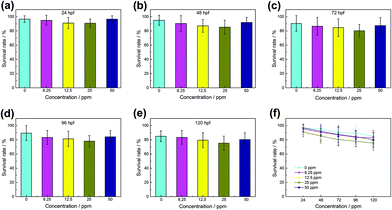 |
| | Fig. 5 Zebrafish embryos were incubated in E3 medium with different concentrations of WS2@BSA NSs (0–50 ppm), and the survival rate of zebra embryos was recorded after (a) 24 hpf, (b) 48 hpf, (c) 72 hpf, (d) 96 hpf and (e) 120 hpf. (f) The change of the survival rate of zebra embryos. | |
With the continuous extension of time, zebrafish embryos gradually began to hatch, and the phased hatching rate of zebrafish embryos can also reflect the influence of materials on zebrafish embryos. In the first two hatching stages (Fig. 6a and b), the hatching rate of the experimental group was lower than that of the control group. But by the third incubation stage (Fig. 6c), the incubation rate of the experimental group was gradually catching up with that of the control group, indicating that WS2@BSA NSs still had a certain effect on the embryos of zebrafish and delayed the hatching time of the embryos. The catch-up trend of the incubation rate of the experimental group can also be seen in Fig. 6d. Combined with the digital photos of the incubation process in Fig. 7, it can be seen that the increase of WS2@BSA NS concentration makes the culture medium even more turbid. When the incubation time reaches 72 hours, the zebrafish embryos of the control group and the fish embryos with a material concentration of 6.25 ppm have already hatched, and the egg yolk part of the fish embryos with a material concentration of 12.5 ppm has also begun to differentiate. Compared with the control group, there was no significant difference in tail morphology and fry activity. The results showed that the WS2@BSA NSs had delayed the incubation of zebrafish embryos, but had little effect on the final incubation results.
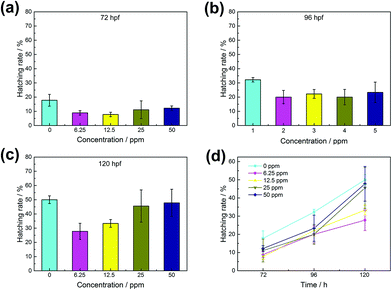 |
| | Fig. 6 Zebrafish embryos were incubated in E3 medium with different concentrations of WS2@BSA NSs, and the hatching rate was obtained after (a) 72 hpf, (b) 96 hpf and (c) 120 hpf. (d) Trends in zebrafish hatching rates over time. | |
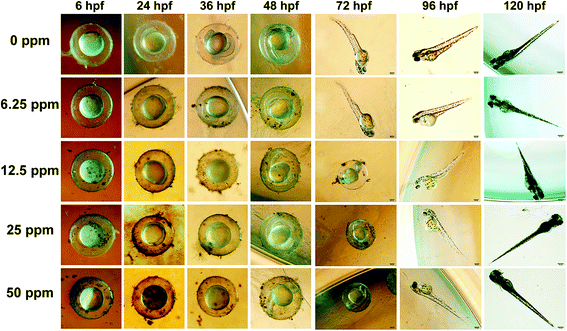 |
| | Fig. 7 Photographic record of the morphologic changes and hatching of zebrafish embryos over time in a gradient concentration of WS2@BSA NSs. | |
Photothermal conversion effect and photothermal therapy of WS2@BSA NSs
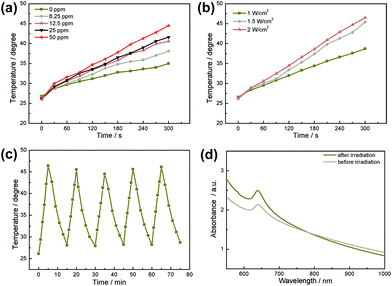
In order to explore the possibility of using WS2@BSA NSs in photothermal therapy, the photothermal conversion ability of WS2@BSA NSs was examined. Firstly, UV-Vis spectra of the WS2@BSA NSs with gradient concentration were analyzed, and an appropriate laser source was selected according to the results. As shown in Fig. S2,† the absorption of WS2@BSA NSs with gradient concentration gradually decreases in the near-infrared region, so we choose a laser with a wavelength of 808 nm as the light source. Then the two groups of experiments were carried out including the gradient concentration photothermal experiment and gradient laser power density photothermal experiment. As shown in Fig. 8a and b, with the increase of WS2@BSA NS concentration and laser power density, the temperature at the end of the experiment also increases. The rate of temperature rise is proportional to the WS2@BSA NS concentration and laser power density. When the material concentration reaches 50 ppm, at a power density of 1.5 W cm−2, it can reach 44.5 °C in 5 minutes, which is higher than the threshold temperature of 43 °C for the heat-induced apoptosis of tumor cells.29 Then, the stability of the heating capacity of the WS2@BSA NSs was further tested. A WS2@BSA NS sample was heated and cooled for 5 cycles under laser stimulation with constant power density (Fig. 8c). As shown in the five cycles, the temperature at the same time point is basically flat, indicating good photothermal stability of the materials. At the same time, the characteristic peaks of tungsten disulfide were still clear and obvious in the UV-Vis spectra (Fig. 8d), which indicated that the molecular structure of the material remained stable before and after photothermal experiments.
 |
| | Fig. 8 (a) Temperature rise curve of WS2@BSA NSs with gradient concentration at 1.5 W cm−2 power density of 808 nm laser. (b) Temperature rise curve of 25 ppm WS2@BSA NSs under a gradient power density of 808 nm laser. (c) Temperature variation curve of five cycles under 808 nm laser irradiation. (d) UV-Vis spectra of materials before and after the photothermal experiment. | |
In order to quantitatively evaluate the photothermal conversion efficiency of WS2@BSA NSs, the WS2@BSA NSs with a concentration of 25 ppm were irradiated by an 808 nm laser with a power density of 1.5 W cm−2 for 10 min, and then cooled down naturally to room temperature. The solution temperature during heating and cooling is illustrated in Fig. S3a.† Selecting 100 temperature points from the cooling process, formulas (1), (2) and (3) in the Experimental section were used to calculate the photothermal conversion efficiency η of the WS2@BSA NSs.30 As shown in Fig. S3b,† slope ΓS is obtained by drawing the plot of Δt − lnθ, and eventually the thermal conversion efficiency of WS2@BSA NSs is obtained, which is about 13.2%.
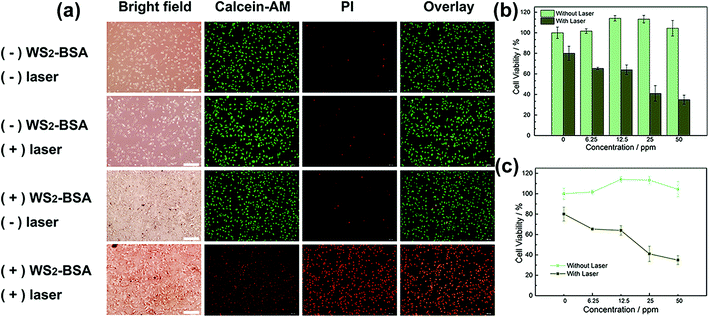
Due to their good photothermal conversion efficiency, we applied the WS2@BSA NSs to cell level photothermal treatment experiments. The different groups of cells after calcein-AM/PI staining were observed under a fluorescence inverted microscope (Fig. 9a). Because calcein-AM/PI causes living cells to fluoresce in green and dead cells to fluoresce in red, the state of the different groups of cells was clear after the photothermal treatment experiment. By comparison, it was found that only the HeLa cells displayed red fluorescence after incubation with WS2@BSA NSs and irradiated by an 808 nm near-infrared laser, which meant that a large amount of cells died away. The remaining control group without WS2@BSA NSs or without laser irradiation showed a large area of green fluorescence meaning most of the cells are in good condition.
 |
| | Fig. 9 (a) HeLa cells stained with calcein-AM/PI under the inverted fluorescence microscope after the photothermal therapy. (Scale bar: 40 μm) (b) Analysis of CCK-8 assay after the photothermal therapy. (c) Line graph of cell activity changes of different groups in the photothermal experiment. | |
A CCK-8 cell counting kit was also used to investigate the cell viability of different groups after photothermal treatment (Fig. 9b and c). The HeLa cells were incubated with WS2@BSA NSs of the gradient concentration and irradiated by an 808 nm near-infrared laser at the same time, and then analyzed by CCK-8. It can be seen that with the increase of WS2@BSA NS concentration, the cell viability under the same time laser irradiation presents a trend of gradient decline, and the cell viability was less than 40% at a concentration of 50 ppm. However, the cell viability of the control group was basically unchanged. Combined with the fluorescence image of HeLa cells stained with calcein-AM/PI and cell viability, it can be verified that the photothermal transformation ability of the WS2@BSA NSs can be used to inhibit the growth of tumor cells and realize possible photothermal treatment of cancer.
Potential clinical application of WS2@BSA NSs in CT imaging
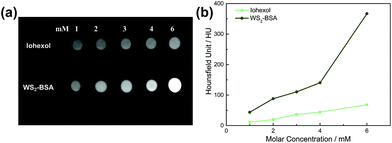
As an important means of auxiliary medical diagnosis, the effect of CT imaging depends on the contrast difference between the target site and the surrounding site. At present, iodine preparations are commonly used clinical contrast agents. In order to explore the potential of WS2@BSA NSs in clinical application, we chose iohexanol as the control group and compared the imaging effects of WS2@BSA NSs. As shown in Fig. 10a, by comparing the imaging effect of WS2@BSA NSs of the same concentration as that of iohexanol, it can be found that the CT image result of the material group is brighter, the contrast of the image is higher, and the signal is stronger, which indicates that the imaging effect of the WS2@BSA NSs will be more obvious under the same dose. The imaging effect was quantified as the value of Hounsfield Unit, which also manifests the same trend (Fig. 10b). When the concentrations were all 6 mM, the HU value of WS2@BSA NSs reached 366.8 Hounsfield units (HU), which was far greater than the HU value of iohexanol (68.2 HU). This is because CT imaging is an imaging technique that uses different substances to have different attenuation capabilities of X-ray, and elements with a large atomic number have stronger attenuation capabilities.31 Iodine is the main X-ray attenuator in iohexanol, while tungsten has a higher X-ray attenuator due to its larger atomic number, which gives it a higher contrast on the image. Combining the results of the images and the numerical HU results, it can be concluded that the WS2@BSA NSs have a much more enhanced CT imaging effect and have great clinical transformation prospects.
 |
| | Fig. 10 (a) Contrast of CT imagines in vitro between WS2@BSA NSs and iohexanol. (b) CT signal contrast of WS2@BSA NSs and iohexanol with different concentrations. | |
Conclusions
In summary, we successfully synthesized WS2@BSA NSs by the liquid phase exfoliating method and explored them as a potential theranostic agent. We were focusing on the one of the most important issues in clinical translation of theranostic agents, e.g. the biocompatibility of the nanomaterials. Zebrafish, as an excellent model organism, was utilized for biocompatibility experiments in vivo, in which many testing methods and indicators were used for TMD nanomaterial toxicity experiments. The results showed that the WS2@BSA NSs have a good biocompatibility and have a little effect on the hatching and development of zebrafish. Furthermore, the photothermal transformation ability of the WS2@BSA NSs was investigated. The photothermal transformation efficiency of the WS2@BSA NSs was estimated to be about 13.2%, indicating their effective inhibiting activity to the tumor cells. Additionally, the CT imaging ability of the WS2@BSA NSs was also superior compared with that of iohexanol, a commonly used reagent in clinical practice. Therefore, our present work offered one new research strategy on the toxicity studies of TMD nanomaterials from the perspective of their effects on the growth of zebrafish, and further explored the application in treatment and diagnosis, providing a new reference for the evaluation model of applied theranostic agents in the nanobiomedical field.
Ethical statement
All animal procedures were performed in accordance with the Guidelines for Care and Use of Laboratory Animals of Shanghai Normal University and approved by the Animal Ethics Committee of Shanghai Normal University.
Conflicts of interest
There are no conflicts to declare.
Acknowledgements
This work was financially supported by the Shanghai Science and Technology Committee (17070503000 and 18dz2308700); Shanghai Engineering Research Center of Green Energy Chemical Engineering; Program for Changjiang Scholars; Innovative Research Team in University (IRT_16R49); International Joint Laboratory on Resource Chemistry (IJLRC).
References
- C. Tan, X. Cao, X.-J. Wu, Q. He, J. Yang, X. Zhang, J. Chen, W. Zhao, S. Han, G.-H. Nam, M. Sindoro and H. Zhang, Chem. Rev., 2017, 117, 6225–6331 CrossRef CAS.
- Y. Hernandez, V. Nicolosi, M. Lotya, F. M. Blighe, Z. Sun, S. De, I. T. McGovern, B. Holland, M. Byrne, Y. K. Gun'Ko, J. J. Boland, P. Niraj, G. Duesberg, S. Krishnamurthy, R. Goodhue, J. Hutchison, V. Scardaci, A. C. Ferrari and J. N. Coleman, Nat. Nanotechnol., 2008, 3, 563–568 CrossRef CAS.
- G. Fiori, F. Bonaccorso, G. Iannaccone, T. Palacios, D. Neumaier, A. Seabaugh, S. K. Banerjee and L. Colombo, Nat. Nanotechnol., 2014, 9, 768–779 CrossRef CAS.
- M. Chhowalla, D. Jena and H. Zhang, Nat. Rev. Mater., 2016, 1, 16052 CrossRef CAS.
- C. Ataca, H. Şahin and S. Ciraci, J. Phys. Chem. C, 2012, 116, 8983–8999 CrossRef CAS.
- R. R. Nair, P. Blake, A. N. Grigorenko, K. S. Novoselov, T. J. Booth, T. Stauber, N. M. R. Peres and A. K. Geim, Science, 2008, 320, 1308 CrossRef CAS.
- C. Lee, X. Wei, J. W. Kysar and J. Hone, Science, 2008, 321, 385 CrossRef CAS.
- S. Bertolazzi, J. Brivio and A. Kis, ACS Nano, 2011, 5, 9703–9709 CrossRef CAS.
- A. Zhang, Q. Zhang, G. Alfranca, S. Pan, Z. Huang, J. Cheng, Q. Ma, J. Song, Y. Pan, J. Ni, L. Ma and D. Cui, Nano Res., 2020, 13, 160–172 CrossRef CAS.
- Y. Mi, C. C. Smith, F. Yang, Y. Qi, K. C. Roche, J. S. Serody, B. G. Vincent and A. Z. Wang, Adv. Mater., 2018, 30, 1706098 CrossRef.
- Q. Chen, C. Wang, X. Zhang, G. Chen, Q. Hu, H. Li, J. Wang, D. Wen, Y. Zhang, Y. Lu, G. Yang, C. Jiang, J. Wang, G. Dotti and Z. Gu, Nat. Nanotechnol., 2019, 14, 89–97 CrossRef CAS.
- X. Huang, I. H. El-Sayed, W. Qian and M. A. El-Sayed, J. Am. Chem. Soc., 2006, 128, 2115–2120 CrossRef CAS.
- W. Yin, L. Yan, J. Yu, G. Tian, L. Zhou, X. Zheng, X. Zhang, Y. Yong, J. Li, Z. Gu and Y. Zhao, ACS Nano, 2014, 8, 6922–6933 CrossRef CAS.
- P. Li, L. Liu, Q. Lu, S. Yang, L. Yang, Y. Cheng, Y. Wang, S. Wang, Y. Song, F. Tan and N. Li, ACS Appl. Mater. Interfaces, 2019, 11, 5771–5781 CrossRef CAS.
- L. Cheng, J. Liu, X. Gu, H. Gong, X. Shi, T. Liu, C. Wang, X. Wang, G. Liu, H. Xing, W. Bu, B. Sun and Z. Liu, Adv. Mater., 2014, 26, 1886–1893 CrossRef CAS.
- S. Zhu, L. Gong, Y. Li, H. Xu, Z. Gu and Y. Zhao, Adv. Sci., 2019, 6, 1802289 CrossRef.
- B. Fadeel, L. Farcal, B. Hardy, S. Vázquez-Campos, D. Hristozov, A. Marcomini, I. Lynch, E. Valsami-Jones, H. Alenius and K. Savolainen, Nat. Nanotechnol., 2018, 13, 537–543 CrossRef CAS.
- T. J. Hamilton, A. Morrill, K. Lucas, J. Gallup, M. Harris, M. Healey, T. Pitman, M. Schalomon, S. Digweed and M. Tresguerres, Sci. Rep., 2017, 7, 15081 CrossRef.
- A. I. Faustino, A. Tacão-Monteiro and R. F. Oliveira, Sci. Rep., 2017, 7, 44329 CrossRef CAS.
- M. C. Fishman, Science, 2001, 294, 1290 CrossRef CAS.
- M. Takeuchi, C. Inoue, A. Goshima, Y. Nagao, K. Shimizu, H. Miyamoto, T. Shimizu, H. Hashimoto, S. Yonemura, A. Kawahara, Y. Hirata, M. Yoshida and M. Hibi, Genes Cells, 2017, 22, 723–741 CrossRef CAS.
- C. Wang, Y. Wang, G. Wang, S. Chen and C. Huang, J. Mater. Chem. B, 2019, 7, 5633–5639 RSC.
- G. Wang, Y. Wang, C. Wang, C. Huang and N. Jia, Analyst, 2020, 145, 828–835 RSC.
- C. Lawrence, Aquaculture, 2007, 269, 1–20 CrossRef.
- H.-R. Jia, Y.-X. Zhu, Q.-Y. Duan, Z. Chen and F.-G. Wu, J. Controlled Release, 2019, 311–312, 301–318 CrossRef CAS.
- H.-R. Jia, Y.-X. Zhu, K.-F. Xu, G.-Y. Pan, X. Liu, Y. Qiao and F.-G. Wu, Chem. Sci., 2019, 10, 4062–4068 RSC.
- X. Chen, X. Zhang, C. Li, S. M. Sayed, W. Sun, F. Lin and F.-G. Wu, Sens. Actuators, B, 2019, 295, 49–55 CrossRef CAS.
- G. Guan, S. Zhang, S. Liu, Y. Cai, M. Low, C. P. Teng, I. Y. Phang, Y. Cheng, K. L. Duei, B. M. Srinivasan, Y. Zheng, Y.-W. Zhang and M.-Y. Han, J. Am. Chem. Soc., 2015, 137, 6152–6155 CrossRef CAS.
- K. F. Chu and D. E. Dupuy, Nat. Rev. Cancer, 2014, 14, 199–208 CrossRef CAS.
- W. Ahn and D. K. Roper, J. Phys. Chem. C, 2008, 112, 12214–12218 CrossRef CAS.
-
G. T. Herman, Fundamentals of Computerized Tomography: Image Reconstruction from Projections, 2009 Search PubMed.
Footnote |
| † Electronic supplementary information (ESI) available: Particle size distribution, Uv-Vis of WS2@BSA NSs, and figures to assist in calculating the photothermal efficiency. See DOI: 10.1039/d0bm00991a |
|
| This journal is © The Royal Society of Chemistry 2021 |
Click here to see how this site uses Cookies. View our privacy policy here. 
 *
*


