
 Open Access Article
 This Open Access Article is licensed under a
 Creative Commons Attribution 3.0 Unported Licence
Determination of organic chlorine in water via AlCl derivatization and detection by high-resolution continuum source graphite furnace molecular absorption spectrometry
Carlos
Abad
 *ab,
Stefanie
Mimus
c,
Sebastian
Recknagel
a,
Norbert
Jakubowski
d,
Ulrich
Panne
ab,
Helmut
Becker-Ross
e and
Mao-Dong
Huang
e
*ab,
Stefanie
Mimus
c,
Sebastian
Recknagel
a,
Norbert
Jakubowski
d,
Ulrich
Panne
ab,
Helmut
Becker-Ross
e and
Mao-Dong
Huang
e
aBundesanstalt für Materialforschung und -prüfung (BAM), Richard-Willstätter-Str. 11, 12489 Berlin, Germany. E-mail: carlos.abad@bam.de
bHumboldt-Universität zu Berlin, School of Analytical Sciences Adlershof (SALSA), Unter den Linden 6, 10099 Berlin, Germany
cFreie Universität Berlin, Department of Chemistry, Takustr. 3, 14195 Berlin, Germany
dSpetec GmbH, Am Kletthamer Feld 15, 85435 Erding, Germany
eLeibniz-Institut für Analytische Wissenschaften – ISAS – e. V., Department Berlin, Schwarzschildstr. 8, 12489 Berlin, Germany
First published on 15th July 2021
Abstract
High-resolution continuum source graphite furnace molecular absorption spectrometry (HR-CS-GF-MAS) was employed for determining adsorbable organic chlorine (AOCl) in water. Organic chlorine was indirectly quantified by monitoring the molecular absorption of the transient aluminum monochloride molecule (AlCl) around a wavelength of 261.42 nm in a graphite furnace. An aluminum solution was used as the molecular-forming modifier. A zirconium coated graphite furnace, as well as Sr and Ag solutions were applied as modifiers for a maximal enhancement of the absorption signal. The pyrolysis and vaporization temperatures were 600 °C and 2300 °C, respectively. Non-spectral interferences were observed with F, Br, and I at concentrations higher than 6 mg L−1, 50 mg L−1, and 100 mg L−1, respectively. Calibration curves with NaCl, 4-chlorophenol, and trichlorophenol present the same slope and dynamic range, which indicates the chlorine atom specificity of the method. This method was evaluated and validated using synthetic water samples, following the current standard DIN EN ISO 9562:2004 for the determination of the sum parameter adsorbable organic halides (AOX) for water quality. These samples contain 4-chlorophenol as the chlorinated organic standard in an inorganic chloride matrix. Prior to analysis, organic chlorine was extracted from the inorganic matrix via solid-phase extraction with a recovery rate >95%. There were no statistically significant differences observed between measured and known values and for a t-test a confidence level of 95% was achieved. The limits of detection and characteristic mass were found to be 48 and 22 pg, respectively. The calibration curve was linear in the range 0.1–2.5 ng with a correlation coefficient R2 = 0.9986.
1. Introduction
Chlorinated organic compounds are well known as persistent water pollutants.1,2 Currently, the Stockholm Convention on Persistent Organic Pollutants (POPs) formally recognizes several of them.3 Despite their toxicity and consequent regulations by European and U.S. authorities,4–6 they are still used as pesticides (DDT type, polychlorinated cyclodienes, and biphenyls) in industry,7,8 as non-polar solvents and polymers (phenols, chloromethanes and chloroethanes, vinyl chlorides, and dibenzodioxins),9 and as products and by-products from the pharmaceutical industry.10–12 Even at trace levels, their presence is a threat to human health.13,14 Therefore, quick and accurate monitoring of chlorinated organic compounds in drinking water is a public health concern that requires safety actions.To date, several analytical methods have been reported for the total determination of organochlorinated compounds in water using routine analytical techniques like ion chromatography,15 gravimetric titration, and potentiometry.16,17 Unfortunately, the chemical conversion of the organic chlorine into an appropriate form for analysis (i.e., as chloride ions in solution) is necessary for these methods, which is time-consuming and prone to contamination. More sophisticated analytical methods like ICP-MS or ICP-OES, which do not require pretreatment of the sample, are compromised by the memory effect of the halogen atom in the plasma torch, and they typically need certified reference materials or matrix-matched standards for calibration and bias correction.18,19 Additionally, the strongest absorption and emission lines of chlorine lie below the vacuum UV spectral range, which creates a technical challenge for its quantification via optical methods like ICP-OES or atomic absorption spectrometry (AAS). A drawback for ICP-MS is the isobaric interferences of 35Cl isotopes with 16O18O1H+ and 34S1H+ and 37Cl isotopes with 36Ar1H+ and 36S1H+, which are almost undoubtedly present in the plasma during water analysis.20
The standard DIN EN ISO 9562:2004 regulates the analysis of chlorine and other halogen atoms in water samples into one AOX parameter (adsorbable organic halogens, excluding fluorine).16,21 AOX is determined by filtering a volume of sample through active carbon. Its calcination in a pure oxygen steam combusts the organic matrix and carbon filter. Consequently, hydrogen halides are generated (HCl, HBr, HI), which are collected in a basic solution. Finally, the halogen atom is quantified via coulometric titration with a standard silver solution. If there is any bromide or iodide in the sample, these are calculated as chloride equivalents. Despite the reproducibility and high confidence of this standard, the lack of selectivity is obvious because of its inability to differentiate between halogens. Therefore, more selective and faster analytical methods for chlorinated organic compounds are needed.
High-resolution continuum source molecular absorption spectrometry (HR-CS-MAS) has been introduced as an analytical method for non-metal and isotope determination22,23 by monitoring the absorption of an in situ generated transient diatomic molecule in the gas phase using a xenon lamp as a light source, which produces a large range continuum spectrum with high radiance. This instrument is coupled to a high-resolution monochromator with a charge-coupled device (CCD) as a detector. Beginning in 1984, Dittrich et al. revealed the potential of molecular absorption spectrometry for the determination of chlorine by monitoring the AlCl molecule using a D2 lamp and a medium-resolution spectrometer.24 More recently, using modern instruments, chlorine has been determined in several samples with diatomic molecules like MgCl,25 CaCl,26,27 SrCl,28 InCl,29 and AlCl.30–32 In fact, chlorine has been quantified in complex matrices like coal by monitoring the molecule SrCl and in crude oils by monitoring AlCl, InCl, and SrCl molecules by direct solid sampling high-resolution continuum source graphite furnace molecular absorption spectrometry (HR-CS-GF-MAS).33
Here, HR-CS-GF-MAS is presented as an alternative, faster, and simpler detector for organochlorine compounds in water via the AlCl molecule formation. The detected AlCl signal enhancement by the combination of chemical modifiers is investigated. For this method, samples were prepared according to the DIN ISO standard for AOCl analysis. This standard allows us to calibrate and validate the proposed method. This work explores lower limits of detection by combining different chemical modifiers. Thus, HR-CS-MAS extends the application range of classical AAS to non-metals that are otherwise not detectable.
2. Experimental
2.1. Reagents and samples
Ultrapure deionized water (18.2 MΩ cm) was used for dilutions (Milli-Q Gradient, Merck Millipore). A standard solution of 5 g L−1 of chloride was prepared from NaCl (Ultrapure, Merck). Synthetic samples were prepared according to the standard DIN EN ISO 9562:2004. More specifically, a standard solution containing 0.1 g L−1 of organic chlorine was made by dissolving a corresponding amount of 4-chlorophenol (PhCl) (Sigma-Aldrich, 99.9%) in 50 mL of water and preserving it at 5 °C. A 10 mg L−1 stock solution of 2,4,6-trichlorophenol (TCP) was used for the specificity test of the method (Sigma-Aldrich, 99.9%). Methanol (Sigma-Aldrich, HPLC grade) was used after further refluxing in AgNO3 (Alfa Aesar, 99.9%). A stock standard solution of 0.1 g L−1 of Al (Certipur, Merck) was used as the molecule-forming reagent. As chemical modifiers, a Sr2+ solution (0.1%) was prepared from Sr(NO3)2 (Merck, 99.9%). A solution of Ag+ was made from AgNO3 and preserved away from light. HNO3 was purified by sub-boiling in PFA devices. A solution of NaNO3 (0.1 M) was prepared by dissolving an appropriate amount of NaNO3 (Alfa Aeser, pro-analysis) in water.Sample matrices of inorganic chloride were prepared in concentrations of 2, 1, and 0.01 g L−1 by dissolving an appropriate amount of NaCl in 100 mL of water. These samples simulate the chloride concentrations from seawater to tap water. For each concentration of an inorganic chlorine matrix, an aliquot of organic chlorine solution was previously added to complete solutions of 1000, 500, 100, 50, 25, and 10 μg L−1 of organic chlorine. A total of 15 samples was prepared and kept at 5 °C before analysis.
2.2. Instrumentation
All measurements were performed using a commercial high-resolution continuum source atomic absorption spectrometer (model contrAA 700; Analytik Jena, Germany) with a transversely heated graphite tube atomizer and pyrolytically coated graphite tubes with a PIN platform (Part Nr. 407-A81.025, Analytik Jena, Germany). Prior to measurements, the graphite tubes were treated with Zr as a permanent modifier as previously described by Huang et al.342.3. Sample preparation
For each sample, a volume of 50 mL was aspirated through a solid-phase extraction (SPE column Macherey-Nagel Chromabond® HR-P-AOX 100 and 500 cartridges) with a flow rate of 3–5 mL min−1. The first eluted solution was discarded. The column was washed with 25 mL of a 0.1 mol L−1 NaNO3 solution in 1% HNO3. This elution was again discarded. The column was finally washed with exactly 5 mL of methanol (flow rate: 0.5 mL min−1) and 10 mL of water. The eluted solution was collected in a 50 mL measuring flask and filled up with water. As explained in Section 3.1, methanol concentration should not be higher than 10% (v/v) to avoid signal suppression.2.4. Measurements
After optimization of the temperature program (Table 1) and the concentration of modifiers, an aliquot of 5 μL of an extracted sample was introduced into the graphite furnace with 5 μL of 0.1% (m V−1) Al solution, 5 μL of 0.1% Sr (m V−1), and 5 μL of 100 mg L−1 Ag. Calibration curves were prepared from standard solutions of NaCl and PhCl, and these were compared. Samples which were above the calibration curve were diluted until they fell in the dynamic range.| Step | Temperature (°C) | Heating rate (°C s−1) | Holding time (s) | Gas flowa |
|---|---|---|---|---|
| a Gas flow max = 2.0 L min−1 Ar. b NP = no power. | ||||
| Drying 1 | 70 | 5 | 5 | Max |
| Drying 2 | 80 | 3 | 10 | Max |
| Drying 3 | 130 | 5 | 10 | Max |
| Drying 4 | 250 | 10 | 1 | Max |
| Pyrolysis | 600 | 100 | 20 | Max |
| Auto zero | 600 | 0 | 5 | Stop |
| AlCl vaporization | 2300 | 3000 | 2 | Stop |
| Cleaning | 2600 | 1000 | 4 | Max |
| Cooling down | 100 | NPb | 5 | Max |
3. Results and discussion
3.1. Selection of target molecule, wavelength, and modifiers
As described in the introduction, InCl, SrCl, and AlCl molecules have already been studied for chlorine determination by HR-CS-MAS. InCl was reported in air–acetylene flame MAS29 and by Machynak et al. in 2016 using a graphite furnace.35 Additionally, chloride was studied via molecular absorption of SrCl in coal, persistent organic pollutant chlorine (POP) in fish oil, and chlorine in milk samples.28,36,37By monitoring the absorption of the AlCl molecule, analytical methods have been developed for chlorine determination in complex matrices like rye flour,30 food samples,31 crude oil,33,38 and recently in water samples by isotope dilution using HR-CS-MAS.32 In the latter work, Nakadi et al. explained that the main absorption line of AlCl for the electronic transition A1Π ← X1Σ+ at a wavelength of 262.42 nm presents an isotopic splitting corresponding to the isotopologues Al37Cl and Al35Cl, as illustrated in Fig. 1A and B.
 | ||
| Fig. 1 (A) Time-resolved spectra of AlCl around a wavelength of 261.42 nm for 5 μL of 500 μg L−1 Cl solution, 5 μL of 0.1% (m V−1) Al solution, 5 μL of 1% (m V−1) Sr solution, and 5 μL 100 mg L−1 Ag solution. (B) The corresponding average spectrum of (A). | ||
Despite the isotopic broadening, the AlCl molecule offers a better detection limit by at least one order of magnitude (0.07 ng)30 compared to the SrCl molecule (0.8 ng)36 and the InCl molecule (0.1 ng),35 which is further prone to non-spectral interferences from acids and ions. Additionally, the maximal stable isotope variations of organic chlorine range between −6 to +7‰ relative to a defined primary isotopic reference material (with 0‰) called SMOC.39 Therefore, in the AlCl molecular spectra of natural samples, variations are expected not to be significant between different samples, at least for the first electronic transition. The full integration of the signal would avoid any error due to the isotopic bordering of the AlCl molecule. This integration of the signal is between the wavelengths 261.4150 nm and 261.4424 nm, which corresponds to ten pixels of the CCD camera of the instrument. The integration area is shown in Fig. 1B.
The methods described by Heitmann et al. and modified by Fechetia et al. were evaluated.30,31 It was observed that the addition of Al, Ag, and Sr solutions, used as modifiers, influences the determination of Cl via AlCl. This improvement can be explained by the formation of stable AgCl and SrCl molecules, which reduce the vaporization of Cl prior to AlCl formation. Spectral interferences due to other species coming from the modifier mixture were subtracted using the HR-CS-AAS instrument's built-in algorithm which was already described by Fechetia et al.31 A volume of 5 μL and an initial concentration of 1 g L−1 for one modifier was used, to evaluate the concentration of the other modifier, as shown in Fig. 2. The optimal concentrations were 100 mg L−1 for Ag+ and 1000 mg L−1 for Sr2+. Owing to the large bond energy of AlCl (502 KJ mol−1) and thus stability, this molecule is formed rather than other chloride molecules.40
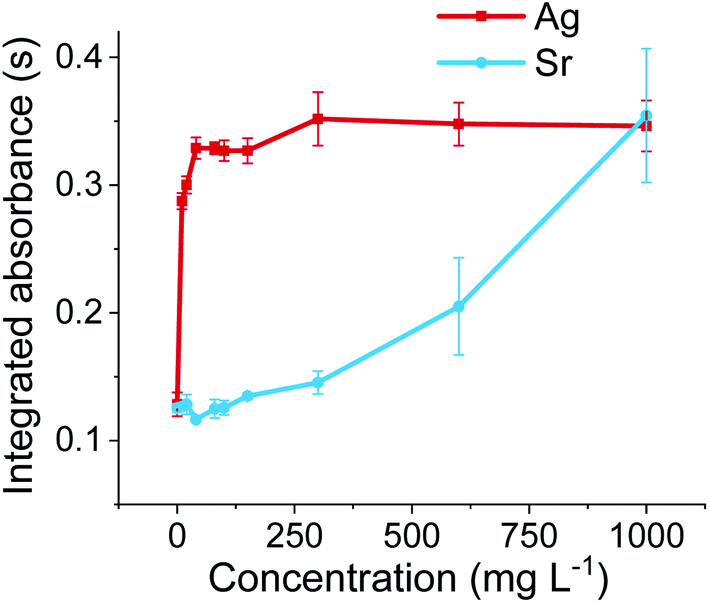 | ||
| Fig. 2 Influence of Ag+ and Sr2+ concentrations on the AlCl-integrated absorption signal. Fixed volumes of 5 μL Ag and 5 μL Sr were applied for a standard solution of 0.5 mg L−1 of Cl and 5 μL of a 0.1% Al (m V−1). | ||
As was reported in similar works on HR-CS-GF-MAS, the molecular formation of fluorides41 and other molecules like SrCl, AlBr, P2, CS, SnS, and GeS requires the use of a zirconium coating as a permanent modifier.34,42–46 Zirconium has been used as a permanent modifier because it protects the graphite surface from chemical degradation at high temperatures due to its high boiling point (4,377 °C), and it tends to form ceramic oxides with even higher thermal stability.41 In Fig. 3, the clear effect of the zirconium permanent modifier is observed.
 | ||
| Fig. 3 Influence of the graphite furnace zirconium permanent modifier on the AlCl absorption vs. time signal for the electronic transition A1Π ← X1Σ+ at a wavelength 262.42 nm. | ||
As SPE requires a non-polar solvent, the response of the AlCl signal was tested in the presence of varying methanol concentrations. A solution of 500 μg L−1 chlorophenol was prepared in 10–100% methanol, and the absorbance was compared to the response in 100% water. The relative response is shown in Fig. 4. It appears that methanol reduces the AlCl absorbance signal in approximately 20% to 80% methanol. It was observed that methanol breaks the surface tension of the sample, and this spreads the same over the graphite furnace's surface. It is assumed that the Al and Cl ions should be close for reaction. Therefore, a constant volume of 5 mL for a final concentration of 10% methanol was judged sufficient to separate the model compounds from the chloride matrix.
 | ||
| Fig. 4 Influence on the AlCl analytical signal for a chlorinated organic compound, chlorophenol, at a wavelength of 261.42 nm. The concentration of chlorine was 0.5 mg L−1 as chlorophenol. | ||
3.2. Optimization of the graphite furnace temperature program
The pyrolysis and atomization curves for AlCl were made for NaCl and chlorophenol (Fig. 5). The pyrolysis and vaporization temperatures do not differ drastically from those previously reported.30,31,33 A multi-step drying process was employed to avoid the boiling of the sample. If the sample dries fast and boils, the distribution of the analyte over the graphite furnace surface will not be homogeneous, which affects the atomization process, and consequently, the AlCl formation. Curves for NaCl and organochlorine compounds do not differ from each other. Calibration curves were performed with standard solutions of NaCl, PhCl, and TCP, and no significant differences were observed, as shown in Fig. 6. This reveals that the proposed method is chlorine atom specific and does not depend upon the chemical form, at least for the studied concentration range. | ||
| Fig. 5 Pyrolysis (right) and vaporization (left) curves for the AlCl molecule using 5 μL of the aqueous standard of 500 μg L−1 of Cl (NaCl and PhCl) and 5 μL of 0.1% (m V−1) Al solution, 1% Sr, and 100 mg L−1 Ag as chemical modifiers. | ||
 | ||
| Fig. 6 Calibration curves for PhCl, TCP and NaCl expressed as chlorine concentration. | ||
3.3. Interferences
The influence of non-metals on the AlCl absorption signal was investigated. Non-spectral interferences were observed for fluorine, bromine, and iodine, as presented in Table 2. Fluorine reduced the sensitivity at concentrations higher than 6 mg L−1 or a molar ratio F![[thin space (1/6-em)]](https://www.rsc.org/images/entities/char_2009.gif) :Cl higher than 22, and bromine reduced the sensitivity at concentrations higher than 50 mg L−1 or a molar ratio Br:Cl higher than 44. In the case of iodine, a signal drop was observed at concentrations higher than 100 mg L−1 or a molar ratio I:Cl higher than 56. At higher concentrations, these ions probably react with aluminum, competing with it and decreasing the amount of available Al for the formation of AlCl molecules. Nitric acid does not decrease the molecular absorption of AlCl.
:Cl higher than 22, and bromine reduced the sensitivity at concentrations higher than 50 mg L−1 or a molar ratio Br:Cl higher than 44. In the case of iodine, a signal drop was observed at concentrations higher than 100 mg L−1 or a molar ratio I:Cl higher than 56. At higher concentrations, these ions probably react with aluminum, competing with it and decreasing the amount of available Al for the formation of AlCl molecules. Nitric acid does not decrease the molecular absorption of AlCl.
| Element | Concentration/mg L−1 | Molar ratio X:Cl |
Relative intensity AlCl signal/% |
|---|---|---|---|
| F | 1 | 4 | 98 |
| 3 | 11 | 94 | |
| 6 | 22 | 95 | |
| 10 | 37 | 26 | |
| Br | 10 | 9 | 99 |
| 25 | 22 | 99 | |
| 50 | 44 | 90 | |
| 100 | 89 | 53 | |
| I | 25 | 14 | 102 |
| 50 | 28 | 96 | |
| 100 | 56 | 81 | |
| 200 | 112 | 60 |
3.4. Chlorine determination in water samples
Key parameters for the determination of chlorine in water are summarized in Table 3. These were obtained for a calibration curve with a 4-chlorophenol standard in 10% methanol, which simulates the matrix of the sample after preparation. Limit of detection and quantification were calculated from the calibration curve for chlorophenol aqueous standards in 10% methanol.| Parameter | |
|---|---|
| Integrated spectral region wavelength, nm | 261.4150–261.4424 |
| Number of pixels | 10 |
| Characteristic mass, ng | 0.022 |
| Limit of detection, ng | 0.048 |
| Limit of quantification, ng | 0.14 |
| R 2 coefficient | 0.9986 |
| Linear range, ng | 0.1–2.5 |
| Slope, s ng−1 | 0.1952 |
The preparation of synthetic matrices was chosen due to the simplicity of the guidelines, which are well documented in the DIN ISO standard. Five samples were prepared for three different inorganic chloride matrices for a total of 15 samples. These matrices simulate a range of chloride concentrations from seawater (≈2%) to tap water with high salinity (≈0.01%). In Table 4, results for chlorine determination via the AlCl molecule by HR-CS-GF-MAS are summarized. Successful extractions of organic chlorine were achieved using an SPE column for AOX. An average recovery rate of over 95% was obtained. Samples with low organic chlorine concentration (near the limit of quantification, 14 μg L−1) had a higher standard deviation. However, in these samples and those with much lower chlorine concentrations, pre-concentration with an SPE column can be performed. Based on a t-test analysis, no statistically significant differences were found between the known concentration and the measurements by HR-CS-MAS.
| Sample # | Known chlorine/μg L−1 | Measured chlorinea/μg L−1 | Recovery rate/% | |
|---|---|---|---|---|
| a Uncertainties are reported as the relative standard deviation for n = 3 corresponding to a level of confidence of 95% (k = 2). | ||||
| Matrix with inorganic [Cl−] 2% | 1 | 1006.90 ± 0.30 | 1018.2 ± 5.9 | 101.12 |
| 2 | 503.45 ± 0.91 | 518.1 ± 12.8 | 102.91 | |
| 3 | 100.69 ± 0.58 | 96.8 ± 2.9 | 96.09 | |
| 4 | 50.45 ± 0.54 | 48.4 ± 3.2 | 95.86 | |
| 5 | 25.17 ± 0.27 | 19.1 ± 5.1 | 75.80 | |
| Matrix with inorganic [Cl−] 1% | 6 | 1006.90 ± 0.30 | 991.0 ± 9.2 | 98.42 |
| 7 | 503.45 ± 0.91 | 495.1 ± 9.9 | 98.34 | |
| 8 | 100.69 ± 0.58 | 88.6 ± 17.9 | 88.02 | |
| 9 | 50.45 ± 0.54 | 45.4 ± 3.3 | 89.91 | |
| 10 | 25.17 ± 0.27 | 30.0 ± 11.0 | 119.23 | |
| Matrix with inorganic [Cl−] 0.01% | 11 | 1006.90 ± 0.30 | 982.3 ± 6.9 | 97.56 |
| 12 | 503.45 ± 0.91 | 487.1 ± 5.9 | 96.75 | |
| 13 | 100.69 ± 0.58 | 92.6 ± 1.8 | 91.99 | |
| 14 | 50.45 ± 0.54 | 48.4 ± 4.2 | 95.86 | |
| 15 | 25.17 ± 0.27 | 20.1 ± 9.0 | 79.82 | |
Using a combination of modifiers, this work improves the current methods for chlorine determination of the AlCl molecule by HR-CS-GF-MAS. In Table 5, the present research is compared with those methods reported previously. Only chlorine determination by isotope dilution HR-CS-GF-MAS is better by one order of magnitude.
| Heitmann et al. 2006 (ref. 30) | Fechetia et al. 2012 (ref. 31) | Nakadi et al. 2015 (ref. 32)a | Enders et al. 2016 (ref. 33) | This work | |
|---|---|---|---|---|---|
| a Isotope dilution HR-CS-MAS. b Absolute values. | |||||
| Sample | Rye flour | Food | Water | Crude oil | Water |
| Modifiers | Sr | Ag/Sr | Pd | Sr | Ag/Sr/Zr |
| m 0 /ng | 0.3 | 2.4 | — | 0.28 | 0.02 |
| LODb/ng | 0.07 | 1.2 | 0.003 | 2.1 | 0.05 |
4. Conclusions
This work demonstrates the potential of HR-CS-GF-MAS for the rapid determination of organic chlorine in water samples. Due to the atom specificity, only a simple sample separation from inorganic chloride is required. The combination of a zirconium permanent modifier with Ag and Sr solutions enhances the analytical signal. This is probably through the formation of stable molecules, which prevent the volatilization of chlorine and promotes the pyrolysis of the organic molecules. Several non-spectral interferences were observed from halogen atoms. This is probably through the competitive formation of AlX species. To date, this is the most sensitive method for chlorine determination via HR-CS-MAS, and it can be used for samples with very low organic chlorine concentration, provided that SPE is used for preconcentration.Conflicts of interest
There are no conflicts of interest to declare.Acknowledgements
Financial support by the Deutsche Forschungsgemeinschaft (DFG) within the School of Analytical Sciences Adlershof (SALSA) is gratefully acknowledged. The authors thank Analytical Jena GmbH for providing the instrumentation and technical support.References
- C. Abad, S. Mimus, S. Recknagel, N. Jakubowski, U. Panne, H. Becker-Ross and M.-D. Huang, Guidelines for Drinking-Water Quality, World-Health-Organization, 2011 Search PubMed.
- M. C. Contreras López, Environ. Int., 2003, 28, 751–759, DOI:10.1016/s0160-4120(02)00120-4.
- K. Magulova and A. Priceputu, Environ. Pollut., 2016, 217, 82–84, DOI:10.1016/j.envpol.2016.01.022.
- S. Vaughan, EU Chemicals Regulation: New Governance, Hybridity and REACH, Edward Elgar Publishing, 2015 Search PubMed.
- U.S. Federal Government, Federal Water Pollution Control Act Amendments of 1972, 33 U.S.C. §1251 et seq Search PubMed.
- U.S. Federal Government, Federal Safe Drinking Water Act, 1974, 42 U.S.C. §300f et seq Search PubMed.
- D. A. Miranda and G. T. Yogui, Sci. Total Environ., 2016, 569–570, 1510–1516, DOI:10.1016/j.scitotenv.2016.06.241.
- R. Gerber, N. J. Smit, J. H. J. Van Vuren, S. M. M. Nakayama, Y. B. Yohannes, Y. Ikenaka, M. Ishizuka and V. Wepener, Sci. Total Environ., 2016, 550, 522–533, DOI:10.1016/j.scitotenv.2016.01.129.
- Y. J. Wang and J. K. Lin, Arch. Environ. Contam. Toxicol., 1995, 28, 537–542, DOI:10.1007/BF00211639.
- K. Kümmerer, in Pharmaceuticals in the Environment: Sources, Fate, Effects and Risks, ed. K. Kümmerer, Springer, Berlin, Heidelberg, 2008, pp. 3–21, DOI:10.1007/978-3-540-74664-5_1.
- J. L. Martinez, Environ. Pollut., 2009, 157, 2893–2902, DOI:10.1016/j.envpol.2009.05.051.
- R. Gothwal and T. Shashidhar, Clean: Soil, Air, Water, 2015, 43, 479–489, DOI:10.1002/clen.201300989.
- D. Henschler, Angew. Chem., Int. Ed. Engl., 1994, 33, 1920–1935, DOI:10.1002/anie.199419201.
- S. Ramamoorthy and S. Ramamoorthy, Chlorinated Organic Compounds in the Environment: Regulatory and Monitoring Assessment, CRC Press, 1997 Search PubMed.
- J. Oleksy-Frenzel, S. Wischnack and M. Jekel, Fresenius. J. Anal. Chem., 2000, 366, 89–94, DOI:10.1007/s002160050016.
- Water quality – determination of adsorbable organically bound halogens (AOX), DIN EN ISO 9562:2005-2.
- P. A. Mello, J. S. Barin, F. A. Duarte, C. A. Bizzi, L. O. Diehl, E. I. Muller and E. M. Flores, Anal. Bioanal. Chem., 2013, 405, 7615–7642, DOI:10.1007/s00216-013-7077-9.
- X. Bu, T. Wang and G. Hall, J. Anal. At. Spectrom., 2003, 18, 1443, 10.1039/b306570g.
- X. Hou, R. S. Amais, B. T. Jones and G. L. Donati, in Encyclopedia of Analytical Chemistry, ed. R. A. Meyers, 2016, DOI:10.1002/9780470027318.a5110.pub3.
- T. W. May and R. H. Wiedmeyer, At. Spectrosc., 1998, 19, 150–155 CAS.
- K. Laniewski, J. Dahlén, H. Borén and A. Grimvall, Chemosphere, 1999, 38, 771–782, DOI:10.1016/S0045-6535(98)00217-3.
- B. Welz, H. Becker-Ross, S. Florek and U. Heitmann, High-Resolution Continuum Source AAS: The Better Way to Do Atomic Absorption Spectrometry, Wiley-VCH Verlag GmbH & Co. KGaA, 2006 Search PubMed.
- C. Abad, S. Florek, H. Becker-Ross, M.-D. Huang, H.-J. Heinrich, S. Recknagel, J. Vogl, N. Jakubowski and U. Panne, Spectrochim. Acta, Part B, 2017, 136, 116–122, DOI:10.1016/j.sab.2017.08.012.
- K. Dittrich, J. Funk and G. Werner, Anal. Chim. Acta, 1984, 160, 227–233 CrossRef CAS.
- R. Medeiros, S. O. Souza, R. G. O. Araujo, D. R. da Silva and T. A. Maranhao, Talanta, 2018, 176, 227–233, DOI:10.1016/j.talanta.2017.08.026.
- M. A. Bechlin, E. C. Ferreira and J. A. Gomes Neto, Microchem. J., 2017, 132, 130–135, DOI:10.1016/j.microc.2017.01.019.
- A. Guarda, M. Aramendia, I. Andres, E. Garcia-Ruiz, P. C. do Nascimento and M. Resano, Talanta, 2017, 162, 354–361, DOI:10.1016/j.talanta.2016.10.039.
- N. Ozbek and S. Akman, J. Agric. Food Chem., 2016, 64, 5767–5772, DOI:10.1021/acs.jafc.6b02024.
- M. D. Huang, H. Becker-Ross, S. Florek, U. Heitmann and M. Okruss, Spectrochim. Acta, Part B, 2006, 61, 959–964, DOI:10.1016/j.sab.2006.08.004.
- U. Heitmann, H. Becker-Ross, S. Florek, M. D. Huang and M. Okruss, J. Anal. At. Spectrom., 2006, 21, 1314–1320, 10.1039/b607384k.
- M. Fechetia, A. L. Tognon and M. A. M. S. da Veiga, Spectrochim. Acta, Part B, 2012, 71–72, 98–101, DOI:10.1016/j.sab.2012.04.003.
- F. V. Nakadi, M. A. M. S. da Veiga, M. Aramendía, E. García-Ruiz and M. Resano, J. Anal. At. Spectrom., 2015, 30, 1531–1540, 10.1039/c5ja00055f.
- M. S. P. Enders, A. O. Gomes, R. F. Oliveira, R. C. L. Guimarães, M. F. Mesko, E. M. M. Flores and E. I. Müller, Energy Fuels, 2016, 30, 3637–3643, DOI:10.1021/acs.energyfuels.5b02100.
- M. D. Huang, H. Becker-Ross, M. Okruss, S. Geisler, S. Florek, S. Richter and A. Meckelburg, Spectrochim. Acta, Part B, 2014, 94–95, 34–38, DOI:10.1016/j.sab.2014.02.005.
- Ľ. Machyňák, F. Čacho, M. Němeček and E. Beinrohr, Spectrochim. Acta, Part B, 2016, 125, 140–145, DOI:10.1016/j.sab.2016.10.006.
- É. R. Pereira, L. M. Rocha, H. R. Cadorim, V. D. Silva, B. Welz, E. Carasek and J. B. de Andrade, Spectrochim. Acta, Part B, 2015, 114, 46–50, DOI:10.1016/j.sab.2015.10.001.
- É. R. Pereira, J. Merib, H. R. Cadorim, M. Schneider, G. S. Carvalho, F. A. Duarte, B. Welz, J. d. C. Menoyo and J. Feldmann, Food Control, 2017, 78, 456–462, DOI:10.1016/j.foodcont.2017.03.015.
- Y. Nakamoto, Bunseki Kagaku, 2000, 49, 881–885 CrossRef CAS.
- W. A. Brand, T. B. Coplen, J. Vogl, M. Rosner and T. Prohaska, Pure Appl. Chem., 2014, 86(3), 425–467, DOI:10.1515/pac-2013-1023.
- Y. R. Luo, Comprehensive Handbook of Chemical Bond Energies, CRC Press, 2007 Search PubMed.
- C. Abad, S. Florek, H. Becker-Ross, M.-D. Huang, A. G. Buzanich, M. Radtke, A. Lippitz, V.-D. Hodoroaba, T. Schmid, H.-J. Heinrich, S. Recknagel, N. Jakubowski and U. Panne, J. Anal. At. Spectrom., 2018, 33, 2034–2042, 10.1039/C8JA00190A.
- B. Welz, M. G. R. Vale, É. R. Pereira, I. N. B. Castilho and M. B. Dessuy, J. Braz. Chem. Soc., 2014, 25, 799–821, DOI:10.5935/0103-5053.20140053.
- M. D. Huang, H. Becker-Ross, M. Okruss, S. Geisler and S. Florek, Spectrochim. Acta, Part B, 2016, 115, 23–30, DOI:10.1016/j.sab.2015.10.007.
- M. D. Huang, H. Becker-Ross, S. Florek, U. Heitmann and M. Okruss, Spectrochim. Acta, Part B, 2008, 63, 566–570, DOI:10.1016/j.sab.2008.02.005.
- M. D. Huang, H. Becker-Ross, S. Florek, C. Abad and M. Okruss, Spectrochim. Acta, Part B, 2017, 135, 15–21, DOI:10.1016/j.sab.2017.06.012.
- C. Abad, S. Florek, H. Becker-Ross, M.-D. Huang, F. Lopez-Linares, L. Poirier, N. Jakubowski, S. Recknagel and U. Panne, Spectrochim. Acta, Part B, 2019, 160, 105671, DOI:10.1016/j.sab.2019.105671.
| This journal is © The Royal Society of Chemistry 2021 |