On a separation voltage polarity switching transient capillary isotachophoresis method for higher sample loading capacity and better separation performance†
Ji
Tang
 a,
Huanming
Wu
 *ab,
Jun Jack
Hu
 *a,
Jiancheng
Yu
b,
Junliang
Zhang
 b,
Chenlu
Wang
a,
Tao
Yin
c and
Keqi
Tang
 *a
*a
aZhejiang Provincial Key Laboratory of Advanced Mass Spectrometry and Molecular Analysis, Institute of Mass Spectrometry, School of Material Science and Chemical Engineering, Ningbo University, Ningbo, 315211, P. R. China. E-mail: wuhuanming@nbu.edu.cn
bFaculty of Electrical Engineering and Computer Science, Ningbo University, Ningbo 315211, P. R. China
cInstitute of Semiconductors, Chinese Academy of Sciences, Beijing, 100083, P. R. China
First published on 1st October 2020
Abstract
Limited sample loading capacity is one of the major reasons that prevents the utility of capillary electrophoresis (CE) as a routine separation method as compared to liquid chromatography (LC). In our previous study, separation voltage polarity switching transient capillary isotachophoresis (PS-tCITP) was proposed. Both sample loading capacity and separation resolution could be improved using a single PS-tCITP instead of routine transient capillary isotachophoresis (tCITP). In this study, a detailed investigation on the optimization strategy of the PS-tCITP method was performed systematically. A possible mechanism of sample preconcentration in multiple PS-tCITP was first proposed to better understand the multiple PS-tCITP process. Several optimization experiments were then performed, including single PS-tCITP, paused PS-tCITP and multiple PS-tCITP, sequentially using a mixture of five peptides. By selecting an optimum polarity switching time, sample loading capacity of 100% capillary volume could be achieved in a single PS-tCITP. Introducing an additional pause between each polarity switching in a single PS-tCITP further improved the separation resolution. Experimental results showed a baseline separation of five selected peptide standards at 100% sample loading volume using a 100 min pause in a single PS-tCITP. To further improve separation efficiency while still maintaining 100% sample loading volume, a multiple PS-tCITP technique was developed through this study. Compared to the separation performance of the optimal single PS-tCITP at 100% sample loading volume with a 10 min pause, the separation window was improved by 54% and the peak capacity was improved by 48% in the optimal four PS-tCITP with the same sample loading volume and pause.
Introduction
Capillary electrophoresis (CE) is considered as a promising alternative separation technique to liquid chromatography (LC) due to its advantages of high separation efficiency, relatively short analysis time and low sample consumption.1 However, compared to the microliter scale of sample loading capacity in LC, only 1–2% of the total capillary volume of sample, which is in the tens of nanoliter scale, could be loaded in a capillary zone electrophoresis (CZE) in order to maintain a good separation quality. Limited sample loading capacity is considered as one of the major reasons that prevents the utility of CE as a routine sample separation method.To increase the sample loading capacity of CE without significantly sacrificing its separation quality, various in-capillary preconcentration techniques were developed, including field-amplified sample stacking (FASS),2,3 large volume sample stacking (LVSS),4–7 dynamic pH junction,8,9 and transient capillary isotachophoresis (tCITP).10–12 In FASS, a large sample loading volume requires a high conductivity ratio of sample and separation electrolyte, since the increment of sample loading volume is determined by a factor equal to the conductivity ratio of the sample and separation electrolyte.2 Under typical FASS conditions, a sample loading volume is limited to be less than 5% of the capillary volume to promise good separation quality.3 If more than 90% of capillary volume sample stacking, so called LVSS, is requested, the low-conductivity sample matrix after FASS concentration should be removed prior to separation. The precise control of the removal of sample matrix is a difficult task, whether or not using the methods with4,5 or without polarity switching.6,7 In a dynamic pH junction, the pH difference at the boundary between amphiprotic analytes and electrolyte would cause sample concentration, and usually no more than half of capillary volume could be loaded to promise relatively high separation quality.8 Using a home-made high-quality neutral coating instead of commercial coated capillary in the dynamic pH junction, still very high separation efficiency for proteins could be achieved when 50% of the capillary was filled with samples.9 Transient CITP is a hybrid CTIP and CZE method and could selectively enrich low-concentration analytes. By using tCITP, the sample loading volume could be increased from the nanoliter range to several microliters.10–12 However, usually beyond 40% of capillary volume was not recommended in tCITP, since significant degrading of sample separation resolution would occur. The separation resolution loss at a relatively large sample loading in tCITP could be avoided by combining the LVSS technique. A preconcentration method named large-volume dual preconcentration by isotachophoresis and stacking (LDIS) was developed, in which LVSS first preconcentrated the sample into quite broadened peaks, and then tCITP further focused the preconcentrated broadened sample peaks without losing resolution. In the analysis of ATPS-labeled glucose ladder using the LDIS technique, up to a 2300-fold sensitivity increase was achieved with high separation resolution.13 Combination of LVSS with dynamic pH junction techniques was also reported.14,15
More than one capillary volume of sample loading could be realized by a multicycle sample injection technique in recent years. A multiple-isotachophoresis (M-ITP) based on the repetition of successive cycles of hydrodynamic injection (HD) and isotachophoresis (ITP) was proposed. Enrichment of a sample plug representing up to 300% of the total capillary length was successfully demonstrated by 9 HD-ITP cycles. The M-ITP technique was also combined with a dynamic pH junction for enrichment and succeeding separation of the Aβ 1–40 amyloid peptide via UV detection, and a limit of detection of 50 nM was achieved.16 A multiple pressure-assisted large-volume sample stacking with an electroosmotic flow pump (M-PA-LVSEP) coupled with CZE was developed to allow enrichment and separation of analytes sequentially from more than one capillary volume. Analysis of a sample plug representing up to 400% of the total capillary length was successfully achieved by 8 cycles on several Aβ peptides, and down to 0.05 nM quantification limit was obtained via laser-induced fluorescence detection. The M-PA-LVSEP method was automated, relying on a precise estimation of the timing of sample matrix removal among cycles with a mathematical model.17
Mass spectrometry (MS) coupled with CE has been demonstrated as an effective technique in chemical and biological sample analyses due to its high sensitivity. The limit of detection on peptide analysis could reach 1 zmol using an ultra-sensitive CE-MS system.18 Preconcentration techniques such as dynamic pH junction and tCITP are readily applied in CE-MS and numerous applications were reported,19–22 while techniques requiring complex sample matrix removal operation were rarely adopted in CE-MS. In our previous study, we proposed a new in-capillary sample preconcentration technique named separation voltage polarity switching transient capillary isotachophoresis (PS-tCITP), which could not only improve the performances of sample loading capacity and separation resolution, but was also easy to be implemented in CE-MS with only a polarity switchable high voltage supply.23 Using PS-tCITP, with only a single polarity switching of the separation voltage, the sample loading volume could be increased to 70% of the total capillary volume and separation resolution could be improved by 21% as compared to the traditional tCITP at the same sample loading volume. One primary goal of this study is to further optimize the PS-tCITP technique. To gain a fundamental understanding of the PS-tCITP sample preconcentration/separation process, a possible mechanism of the sample preconcentration in multiple PS-tCITP was first proposed, and then detailed experimental investigations on single PS-tCITP, paused PS-tCITP and multiple PS-tCITP were performed sequentially to characterize the achievable sample loading capacity and separation quality in each of these methods.
Experimental section
Sample preparation
Kemptide, bradykinin, angiotensin I, neurotensin, and angiotensin II were purchased from MedChemExpress (1 Deer Park Dr, Suite Q, Monmouth Junction, NJ) and used without further purification. Ammonium acetate, hydroxylpropyl cellulose, methanol, and acetic acid were purchased from Sigma-Aldrich (St Louis, MO). Hydrochloric acid was purchased from Zhongxing Chemical Reagent Co., Ltd (Zhejiang Province, China).The sample preparation procedure was identical to our previous work.23 Briefly, all the buffers and samples used in the experiments were prepared with pre-filtered deionized water. The background electrolyte (BGE) solution was a solution of 0.1 M acetic acid in a 9![[thin space (1/6-em)]](https://www.rsc.org/images/entities/char_2009.gif) :
:![[thin space (1/6-em)]](https://www.rsc.org/images/entities/char_2009.gif) 1 volume ratio of deionized water to methanol. The leading electrolyte (LE) solution was a solution of 25 mM ammonium acetate in deionized water with pH adjusted to 4 using acetic acid. Individual stock solutions of five peptide standards including kemptide, bradykinin, angiotensin I, neurotensin, and angiotensin II were first prepared at 2 mM concentration in deionized water. The individual peptide stock solutions were then mixed and diluted with LE solution to form a peptide mixture stock solution at 2 μM of each peptide for all PS-tCITP experiments.
1 volume ratio of deionized water to methanol. The leading electrolyte (LE) solution was a solution of 25 mM ammonium acetate in deionized water with pH adjusted to 4 using acetic acid. Individual stock solutions of five peptide standards including kemptide, bradykinin, angiotensin I, neurotensin, and angiotensin II were first prepared at 2 mM concentration in deionized water. The individual peptide stock solutions were then mixed and diluted with LE solution to form a peptide mixture stock solution at 2 μM of each peptide for all PS-tCITP experiments.
Experimental setup
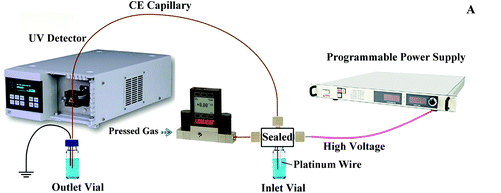
Fig. 1 shows the experimental setup used in this study, in which the power supply of our pervious setup was upgraded to a programmable power supply (PRE30R10, purchased from Wisman High Voltage Power Supply Corporation, Xi'an, China) for a better voltage polarity switching control. A 360 μm o.d., 50 μm i.d., and 100 cm long fused-silica separation capillary (Polymicro Technologies, Phoenix, AZ) was chosen in this study. An ECOM ECD2600 UV detector (ECOM spol. s r.o., Czech Republic) was used to detect the ultraviolet absorbance of the peptides in the capillary at the point 10 cm away from its terminating end. The inner surface of the separation capillary was coated with hydroxypropyl cellulose to suppress the electroosmotic flow. The coating procedure was same as the one used in our previous work.11The sample was loaded into the separation capillary by applying a 13 psi (about 90 kPa) nitrogen back pressure to the sample inlet vial. The gas pressure was controlled using a digital pressure controller (PCD-Series, Alicat Scientific, Tucson, AZ). The sample loading volume was precisely controlled by varying the loading time as described in our previous work.23 After the sample loading, the sample inlet vial was replaced by the BGE inlet vial and the nitrogen back pressure was set to zero. A 25 kV separation voltage was applied to the BGE inlet vial for PS-tCITP separation. The separation voltage polarity switching was carried out according to a programmed time sequence during the experiment. Upon the completion of each sample separation, the 13 psi nitrogen back pressure was reapplied to the inlet vial and the separation capillary was preconditioned by flushing BGE through the capillary.
Preconcentration procedure of PS-tCITP
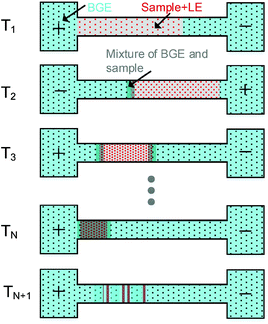
In our previous study, only a single polarity switching of the separation voltage was used in PS-tCITP.23 Here, we extend the voltage polarity switching in PS-tCITP to multiple times. The sample preconcentration procedure in PS-tCITP can be easily visualized as shown in Fig. 2. After the completion of sample loading step at time T1, a positive separation voltage is applied and all the analyte ions in the sample plug start to move towards the capillary outlet. Once the LE ions with the largest mobility as compared to the mobilities of all the analyte ions have all moved to the front of the sample plug, the analyte ions start to stack/concentrate under an isotachophoresis process. At a selected time T2 before the completion of the sample stacking process, the polarity of the separation voltage is switched and a negative voltage is applied to the separation capillary which causes all the ions in the sample plug to move in the opposite direction. The fast moving LE ions would penetrate through the partially stacked sample band, and a sample stacking process will start again once all the LE ions have moved to the front at the back end of the sample plug. By this sample mechanism, the sample plug is expected to be squeezed to a shorter length consecutively by each separation voltage polarity switching from T3 to TN. It should be noted that during the preconcentration procedure from T1 to TN, the BGE ions would gradually mix with the both ends of the sample plug, therefore resulting in the partial separation of sample bands. Upon the completion of the polarity switching step at TN, the sample ion band would be separated in a CZE process at time TN+1 after the completion of the sample stacking process following the last polarity switching step. Based on the description in Fig. 2, an optimized multiple PS-tCITP should allow a maximum length of capillary for CZE sample separation after the completion of the sample stacking process. Under the best conditions, the position of the concentrated sample plug upon the completion of the polarity switching step at time TN should be right at the inlet of the capillary to allow the following CZE separation at essentially a full length of the capillary for a maximum sample separation resolution. The key to realize these optimum multiple PS-tCITP conditions is to select optimum times in the voltage polarity switching step which requires a detailed experimental characterization.In this study, we aim to systematically investigate the voltage polarity switching strategy on the performances of sample loading capacity and separation quality in PS-tCITP. The timing of voltage polarity switching in a single PS-tCITP was first investigated to obtain an optimum value. Different pause times between the voltage polarity switching, during which the separation voltage was set to zero, were added in a single PS-tCITP to evaluate their effects on the separation quality. It was believed that the added pause time between the voltage polarity switching would allow the diffusion of the partially stacked sample plug, which would make the sample stacked process more efficient at each polarity switching step. Upon the completion of the single PS-tCITP optimization, multiple PS-tCITP (more than one polarity switching of the separation voltage) was further explored and its performance was compared with the optimized single PS-tCITP.
Single PS-tCITP
In our previous study, to prevent the sample from leaking out of the capillary inlet, positive separation voltage was first applied for 8 minutes and then a relatively shorter negative separation voltage duration of 5.5 minutes was chosen. Here, we found that even a slightly longer duration of negative separation voltage than the initial positive separation voltage duration can be used without sample loss. For example, nine minute negative voltage can be used after an eight minute positive voltage in a single PS-tCITP. For the purpose of consistency, the same durations for both positive separation voltage and negative separation voltage were used in all the PS-tCITP experiments, and this separation voltage polarity switching strategy of the same durations was also recommended in a new analyte separation to effectively prevent sample loss according to our experience. In a single PS-tCITP, one complete operation sequence of separation voltage polarity switching at a 8 min polarity switching time would include (a) an 8 minute positive separation voltage, (b) an 8 minute negative separation voltage, and (c) the switching back of the positive separation voltage with the time needed for the detection of all the analyte peaks. This optimum polarity switching sequence was obtained experimentally by gradually increasing the polarity switching time from 0 minute to 16 minutes with a 1 minute interval at two separate sample loading volumes of 70% and 100% capillary volume, respectively. The separation quality of the five peptides was carefully compared among each selected polarity switching time.Paused PS-tCITP
When a pause time was added between the polarity switching, a 10 minute polarity switching time in a single PS-tCITP at the sample loading volume of 100% capillary volume showed a better separation quality compared to the ones using other polarity switching times. During the pause time, the separation voltage was turned off. Specifically, in a 5 min paused PS-tCITP experiment, a positive separation voltage of 25 kV was applied for the first 10 min and turned off for a 5 min pause time. After the pause time, the separation voltage was switched to negative 25 kV for 10 minutes followed by another 5 min pause time. After the completion of the 30 min pause time switching sequence, the separation voltage was switched back to positive 25 kV and maintained for the remaining separation. Five different pause times, including 0, 5, 10, 30 and 100 min, were used in this set of experiments and their performances of separation quality were evaluated.Multiple PS-tCITP
In multiple PS-tCITP, the complete voltage polarity switching sequence in a single PS-tCITP was repeated multiple times. It was found experimentally that for a given number of polarity switching times, there existed a maximum polarity switching time beyond which the multiple PS-tCITP technique would fail completely. This essentially means that the more the separation voltage polarity switching times, the shorter the polarity switching time. The possible reason behind this experimental finding could be attributed to the penetration of BEG ions through the sample plug when the polarity switching time becomes too long at each giving number of polarity switching times. Specifically, 7 min polarity switching time worked well for a two PS-tCITP and 5 min polarity switching time worked efficiently for a four PS-tCITP. The operation schedule of separation voltage polarity switching was programmed in the power supply and run automatically.Results and discussion
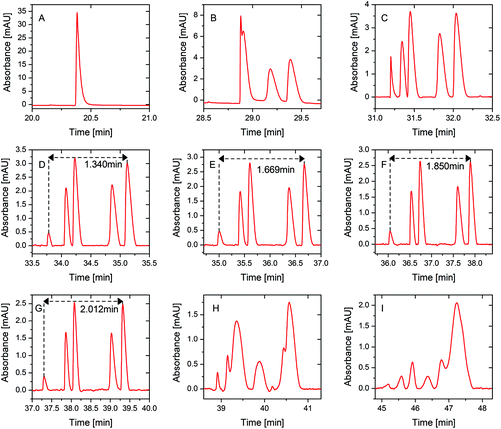
A mixture of five peptide standards at 70% sample loading volume, which was the same as the sample loading volume used in our pervious study,23 was first used to verify the separation performance improvement of PS-tCITP versus tCITPs in a size updated capillary. In tCITP separation, the peaks of five peptide standards were merged together (Fig. 3A), while these five peaks were baseline separated by a single PS-tCITP at an 8 minute polarity switching time (Fig. 3D). Those five peptide standards in order of migration time were kemptide, bradykinin, angiotensin I, neurotensin and angiotensin II.Fig. 3 shows selectively a set of single PS-tCITP experimental results, in which the polarity switching time varied from 0 minute to 16 minutes with a 1 minute interval. The sample loading volume was maintained at 70% of capillary volume. Fig. 3A shows a merged peak of tCITP separation without using separation voltage polarity switching. The five peaks of peptide standards increasingly separated from each other as the polarity switching time of PS-tCITP was increased. At 11 min polarity switching time, as shown in Fig. 3G, separation reached optimum conditions at which five peaks were baseline separated from each other with the highest resolution. Beyond the 11 min polarity switching time, as shown in Fig. 3H and I, the separation quality degraded significantly. The five peaks overlapped again and could not be recognized. The primary reason for the degrading of separation quality beyond 11 min polarity switching time is that the sample stacking process has already completed before the separation voltage polarity switching and the stacked peptide peaks have started to be pulled apart by the CZE separation. Therefore, the polarity switching time of PS-tCITP should be chosen carefully to make sure that the isotachophoresis process has not been switched to pure CZE separation before the separation voltage polarity switching.
To confirm the conclusion that an optimal polarity switching time would exist in a single PS-tCITP, the sample loading volume was increased to 100% of capillary volume. In this set of experiments, the polarity switching times of PS-tCITP were also varied from 0 minute to 16 minutes with a 1 minute interval. The whole evolution process of results was identical to the results at 70% sample loading volume. Only four UV records at polarity switching times of 0, 6, 10 and 16 min are selectively shown in Fig. 4. The complete set of the experimental data is shown in Fig. S1.† From this set of experimental measurements, the optimal polarity switching time of PS-tCITP at 100% sample loading volume was 10 min, slightly shorter than the optimal polarity switching time of PS-tCITP at 70% sample loading volume. As the sample loading volume increased from 70% to 100%, the height of peaks for all the peptides were all significantly increased at the optimal polarity switching times (e.g. by comparing the experimental results shown in Fig. 4C and 3G). Specifically for the angiotensin II peak, the peak height increased from 2.46 at 70% sample loading volume to 4.40 at 100% sample loading volume. Meanwhile, the separation resolution at 100% sample loading volume slightly degraded as indicated by the five non baseline resolved peaks even at an optimum polarity switching time (Fig. 4C).
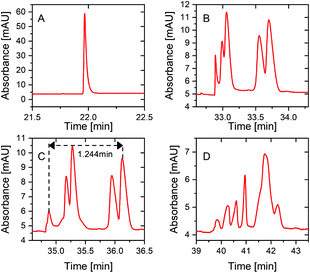 | ||
| Fig. 4 Single PS-tCITP separation of five peptide standard mixture at 100% sample loading with different polarity switching times at (A) 0 min, (B) 6 min, (C) 10 min and (D) 16 min. | ||
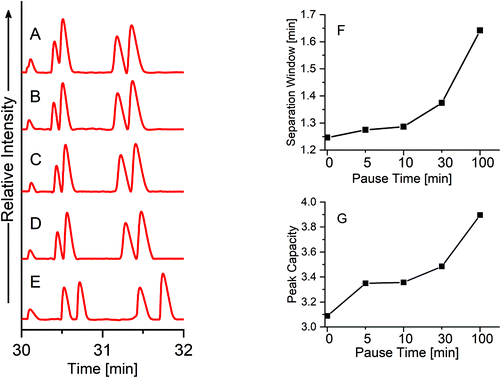
In order to further improve the separation resolution of the single PS-tCITP at 100% sample loading volume, a pause time was added between each polarity switching. Five different pause times, including 0, 5, 10, 30 and 100 min, were used to systematically study its effect on the separation resolution. As shown in Fig. 5, the separation window/resolution gradually increases as the pause increases, and five peaks were completely baseline separated with a 100 min pause time (Fig. 5E). As further shown in Fig. 5F and G, both migration window and peak capacities, calculated as the averaged peak width at half maxima (FWHM) divided by the migration window, increase as the pause time increases. The FWHM and the area of each peak in Fig. 5A–E are calculated and shown in Table S1† in the ESI,† which indicates a slight sample loss at an extended pause time. Good reproducibility of the paused PS-tCITPs are shown in Fig. S2 and Table S2.† Significant sample loss was observed experimentally when the pause time was further increased to 300 min (data not shown). The exact reason for the sample loss at the extended pause time is unclear. However, the experimental results firmly indicate that an over-extended pause time in PS-tCITP was not desirable for the measurement sensitivity.
To potentially further increase the separation resolution at 100% sample loading volume, the multiple PS-tCITP technique was explored in this study. Based on the early analysis on the preconcentration mechanism of PS-tCITP in Fig. 2, it is critical to select optimum polarity switching times based on the number of polarity switching (N) used for a specific multiple PS-tCITP so that an optimum TN can be obtained to allow maximum separation window. The optimum polarity switching times were carefully tested experimentally using different numbers of PS-tCITP. Fig. 6 shows the experimental results for two and four PS-tCITP separation of five peptides in which 7 min and 5 min polarity switching times were identified as the corresponding optimum polarity switching times.
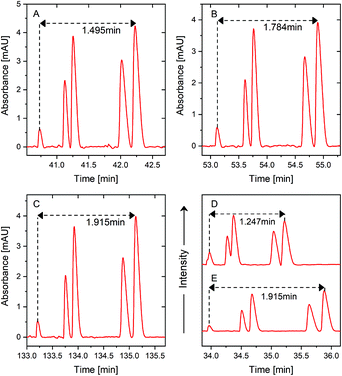
Fig. 6A shows the two PS-tCITP with 7 min polarity switching time. Five peptide peaks were completely baseline separated, which is significantly better than the separation for the optimal single PS-tCITP as shown in Fig. 4C. Using a four PS-tCITP with an optimal 5 min polarity switching time as shown in Fig. 6B, a further improvement in separation resolution was achieved as compared to using a two PS-tCITP with 7 min polarity switching time. Specifically, the separation window was increased by 19.3% using a four PS-tCITP (Fig. 6B) as compared to that using a two PS-tCITP (Fig. 6A). Adding a pause time between each separation voltage polarity switching was shown to further improve the PS-tCITP separation resolution. Fig. 6C shows a four PS-tCITP at 5 min polarity switching time with a 10 min pause time, which showed an improvement in separation resolution as compared to the four PS-tCITP without a pause time. Specifically, a 7.5% increase in the separation window was measured by comparing the experimental data shown in Fig. 6B. In the last stacked graphs of Fig. 6D and E, we compared the separation performance of the optimal single PS-tCITP at a polarity switching time of 10 min with a 10 min pause and the optimal four PS-tCITP at a polarity switching time of 5 min with the same 10 min pause. Compared to the optimal single PS-tCITP, an improvement of 53% on the separation window and 48% on the peak capacity was achieved in the optimal four PS-tCITP.
Conclusions
Through a detailed experimental investigation, optimal separation voltage polarity switching times were identified in a single PS-tCITP with both 70% and 100% sample loading volume, respectively. Increasing polarity switching time initially improves the separation window in a single PS-tCITP. However, separation quality starts to degrade beyond an optimum polarity switching time. Adding a pause time between each separation voltage polarity switching improves the separation resolution in both single PS-tCITP and multiple PS-tCITP. In general, separation resolution increases as the pause time increases which eventually will result in a significant sample loss affecting the measurement sensitivity. By carefully optimizing the polarity switching time and pause time, multiple PS-tCITP can further improve the separation resolution as compared to single PS-tCITP. Compared to the separation performance of the optimal single PS-tCITP at 100% sample loading volume with a 10 min pause, the separation window was improved by 54% and the peak capacity was improved by 48% in optimal four PS-tCITP with the same sample loading volume and pause. It should be noted that in PS-tCITP, there is a tradeoff between the benefit of separation improvement and the sacrificing of the throughput. It is suggested that when optimizing the PS-tCITP method using pause time and multi-cycle of polarity switching in applications requiring high throughput, separation performance and time cost should be balanced.It is expected that the multiple PS-tCITP technique can be readily implemented on any CE-MS setup with a little setup modification. The PS-tCITP-MS setup and its application on a more complex sample mixture, such as protein digest, will be a subject for future investigation.
Conflicts of interest
There are no conflicts to declare.Acknowledgements
This work was supported by the Key Research and Development Program of Zhejiang Province of China (Grant No. 2020C03064), Science and Technology Major Project of Ningbo (Grant No. 2018B10075), Public Project of Ningbo (Grant No. 202002N3167) and the National Natural Science Foundation of China (Grant No. 61974146).References
- Z. Mala and P. Gebauer, Recent progress in analytical capillary isotachophoresis, Electrophoresis, 2019, 40(1), 55–64 CrossRef CAS.
- R.-L. Chien and D. S. Burgi, On-Column Sample Concentration Using Field Amplification in CZE, Anal. Chem., 1992, 64(8), 489A–496A CrossRef CAS.
- C. X. Zhang and W. Thormann, Head-Column Field-Amplified Sample Stacking in Binary System Capillary Electrophoresis: A Robust Approach Providing over 1000-Fold Sensitivity Enhancement, Anal. Chem., 1996, 68(15), 2523–2532 CrossRef CAS.
- R. L. Chien and D. S. Burgi, Sample stacking of an extremely large injection volume in high-performance capillary electrophoresis, Anal. Chem., 1992, 64(9), 1046–1050 CrossRef CAS.
- M. Pieckowski, P. Kowalski and T. Baczek, Combination of large volume sample stacking with polarity switching and cyclodextrin electrokinetic chromatography (LVSS-PS-CDEKC) for the determination of selected preservatives in pharmaceuticals, Talanta, 2020, 211, 120673 CrossRef CAS.
- Y. He and H. K. Lee, Large-volume sample stacking in acidic buffer for analysis of small organic and inorganic anions by capillary electrophoresis, Anal. Chem., 1999, 71(5), 995–1001 CrossRef CAS.
- F. Kitagawa, T. Kawai and K. Otsuka, On-line sample preconcentration by large-volume sample stacking with an electroosmotic flow pump (LVSEP) in microscale electrophoresis, Anal. Sci., 2013, 29(12), 1129–1139 CrossRef CAS.
- G. Zhu, L. Sun, X. Yan and N. J. Dovichi, Bottom-up proteomics of Escherichia coli using dynamic pH junction preconcentration and capillary zone electrophoresis-electrospray ionization-tandem mass spectrometry, Anal. Chem., 2014, 86(13), 6331–6336 CrossRef CAS.
- R. A. Lubeckyj, E. N. McCool, X. Shen, Q. Kou, X. Liu and L. Sun, Single-Shot Top-Down Proteomics with Capillary Zone Electrophoresis-Electrospray Ionization-Tandem Mass Spectrometry for Identification of Nearly 600 Escherichia coli Proteoforms, Anal. Chem., 2017, 89(22), 12059–12067 CrossRef CAS.
- J.-M. Busnel, B. Schoenmaker, R. Ramautar, A. Carrasco-Pancorbo, C. Ratnayake and J. S. Feitelson, et al. High capacity capillary electrophoresis-electrospray ionization mass spectrometry: coupling a porous sheathless interface with transient-isotachophoresis, Anal. Chem., 2010, 82(22), 9476–9483 CrossRef CAS.
- C. Wang, C. S. Lee, R. D. Smith and K. Tang, Ultrasensitive sample quantitation via selected reaction monitoring using CITP/CZE–ESI-triple quadrupole MS, Anal. Chem., 2012, 84(23), 10395–10403 CrossRef CAS.
- C. Wang, C. S. Lee, R. D. Smith and K. Tang, Capillary isotachophoresis-nanoelectrospray ionization-selected reaction monitoring MS via a novel sheathless interface for high sensitivity sample quantification, Anal. Chem., 2013, 85(15), 7308–7315 CrossRef CAS.
- T. Kawai, N. Ota, A. Imasato, Y. Shirasaki, K. Otsuka and Y. Tanaka, Profiling of N-linked glycans from 100 cells by capillary electrophoresis with large-volume dual preconcentration by isotachophoresis and stacking, J. Chromatogr., A, 2018, 1565, 138–144 CrossRef CAS.
- J. Horáková, J. Petr, V. Maier, J. Znaleziona, A. Staňová and J. Marák, et al. Combination of large volume sample stacking and dynamic pH junction for on-line preconcentration of weak electrolytes by capillary electrophoresis in comparison with isotachophoretic techniques, J. Chromatogr., A, 2007, 1155(2), 193–198 CrossRef.
- J. Liu, Z. Liu, M. Kang, S. Liu and H. Y. Chen, Combination of large volume sample stacking and reversed pH junction in capillary electrophoresis for online preconcentration of glycoforms of recombinant human erythropoietin, J. Sep. Sci., 2009, 32(3), 422–429 CrossRef CAS.
- T. D. Mai, F. Oukacine and M. Taverna, Multiple capillary isotachophoresis with repetitive hydrodynamic injections for performance improvement of the electromigration preconcentration, J. Chromatogr., A, 2016, 1453, 116–123 CrossRef CAS.
- C. Crosnier de Lassichère, T. D. Mai, M. Otto and M. Taverna, Online Preconcentration in Capillaries by Multiple Large-Volume Sample Stacking: An Alternative to Immunoassays for Quantification of Amyloid Beta Peptides Biomarkers in Cerebrospinal Fluid, Anal. Chem., 2018, 90(4), 2555–2563 CrossRef.
- L. Sun, G. Zhu, Y. Zhao, X. Yan, S. Mou and N. J. Dovichi, Ultrasensitive and fast bottom–up analysis of femtogram amounts of complex proteome digests, Angew. Chem., Int. Ed., 2013, 52(51), 13661–13664 CrossRef CAS.
- K. Faserl, B. Sarg, L. Kremser and H. Lindner, Optimization and evaluation of a sheathless capillary electrophoresis–electrospray ionization mass spectrometry platform for peptide analysis: comparison to liquid chromatography–electrospray ionization mass spectrometry, Anal. Chem., 2011, 83(19), 7297–7305 CrossRef CAS.
- X. Guo, T. L. Fillmore, Y. Gao and K. Tang, Capillary Electrophoresis–Nanoelectrospray Ionization–Selected Reaction Monitoring Mass Spectrometry via a True Sheathless Metal-Coated Emitter Interface for Robust and High-Sensitivity Sample Quantification, Anal. Chem., 2016, 88(8), 4418–4425 CrossRef CAS.
- K. Imami, M. R. N. Monton, Y. Ishihama and S. Terabe, Simple on-line sample preconcentration technique for peptides based on dynamic pH junction in capillary electrophoresis–mass spectrometry, J. Chromatogr., A, 2007, 1148(2), 250–255 CrossRef CAS.
- D. Chen, X. Shen and L. Sun, Capillary zone electrophoresis–mass spectrometry with microliter-scale loading capacity, 140 min separation window and high peak capacity for bottom-up proteomics, Analyst, 2017, 142, 2118–2127 RSC.
- H. Wu, L. Yi, R. Wojcik, T. Shi and K. Tang, A separation voltage polarity switching method for higher sample loading capacity and better separation resolution in transient capillary isotachophoresis separation, Analyst, 2019, 144(2), 454–462 RSC.
Footnote |
| † Electronic supplementary information (ESI) available. See DOI: 10.1039/d0an01640c |
| This journal is © The Royal Society of Chemistry 2021 |

