
 Open Access Article
 This Open Access Article is licensed under a
 Creative Commons Attribution 3.0 Unported Licence
Heterostructure of vanadium pentoxide and mesoporous SBA-15 derived from natural halloysite for highly efficient photocatalytic oxidative desulphurisation†
Manh B. Nguyenab,
Xuan Nui Pham*c and
Huan V. Doan *cd
*cd
aInstitute of Chemistry (IOC), Vietnam Academy of Science and Technology (VAST), 18 Hoang Quoc Viet, Cau Giay, Hanoi, Vietnam
bHanoi University of Science and Technology (HUST), 01 Dai Co Viet Road, Hanoi, Vietnam
cDepartment of Chemical Engineering, Hanoi University of Mining and Geology, 18 Vien Street, Bac Tu Liem District, Hanoi, Vietnam. E-mail: phamxuannui@gmail.com
dSchool of Chemistry, University of Bristol, Bristol, BS8 1TS, UK. E-mail: huan.doan@bristol.ac.uk
First published on 27th September 2021
Abstract
Integration between conventional semiconductors and porous materials can enhance electron–hole separation, improving photocatalytic activity. Here, we introduce a heterostructure that was successfully constructed between vanadium pentoxide (V2O5) and mesoporous SBA-15 using inexpensive halloysite clay as the silica–aluminium source. The composite material with 40% doped V2O5 shows excellent catalytic performance in the oxidative desulphurisation of dibenzothiophene (conversion of 99% with only a minor change after four-cycle tests). These results suggest the development of new catalysts made from widely available natural minerals that show high stability and can operate in natural light to produce fuel oils with ultra-low sulphur content.
Introduction
Desulphurisation, a catalytic reaction to remove sulphur from organic compounds such as thiophene, benzothiophene and dibenzothiophene, is an important process in fuel oil refining technology to reduce sulphur dioxide emissions. Many desulphurisation strategies have been explored1 to produce refined petroleum products with ultra-low-sulphur content (less than 15 ppm),2 approaching the strict standards of sulphur levels in fuel oil that have been implemented in some countries to reverse climate change. Besides physical and biological methods, photocatalytic oxidative desulphurisation has gained significant attention due to its economic and green merits and high efficiency.3–6 This technology can convert sulphur-containing compounds into sulfone groups using abundant solar irradiation at ambient temperature, reducing costs and energy consumption to a reasonable level. Since the first photocatalytic oxidative desulphurisation of dibenzothiophene (DBT) in acetonitrile using TiO2 was reported in 2002,7 significant improvements have been made to photocatalytic efficiency. Many of them have focused on pairing metallic inorganic photocatalysts, such as TiO2,8 CeO2,9 Fe2O3,10 MoO3,11 Cu2O,12 SnO2,13 and WO3,14 with other suitable semiconductors or substrates to obtain a high surface area or defect structure, improving separation capability and visible light absorption.Vanadium pentoxide (V2O5) is a highly stable crystalline form of the abundant vanadium oxide systems with high surface-to-volume ratio and various micro-nanostructures, such as nanoparticles,15 micro-nanorods,16 micro-nanotubes,17 micro-nanowires,18 nanospheres,19 nanohollows,20 nanoflowers,21 three-dimensional porous22 and ultra-large nanosheets.23 This semiconductor consists of bandgap energies (between 1.9 and 2.3 eV),24 including two localised bands of the CB and mid-gap band due to the numerous oxygen vacancies. The intensity of these transitions is affected by the morphologies and growth methods, leading to tuneable optical energy of V2O5 microstructures. The wide ranges of band edge absorption and broad photoluminescence (PL) indicate the potential use of this material in photocatalysis.25
The heterostructure created by the interface between V2O5 and mesoporous materials can increase surface area and obtain a unique morphology, and is of broad current interest.26 In heterostructures, electron–hole pairs can transfer between materials, improving electron–hole separation and increasing photocatalytic activity. In this respect, SBA-15, a mesoporous silica molecular sieve with tuneable uniform hexagonal channels (with a size of 4–12 nm), high specific surface area (600–1000 cm2 g−1), large pore volume (0.8–1.6 cm3 g−1) and high thermal and mechanical stability,27–29 is a favourable support for the dispersion of the active component in photocatalysts. This material can be synthesised using various inorganic silicates such as tetraethyl orthosilicate or tetramethyl orthosilicate. Recently, increasing attention has been paid to the production of SBA-15 using widely available natural minerals such as bentonite30 and metakaolin31 to replace the expensive and toxic silica sources. Halloysite (Al4[Si4O10](OH)8·4H2O), a clay mineral of kaolin consisting of hollow cylinders formed by multiple rolled layers, has been used as a silica and aluminium source to synthesise various types of mesoporous material. For example, Yaling et al.32 prepared the ordered mesoporous material Al–MCM-41 from natural halloysite with a surface area of 509.4 m2 g−1 and pore volume of 0.489 cm3 g−1. In our previous studies, we reported the synthesis of Ag@AgBr/Al–SBA-15 (ref. 33) and Ti–Al–SBA-15 (ref. 34) derived from natural halloysite. The resultant materials showed highly efficient photocatalytic oxidative desulphurisation activity, with more than 98% of DBT being converted and the catalysts stable for up to four cycles.
Inspired by our work on Ag@AgBr/Al–SBA-15,33 Ti–Al–SBA-15 (ref. 34) and Ag@AgBr/Al–MCM-41,35 this study sought to investigate the synthesis of V2O5/Fe–Al–SBA-15 nanocomposite using halloysite clay collected in Yenbai Province (Vietnam). The resultant samples with different loadings of V2O5 were subsequently assessed in the photocatalytic oxidative desulphurisation of DBT. The influence of the reaction temperature, amount of catalyst and H2O2 agent on the DBT degradation was further examined, using the V2O5/Fe–Al–SBA-15 sample with the optimal amount of V2O5.
Experimental methods
Materials
Halloysite clay obtained from Yenbai Province (Vietnam) was milled and sieved, then dried in an oven at 100 °C for 24 h, with the following chemical composition (weight %): 32.26 SiO2; 10.67 Al2O3; 7.38 Fe2O3; 0.39 TiO2; 2.75 CuO; 1.25 MgO; 22.70 Na2O; and 22.60 loss on ignition (LOI). Triblock copolymer pluronic P123 (EO20–PO70–EO20, MW = 5800) was used as a template; ammonium metavanadate (NH4VO3, 99%), iron(III) chloride hexahydrate (FeCl3·6H2O, 99%), acetic acid (CH3COOH, 99.7%), ethanol (C2H5OH, 99.7%), dibenzothiophene (C12H8S, 99%), n-octane (C8H18, 99%) and hydrogen peroxide (H2O2, 30%) were purchased from Sigma–Aldrich. Concentrated HCl and NaOH aqueous solutions were used as the acid and base sources, respectively. All reagents were analytical grade and were used without further purification.Synthesis of Fe–Al–SBA-15
First, 10 g of natural halloysite was calcined at 700 °C (5 °C min−1) for 3 hours and then cooled naturally at room temperature. The powder was stirred at 500 rpm with 100 ml of NaOH for 24 hours at 80 °C, after which the product was rinsed several times with distilled water to completely remove excess NaOH, and dried at 100 °C for 12 hours. The silica precursor was obtained for the preparation of Al–SBA-15. Second, a quantity of FeCl3·6H2O was added to 20 ml of distilled water and placed under ultrasonic vibrations for 30 minutes (solution A). Third, 4 g of P123 was dissolved in 30 ml of distilled water with the addition of 120 ml of 2 M HCl, and the mixture was stirred at 500 rpm for 3 hours at 40 °C. Then, 4 g of silica precursor and solution B were added and stirred continuously for 24 hours. The solution was kept in an autoclave at 100 °C for 48 hours. After ageing, the sample was washed with distilled water and dried at 80 °C for 8 hours. The resulting solids were heated in air at 550 °C for 6 hours at a heating rate of 5 °C min−1.Synthesis of V2O5/Fe–Al–SBA-15
A suitable amount of NH4VO3 was placed on each side of the quartz reactor with glass wool placed in the centre of the wall. Nitrogen was slowly fed into the reaction tube at a rate of 30 ml min−1 for 10 minutes to remove all the oxygen present in the reaction system. The reactor was then heated to 500 °C for 3 hours at a rate of 5 °C min−1. The desired V2O5 mass in the catalyst was adjusted by varying the NH4VO3 content. A variety of samples of V2O5/Fe–Al–SBA-15 material with varying amounts of vanadium ranging from 10 to 50% were labelled as x% V2O5/Fe–Al–SBA-15 where x is the percentage of V2O5 in the sample.Photocatalytic oxidative desulphurisation of dibenzothiophene
In the photocatalytic oxidative desulphurisation experiments, direct sunlight was applied as an energy source. The intensity of incident sunlight was about 1880 Lux. The photocatalytic activity of the V2O5/Fe–Al–SBA-15 nanocomposite complex synthesised on DBT decomposition was studied with n-octane as a fuel sample. In the tests, 50 ml of DBT (500 ppm) and 50 mg of the catalyst were added to a Pyrex three-neck flask and stirred magnetically. The experiments were carried out at different times and temperatures. Different amounts of V2O5 catalyst (10, 20, 30, 40 and 50% by weight) were investigated. The DBT adsorption capacity of the catalyst of 40% V2O5/Fe–Al–SBA-15 was measured at 40 °C and without an H2O2 oxidant agent, but other parameters remained unchanged. The attenuation of DBT was determined based on the absorption at λmax = 325 nm using an ultraviolet-visible (UV-vis) spectrophotometer.36 The equilibrium DBT concentration was taken as the initial concentration (Co) for DBT photocatalytic decomposition. Kinetic studies of photocatalytic degradation are given in Section 2.6 in the ESI.†Results and discussions
Crystal structures of V2O5/Fe–SBA-15 samples with different vanadium contents were revealed using powder X-ray diffraction (PXRD). The results are shown in Fig. 1.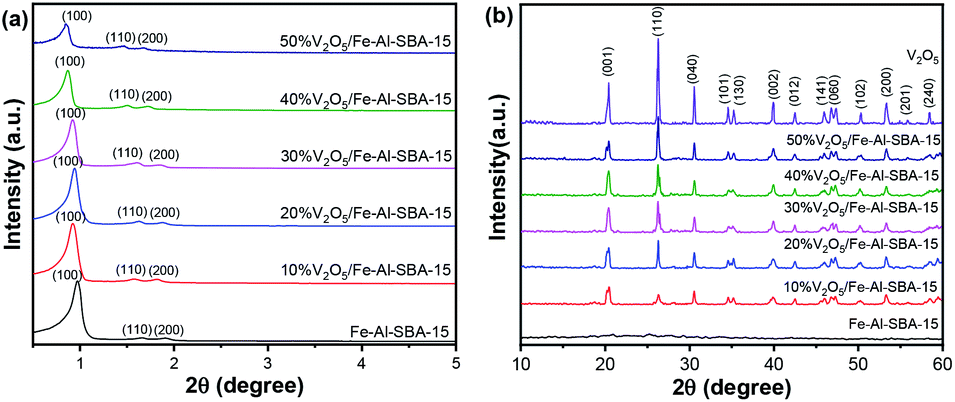 | ||
| Fig. 1 Small-angle (a) and wide-angle (b) PXRD patterns of V2O5 and V2O5/Fe–Al–SBA-15 samples. | ||
As can be seen in Fig. 1a, three typical peaks at 0.9, 1.6 and 1.8° 2θ for the 2D hexagonal structure P6mm of SBA-15,10,37,38 are observed in all samples. Looking further at peak 0.9° 2θ, a decreased intensity can be noticed in V2O5/Fe–Al–SBA-15 compared to the pristine Fe–Al–SBA-15 sample. These peaks have slightly shifted to a lower angle. This is due to the ion radius of V5+ (0.59 Å) being larger than that of Si4+ (0.41 Å), so the V–O link length is larger than Si–O, increasing in lattice cell parameter of the network.39 The greater the amount of V2O5 doped in the sample, the greater the decrease and shift seen in this PXRD peak. The wide-angle PXRD patterns (Fig. 1b) revealed that the V2O5 phase (JCPDS card no. 40-1296)40–42 is retained in the V2O5/Fe–Al–SBA-15 samples. The peak at 26.3° 2θ increases with an increase in vanadium content in Fe–Al–SBA-15. There is no evidence of Fe2O3 in the samples, indicating uniform dispersion of Fe2O3 in the SBA-15 structure.43
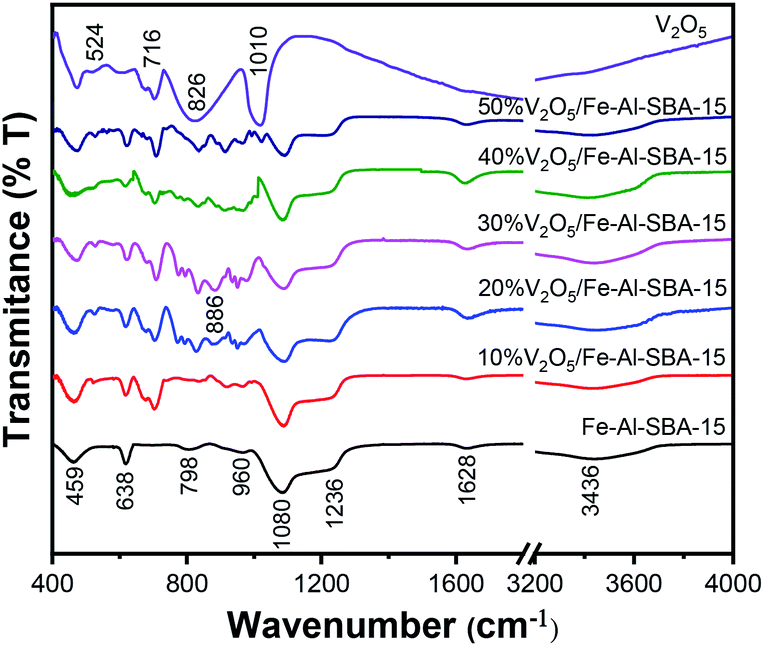
The chemical structures of all samples were examined using Fourier-transform infrared (FT-IR) spectroscopy. As observed in Fig. 2, the stretching vibration of Si–OH groups (evidenced by the broad absorption bands around 3436 cm−1 and 1628 cm−1),44 Si–O groups (evidenced by the bands at 1236 cm−1, 1080 cm−1 and 459 cm−1),37,45,46 Si–O–Si groups (evidenced by the band at 798 cm−1) and Fe–O (evidenced by the bands at 459 cm−1 and 638 cm−1)47,48 were retained in the structures of the V2O5/Fe–Al–SBA-15 samples. Note that the absorption bands at 960 cm−1 and 886 cm−1 are attributed to the vibration of deformed Si–OH or Si–OM+ (Al3+)49 and the vibration of doubly coordinated oxygen (bridge oxygen), respectively.50 New absorption bands are observed in the FT-IR spectra at 524 cm−1, 716 cm−1, 826 cm−1 and 1020 cm−1, indicating the existence of V–O–V bonds in the V2O5 doped samples.50,51
 | ||
| Fig. 2 FT-IR spectra of V2O5 and V2O5/Fe–Al–SBA-15 samples. | ||
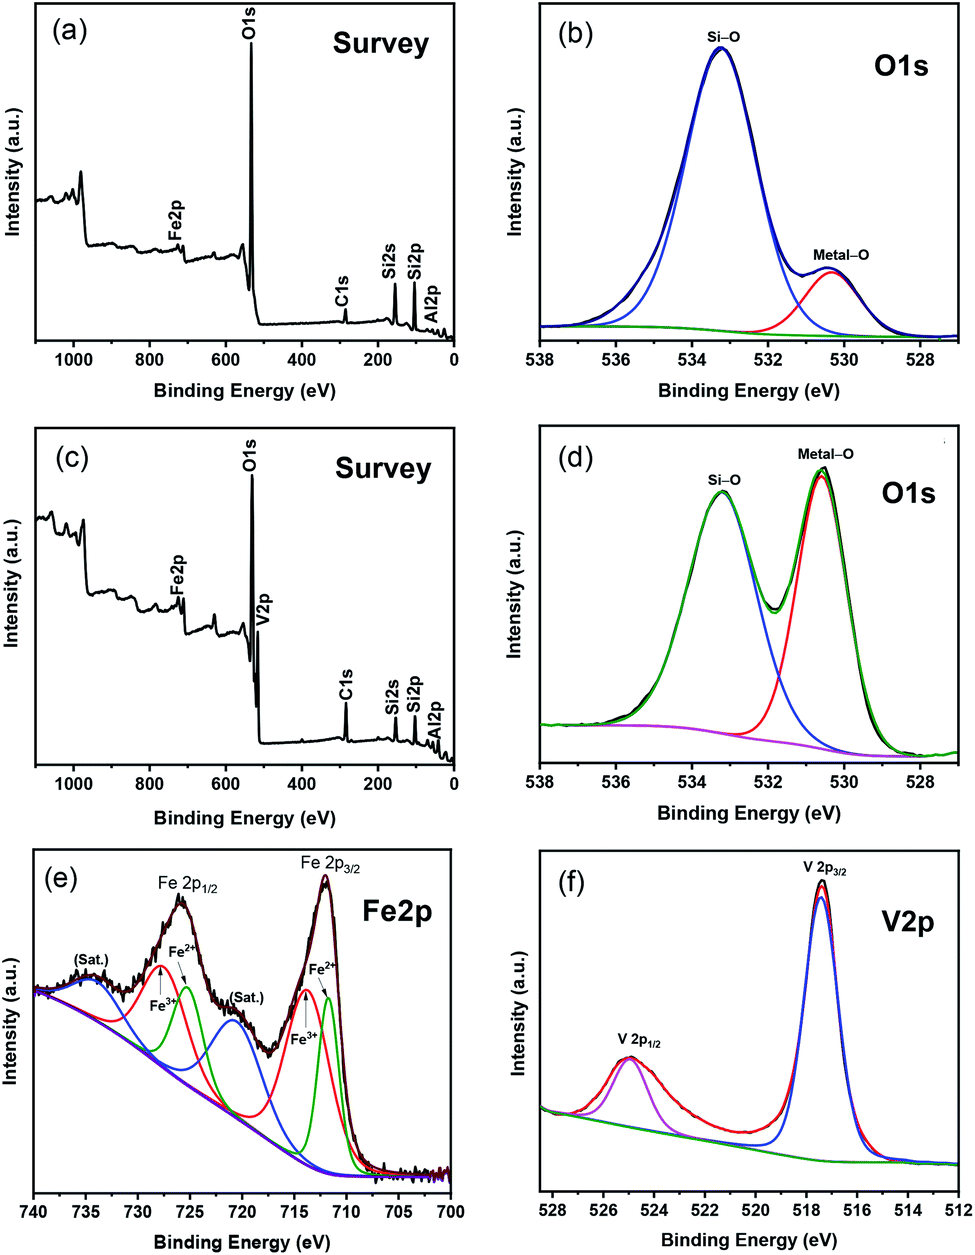
XPS spectra of Fe–Al–SBA-15 and 40% V2O5/Fe–Al–SBA-15 nanocomposites are shown in Fig. 3. In the survey scan of the Fe–Al–SBA-15 sample (Fig. 3a), the binding energies of Si 2p (103.5 eV) and Al 2p (70.5 eV) correspond to Si4+ and Al3+ in the SBA-15 framework, respectively.52 In the O 1s configuration of the Fe–Al–SBA-15 sample (Fig. 3b), the peaks at 533.2 eV and 530.3 eV are attached to the Si–O and Fe–O bonds, respectively. The survey scan of 40% V2O5/Fe–Al–SBA-15 sample (Fig. 3c) shows the existence of Si 2p (105.5 eV), Al 2p (70.5 eV), O 1s (633 eV), Fe 2p (724.5 eV) and V 2p (517.5 eV). A closer look at the O 1s configuration of the 40% V2O5/Fe–Al–SBA-15 sample (Fig. 3d) shows there are two peaks at 533.2 eV and 530.6 eV which are similar to the Fe–Al–SBA-15 sample. However, the intensity of the peak for metal–O bonds at 530.6 eV is significantly higher, which might be due to the vanadium attached at this position. In the Fe 2p spectra of 40% V2O5/Fe–Al–SBA-15 sample (Fig. 3e), the two peaks at 713.72 and 727.48 eV are both assigned to Fe2p3/2 and Fe2p1/2 of Fe(III).53 The two peaks at 711.71 and 725.21 eV are also observed, which respectively correspond to Fe2p3/2 and Fe2p1/2 of Fe(II) in this sample.54 The Fe3+/Fe2+ ratio was determined to be 1.85 (see Table S2†). In the V 2p spectra of 40% V2O5/Fe–Al–SBA-15 sample (Fig. 3f), the only two peaks at around 517 eV and 525 eV can confirm that there is only V5+ species (V 2p3/2 and V 2p1/2) without any other valence states in this sample,55 which is in agreement with the XRD results shown previously.
 | ||
| Fig. 3 XPS spectra of Fe–Al–SBA-15 (a and b) and 40% V2O5/Fe–Al–SBA-15 (c–f). | ||
Textural properties
The morphology and elemental composition of the Fe–Al–SBA-15 and 40% V2O5/Fe–Al–SBA-15 samples were analysed by scanning electron microscopy (SEM), transmission electron microscopy (TEM) and energy-dispersive X-ray spectroscopy (EDX).SEM images (Fig. 4a and b) show that the samples are rod-shaped with a diameter of 0.2–0.5 μm. A cross-section of these samples is hexagonal, which is confirmed further in TEM images (Fig. 4c and d). Fig. 4b shows that V2O5 nanoparticles are spherical in shape, deposited on the hexagonal surface of SBA-15. In the TEM image (Fig. 4d), the darker areas may correspond to the well-deposited V2O5 nanoparticles on the Fe–Al–SBA-15 surface, demonstrating the formation of V2O5/Fe–Al–SBA-15 nanocomposite materials. EDX results indicate the existence of Si, Al, O, Fe and V in the 40% V2O5/Fe–Al–SBA-15 composite material (as seen in the EDX spectra, Fig. S2†), and the uniform distribution of V and Fe on the surface of the Al–SBA-15 support (as seen in the EDX mapping images, Fig. S3†). The content of O, Si, Al, Fe and V (wt%) is 41.86%, 18.95%, 2.24%, 6.36% and 30.59%, respectively. The vanadium content is 30.59 wt%, which is close to the initial concentration in this sample.
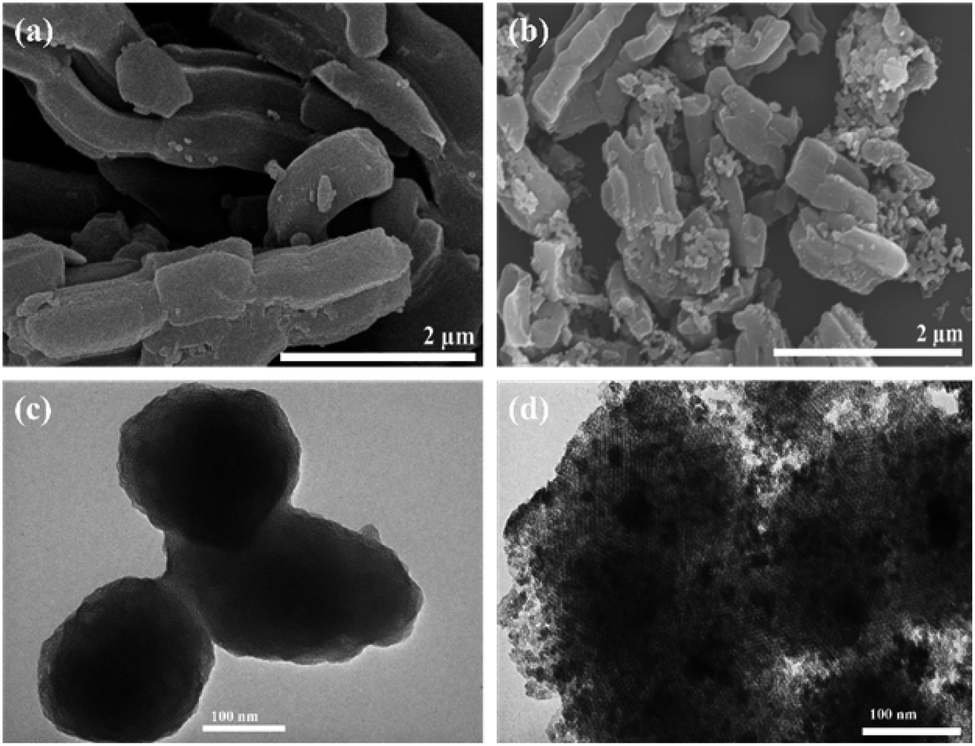 | ||
| Fig. 4 SEM images of Fe–Al–SBA-15 (a) and 40% V2O5/Fe–Al–SBA-15 (b) samples. TEM images of Fe–Al–SBA-15 (c) and 40% V2O5/Fe–Al–SBA-15 (d) samples. | ||
The porous structures and surface areas of all synthesised samples were analysed using a gas sorption technique. As shown in Fig. 5a, an IUPAC type IV isotherm with an H1 hysteresis loop emerges in the N2 adsorption and desorption at 77 K, indicating that a narrow range of uniform mesoporous structures was maintained in all samples.56 This sorption isotherm is to be expected in SBA-15 material that has mesopores of ∼8 nm (Fig. 5b).33 Details of specific surface areas, pore volumes and diameters of these samples are given in Table S3.†
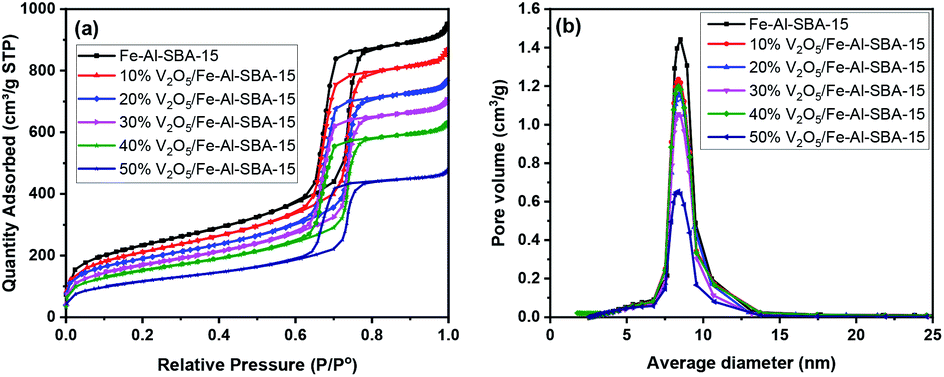 | ||
| Fig. 5 N2 isotherms (a) and pore volumes (b) of the synthesised samples. | ||
When comparing the V2O5/Fe–Al–SBA-15 with a different amount of V2O5, a small but steady decrease in both surface areas and total pore volume was observed for a higher amount of V2O5 (Table S3†). Typically, surface area decreased from 824 to 418 m2 g−1 and total pore volume decreased from 1.46 to 0.49 cm3 g−1 when increasing V2O5 content from 10 to 50% wt. This is due to the blockage of vanadium oxide particles in the pore of the Fe–Al–SBA-15 material. The pore size also slightly decreased to 6.18 nm in 50% V2O5/Fe–Al–SBA-15, compared to 8.13 nm in the pristine Fe–Al–SBA-15. There were no significant changes to the average pore diameter in the 40% V2O5/Fe–Al–SBA-15 sample, suggesting uniform deposition of vanadium species onto the Fe–Al–SBA-15 walls.57
Optical and photoelectrochemical properties
Optical properties and bandgap energies of V2O5, Fe–SBA-15 and V2O5/Fe–Al–SBA-15 samples were assessed using ultraviolet-visible diffuse reflectance spectroscopy (UV-vis DRS), see Fig. 6a and Table 1. The absorption edge of V2O5/Fe–Al–SBA-15 samples shifts to a longer wavelength than that of pristine Fe–Al–SBA-15. Higher loading of V2O5 shows lower absorption edge and bandgap energies, indicating enhanced visible light absorption in these composite materials. However, the 50% V2O5/Fe–Al–SBA-15 sample seems to have a lower absorption edge than the 40% V2O5/Fe–Al–SBA-15 sample, which is due to cluster contraction to form large particles, uneven dispersion on the carrier and blockage of vanadium oxide particles in the pore of the Fe–Al–SBA-15 material. The 40% V2O5/Fe–SBA-15 sample thus has the best visible light absorption of the above samples. The flat band potentials for Fe–Al–SBA-15 and 40% V2O5/Fe–Al–SBA-15 samples were determined by Mott–Schottky plots (Fig. S5†). The flat band potentials for Fe–Al–SBA-15 and 40% V2O5/Fe–Al–SBA-15 were found to be 0.32 eV and 0.25 eV, respectively. Using the relation between valence band (VB), conduction band (CB) and bandgap energy (Eg), EVB = ECB + Eg, the EVB of Fe–Al–SBA-15 and 40% V2O5/Fe–Al–SBA-15 are calculated as 2.58 eV, and 2.13 eV, respectively.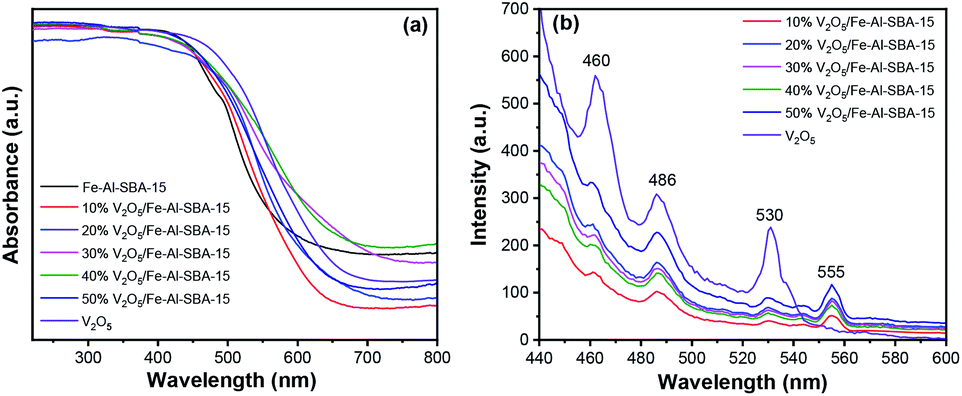 | ||
| Fig. 6 (a) UV-vis diffuse reflectance spectra; (b) photoluminescence (PL) spectra of V2O5 and V2O5/Fe–Al–SBA-15 photocatalysts. | ||
| Samples | V2O5 | Fe–Al–SBA-15 | x% V2O5/Fe–Al–SBA-15 (x = 10–50) | ||||
|---|---|---|---|---|---|---|---|
| 10% | 20% | 30% | 40% | 50% | |||
| Eg (eV) | 1.93 | 2.26 | 2.16 | 2.00 | 1.92 | 1.88 | 1.96 |
Photoluminescence (PL) spectroscopy using a 450 W xenon lamp with an excitation wavelength of 425 nm was implemented to investigate the recombination behaviour of the photocatalysts. As can be seen in Fig. 6b, three PL emission peaks at 460 nm, 486 nm and 530 nm were observed in all samples. The new emission peak at 555 nm in the V2O5/Fe–Al–SBA-15 samples corresponds to electron transfer from the conduction band of V2O5 nanorods to SBA-15.58 The green emission around 530 nm is attributed to the transition from conduction band edge to deep levels associated with oxygen vacancies.59 The PL peak observed at 486 nm is due to band transition.60 The emission peak observed at 460 nm is due to the recombination of the electron–hole pair from the V 3d split-off conduction band to the top of the O 2p valence band.59,61 The enhanced PL intensity observed in the samples with more V2O5 loaded is due to the contribution of excess electrons from defects and transfers between V2O5 and carriers, which can fill a part of the conduction band or the split-off band.62
Photocatalytic activity
The photocatalytic performance of the synthesised samples was investigated in the oxidative desulphurisation of DBT under natural light. Fig. 7 illustrates the photocatalysis of 10–50% V2O5/Fe–Al–SBA-15 samples for the desulphurisation of DBT under visible light irradiation. The conversion of DBT was determined based on UV-vis results. An example of the reaction products was analysed by Gas Chromatography-Mass Spectrometry (GC-MS), demonstrating that dibenzothiophene sulfone (DBTO2) was successfully formed and the desulphurisation reaction was indeed happened, as seen in Fig. S6.†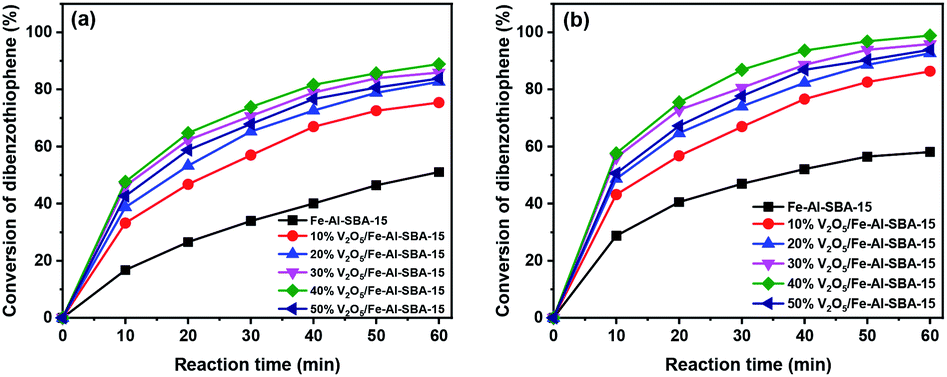 | ||
| Fig. 7 Photodegradation of DBT (500 ppm of DBT in 100 ml n-octane solution) with different photocatalysts (50 mg of photocatalyst and 1 ml of H2O2) under sunlight irradiation at reaction temperatures of (a) 40 °C and (b) 60 °C. | ||
Photodegradation of DBT with different photocatalyst contents under sunlight irradiation at a reaction temperature of 40 °C was investigated and shown in Fig. 7. Results showed that DBT conversion increased rapidly in the first ten minutes of the reaction; the conversion was about 17–48%. After 60 minutes of reaction time, the desulphurisation rate increased from 51% to 89% when the V2O5 content increased from 10% to 40%. However, when the V2O5 content increased by 50%, desulphurisation decreased to 84%. The 40% V2O5/Fe–Al–SBA-15 catalyst showed the highest photochemical catalytic activity at 89%. This is likely due to the significantly reduced surface area and pore volume of the 50% V2O5/Fe–Al–SBA-15 sample compared to other catalysts (Table S3†). The 40% V2O5/Fe–Al–SBA-15 catalyst exhibited the highest activity with a DBT conversion that reached 99% at 60 °C after 60 minutes because it had the lowest bandgap energy (Eg = 1.88 eV). This is consistent with the PL results (Fig. 6b), which demonstrated that the emission intensity of the 40% V2O5/Fe–Al–SBA-15 catalyst was the weakest.
Photodegradation of DBT over 40% V2O5/Fe–Al–SBA-15 catalyst at different conditions was also investigated in this study. Fig. S7a† shows that the metabolism of DBT increased with increasing reaction temperature between 40 °C and 70 °C. DBT oxidation is limited by kinetics due to diffusion restriction at low temperatures. When the reaction temperature increases, the rate of ˙OH radical generation increases and the surface diffusion rate between the catalyst and DBT increases, leading to increased DBT conversion. As shown in Fig. S7b,† the overall conversion of DBT increased when increasing the catalyst dose from 40 mg to 50 mg, which is due to the enriched catalytic activity sites in the reaction. However, when the catalyst dose was increased up to 60 mg, almost no changes were detected during the DBT conversion, indicating that the catalyst activity could not be significantly improved, perhaps because most DBT has been oxidised in the first phase of the reaction with an increase in the number of reaction sites. Fig. S7c† shows the effect of H2O2 on the DBT conversion using 40% V2O5/Fe–Al–SBA-15. Generally, the DBT metabolism increased with an increase of H2O2 concentration from 0.5 to 1 ml. However, when increasing this to 1.5 ml and 2 ml, a decreased DBT conversion was observed. H2O2 is known as a strong oxidising agent, producing hydroxyl radicals when exposed to light. However, an excessive amount of H2O2 will poison the V2O5/Fe–Al–SBA-15 catalyst surface and cause side effects on photocatalytic reaction.35
We also performed the reaction over 40% V2O5/Fe–Al–SBA-15 sample under different conditions while maintaining the amount of catalyst (50 mg), the concentration of DBT (50 ppm) and temperature (70 °C). As shown in Fig. S8,† 40% V2O5/Fe–Al–SBA-15 can adsorb only ∼5% of DBT without H2O2 after 60 min in the dark, which is due to the pure adsorption in the sample. In the presence of H2O2 (1 ml) in the dark, the conversion of DBT increased to 84% after 60 min, indicating that a Fenton reaction could happen in this condition. When the sunlight was introduced, the conversion increased to 99.8% after 60 min, demonstrating that photocatalytic activity of the 40% V2O5/Fe–Al–SBA-15 sample contributed significantly to the reaction.
The stability of the 40% V2O5/Fe–Al–SBA-15 catalyst was evaluated after four-cycle runs in the photodegradation of DBT (Fig. 8). After subsequent runs under sunlight, the DBT photocatalytic degradation effectiveness decreased slightly from 99% to 97%, indicating that the photocatalytic activity of 40% V2O5/Fe–Al–SBA-15 remained steady. A further study on the kinetics of this reaction demonstrates that the oxidative photocatalytic desulphurisation for DBT in the n-octane solvent using 40% V2O5/Fe–Al–SBA-15 was the pseudo-first-order reaction (see Section 2.6 in the ESI†).
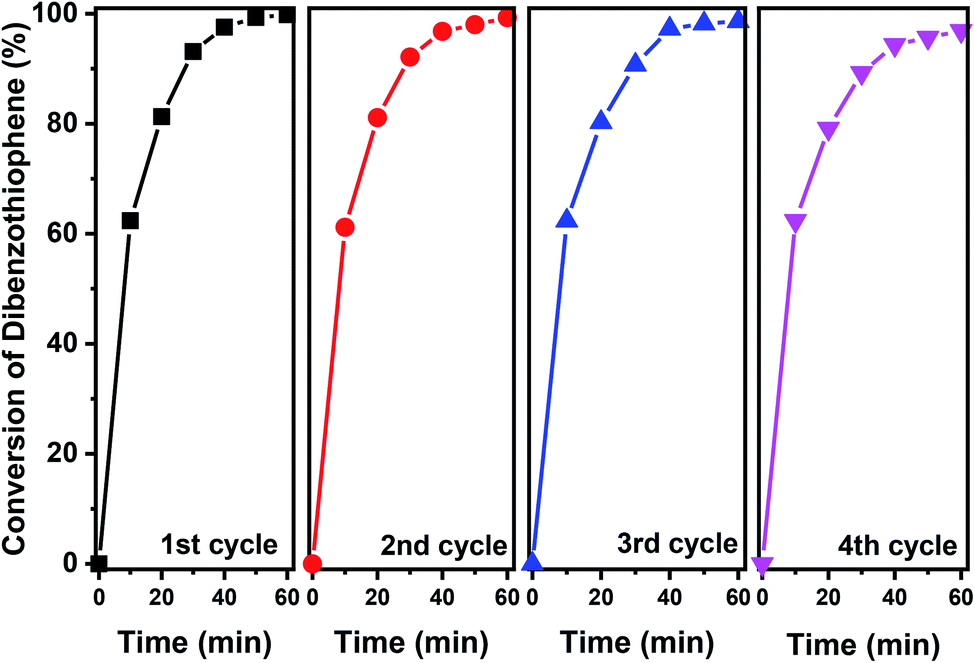 | ||
| Fig. 8 Photocatalytic degradation of DBT in successive cycles by 40% V2O5/Fe–Al–SBA-15. (Reaction conditions: Vmodel oil = 50 ml, mcatalyst = 50 mg, VH2O2 = 1.0 ml, at a reaction temperature of 70 °C). | ||
Photocatalytic mechanism
To reveal the photodegradation mechanism of DBT over the 40% V2O5/Fe–Al–SBA-15 photocatalyst, radicals-trapping experiments were carried out. The radical scavengers, including ammonium oxalate monohydrate (AO), tert-butanol (TBA), potassium dichromate (K2Cr2O7) and 1,4-benzoquinone (BQ) were employed for hole (h+), hydroxyl radicals (˙OH), electron (e−), and superoxide (˙O2−), respectively.63 As shown in Fig. 9a, the metabolism rate of DBT is significantly affected by the presence of radical scavengers. When adding AO, BQ, and K2Cr2O7 there was a significant decrease in the metabolism rate of DBT, which indicates that the h+, ˙OH and e− radicals influenced the metabolism of DBT. The addition of BQ did not change the metabolism rate of DBT because superoxide (˙O2−) is not produced by the 40% V2O5/Fe–Al–SBA-15 material. These results confirm the essential role of holes (h+), hydroxyl radicals (˙OH) and electrons (e−) in the DBT conversion.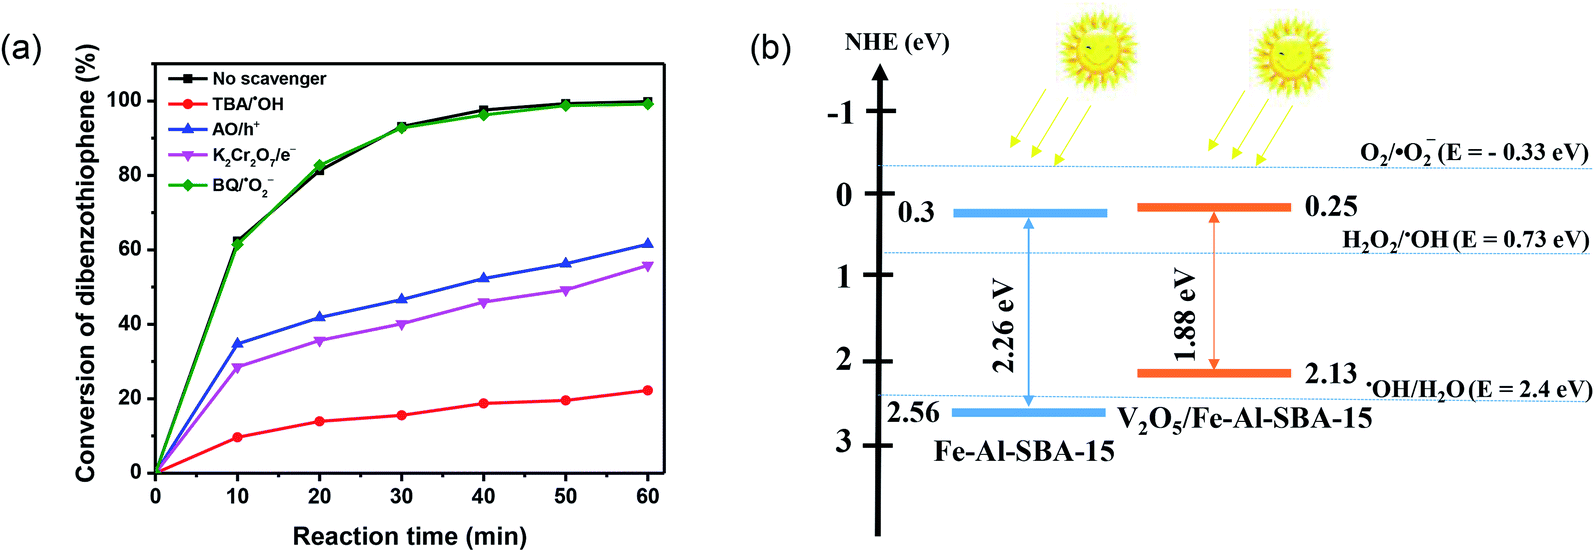 | ||
| Fig. 9 (a) The active-species-trapping experiments for conversion of DBT over 40% V2O5/Fe–Al–SBA-15 photocatalyst. (b) The schematic of the separation and transfer of photogenerated charges over V2O5/Fe–Al–SBA-15. | ||
As demonstrated earlier, Fenton oxidation could be considered in this reaction with the contribution of both Fe2+ and Fe3+ in the catalyst. Here, Fe2+ could act as an electron donor and interact with H2O2 to generate Fe3+ sites and ˙OH radicals via eqn (1), while Fe3+ could react with H2O2 to form Fe2+ and H+ via eqn (2). The Fe3+/Fe2+ ratio thus could be maintained, leading to the high recyclability of V2O5/Fe–Al–SBA-15 catalyst in the photo-Fenton reaction.
| Fe2+ + H2O2 → Fe3+ + ˙OH + OH− | (1) |
| Fe3+ + H2O2 → Fe2+ + ˙OOH + H+ | (2) |
A direct p–n heterojunction catalyst V2O5/Fe–Al–SBA-15 was formed by tightly integrating V2O5 and Fe–Al–SBA-15 with suitable VB and CB positions. The separation and transfer of photogenerated charges over V2O5/Fe–Al–SBA-15 were outlined in Fig. 9b. Note that the conduction bands of Fe–Al–SBA-15 (0.3 eV) and V2O5/Fe–Al–SBA-15 (0.25 eV) are more negative than the thermodynamic potential of the H2O2 redox reaction (Eo H2O2/˙OH = +0.73 eV)64 and higher than those of the O2 redox reaction (Eo O2/˙O2− = −0.33 eV),65,66 thus the reaction over these catalysts would generate ˙OH radicals rather than ˙O2− radicals. The proposed pathway for improving the photocatalytic performance of V2O5/Fe–Al–SBA-15 is given as follows.
| V2O5/Fe–Al–SBA-15 + hv → V2O5/Fe–Al–SBA-15 (h+ + e− | (3) |
Under light irradiation, the h+ at VB position of V2O5 could react with OH− to form ˙OH radicals via eqn (4). In the meantime, the electrons accepted by the V5+ ions could react with hydroperoxide molecules to produce ˙OH radicals via eqn (5).67
| OH− + h+ → ˙OH | (4) |
| V2O5(e−) + H2O2 → ˙OH + OH− | (5) |
Moreover, Fe–Al–SBA-15 with a high specific surface charge could act as an intermediate that reduces the recombinant e− induced by CB of the material and help to protect the higher valence bands. The electrons in Fe–Al–SBA-15 and V2O5/Fe–Al–SBA-15 can diffuse and migrate to the SBA-15 carrier and be trapped by the adsorbed H2O2 at the surface of V2O5/Fe–Al–SBA-15 to produce ˙OH radicals.
Finally, the DBT molecules are oxidised by the radicals such as ˙OH to form dibenzothiophene sulfone (eqn (6)).34
| DBT + ˙OH → DBT sulfone | (6) |
Note that the oxidation products were analysed by GC-MS (Fig. S6†), demonstrating that DBT sulfone was formed after the photocatalytic desulphurisation reaction.
Conclusions
In this study, the photocatalytic oxidation desulphurisation of a model fuel under sunlight irradiation was investigated using V2O5/Fe–Al–SBA-15 with different amounts of V2O5 (up to 50%). The optimal content of 40% V2O5 loaded on the Al–SBA-15 exhibited outstanding photocatalytic activity for the degradation of DBT, which could be due to the synergistic effect of Fenton reactions and the direct reaction of DBT with the photogenerated ē–h+ pairs under sunlight irradiation. In these investigations, sulphur removal of 99% was achieved for DBT after 60 minutes at an operating temperature of 70 °C, 1.0 ml of H2O2 (30 v/v%), and 50 mg of catalyst. The photocatalyst possessed good stability and reusability under sunlight irradiation for four successive cycles.Author contributions
Manh B. Nguyen: investigation, formal analysis, data curation, writing – original draft. Xuan Nui Pham: conceptualisation, investigation, formal analysis, data curation. Huan V. Doan: conceptualisation, investigation, data curation, writing – reviewing and editing.Conflicts of interest
There are no conflicts to declare.Acknowledgements
HVD acknowledges support from the UK Engineering and Physical Sciences Research Council for the EPSRC Doctoral Prize Fellowship (EP/T517872/1) and the Royal Society of Chemistry for the Research Fund grant (R20-8172).References
- B. N. Bhadra and S. H. Jhung, Appl. Catal., B, 2019, 259, 118021 CrossRef CAS.
- A. Stanislaus, A. Marafi and M. S. Rana, Catal. Today, 2010, 153, 1–68 CrossRef CAS.
- X. Zhou, T. Wang, H. Liu, X. Gao, C. Wang and G. Wang, ChemSusChem, 2021, 14, 492–511 CrossRef CAS PubMed.
- B. Li, H. Song, F. Han and L. Wei, Appl. Catal., B, 2020, 269, 118845 CrossRef CAS.
- X. Zhang, H. Song, C. Sun, C. Chen, F. Han and X. Li, Mater. Chem. Phys., 2019, 226, 34–43 CrossRef CAS.
- H. Chang, H. Yi, Q. Ke and J. Zhang, ACS Omega, 2020, 5, 10927–10938 CrossRef CAS PubMed.
- S. Matsuzawa, J. Tanaka, S. Sato and T. Ibusuki, J. Photochem. Photobiol., A, 2002, 149, 183–189 CrossRef CAS.
- X. N. Pham, T. D. Pham, B. M. Nguyen, H. T. Tran and D. T. Pham, J. Chem., 2018, 8418605 CAS.
- Z. Cui, H. Zhou, G. Wang, Y. Zhang, H. Zhang and H. Zhao, New J. Chem., 2019, 43, 7355–7362 RSC.
- T. T. Nguyen, G. H. Le, C. H. Le, M. B. Nguyen, T. T. T. Quan, T. T. T. Pham and T. A. Vu, Mater. Res. Express, 2018, 5, 115005 CrossRef.
- R. A. El-Salamony, H. M. Gobara and S. A. Younis, J. Water Process Eng., 2017, 18, 102–112 CrossRef.
- V. Scuderi, G. Amiard, S. Boninelli, S. Scalese, M. Miritello, P. M. Sberna, G. Impellizzeri and V. Privitera, Mater. Sci. Semicond. Process., 2016, 42, 89–93 CrossRef CAS.
- L. A. Calzada, R. Castellanos, L. A. García and T. E. Klimova, Microporous Mesoporous Mater., 2019, 285, 247–258 CrossRef CAS.
- X. N. Pham, D. L. Tran, T. D. Pham, Q. M. Nguyen, V. T. T. Thi and H. D. Van, Adv. Powder Technol., 2018, 29, 58–65 CrossRef CAS.
- K. Zhu, Y. Meng, H. Qiu, Y. Gao, C. Wang, F. Du, Y. Wei and G. Chen, J. Alloys Compd., 2015, 650, 370–373 CrossRef CAS.
- F. Mohandes and M. Salavati-Niasari, Ultrason. Sonochem., 2013, 20, 354–365 CrossRef CAS PubMed.
- R. Ceccato, S. Dirè, T. Barone, G. De Santo and E. Cazzanelli, J. Mater. Res., 2009, 24, 475–481 CrossRef CAS.
- J. Livage, Materials, 2010, 3, 4175–4195 CrossRef CAS PubMed.
- D. W. Su, S. X. Dou and G. X. Wang, J. Mater. Chem. A, 2014, 2, 11185–11194 RSC.
- M. Panagopoulou, D. Vernardou, E. Koudoumas, N. Katsarakis, D. Tsoukalas and Y. S. Raptis, J. Phys. Chem. C, 2017, 121, 70–79 CrossRef CAS.
- M. R. Parida, C. Vijayan, C. S. Rout, C. S. S. Sandeep, R. Philip and P. C. Deshmukh, J. Phys. Chem. C, 2011, 115, 112–117 CrossRef CAS.
- S. Wang, S. Li, Y. Sun, X. Feng and C. Chen, Energy Environ. Sci., 2011, 4, 2854–2857 RSC.
- X. Liu, J. Zeng, H. Yang, K. Zhou and D. Pan, RSC Adv., 2018, 8, 4014–4031 RSC.
- T. K. Le, M. Kang and S. W. Kim, Ceram. Int., 2019, 45, 15781–15798 CrossRef CAS.
- M. Aslam, I. M. I. Ismail, N. Salah, S. Chandrasekaran, M. T. Qamar and A. Hameed, J. Hazard. Mater., 2015, 286, 127–135 CrossRef CAS PubMed.
- C. K. P. Neeli, V. S. P. Ganjala, V. Vakati, K. S. Rama Rao and D. R. Burri, New J. Chem., 2016, 40, 679–686 RSC.
- V. Chaudhary and S. Sharma, J. Porous Mater., 2017, 24, 741–749 CrossRef CAS.
- Q. V. Tran, T. H. Truong, T. Q. Hung, H. V. Doan, X. N. Pham, N. T. H. Le, L. G. Bach and V. T. Nguyen, J. Porous Mater., 2020, 27, 1745–1754 CrossRef CAS.
- T. H. Truong, V. Cuong Do, N. Mai Do, T. Q. Hung, H. Van Doan, T. N. Nguyen, T. H. Doan, T. H. N. Le, T. Van Nguyen, L. G. Bach and Q. V. Tran, Mol. Catal., 2019, 478, 110571 CrossRef CAS.
- T. Ali-Dahmane, M. Adjdir, R. Hamacha, F. Villieras, A. Bengueddach and P. G. Weidler, C. R. Chim., 2014, 17, 1–6 CrossRef CAS.
- F. Kang, Q. Wang and S. Xiang, Mater. Lett., 2005, 59, 1426–1429 CrossRef CAS.
- Y. Xie, Y. Zhang, J. Ouyang and H. Yang, Phys. Chem. Miner., 2014, 41, 497–503 CrossRef CAS.
- X. N. Pham, M. B. Nguyen, H. S. Ngo and H. V. Doan, J. Ind. Eng. Chem., 2020, 90, 358–370 CrossRef CAS.
- X. N. Pham, M. B. Nguyen and H. V. Doan, Adv. Powder Technol., 2020, 31, 3351–3360 CrossRef CAS.
- X. N. Pham, B. M. Nguyen, H. T. Thi and H. Van Doan, Adv. Powder Technol., 2018, 29, 1827–1837 CrossRef CAS.
- M. Zarrabi and M. H. Entezari, J. Colloid Interface Sci., 2015, 457, 353–359 CrossRef CAS PubMed.
- V. N. Mutlu and S. Yılmaz, Catal. Today, 2021, 367, 213–219 CrossRef CAS.
- A. Samadi-Maybodi and E. Sedighi-Pashaki, Mater. Chem. Phys., 2021, 257, 123622 CrossRef CAS.
- M. N. Timofeeva, S. H. Jhung, Y. K. Hwang, D. K. Kim, V. N. Panchenko, M. S. Mel'gunov, Y. A. Chesalov and J. S. Chang, Appl. Catal., A, 2007, 317, 1–10 CrossRef CAS.
- L. Shao, K. Wu, X. Lin, M. Shui, R. Ma, D. Wang, N. Long, Y. Ren and J. Shu, Ceram. Int., 2014, 40, 6115–6125 CrossRef CAS.
- N. M. Ndiaye, B. D. Ngom, N. F. Sylla, T. M. Masikhwa, M. J. Madito, D. Momodu, T. Ntsoane and N. Manyala, J. Colloid Interface Sci., 2018, 532, 395–406 CrossRef CAS PubMed.
- R. Thangarasu, E. Thangavel, J. Chandrasekaran and O. N. Balasundaram, J. Mater. Sci.: Mater. Electron., 2019, 30, 4238–4249 CrossRef CAS.
- B. Sun, L. Li, Z. Fei, S. Gu, P. Lu and W. Ji, Microporous Mesoporous Mater., 2014, 186, 14–20 CrossRef CAS.
- Y. Xiao, H. X. Huang, D. M. Liang and C. Wang, Mater. Chem. Phys., 2020, 250, 122996 CrossRef CAS.
- S. T. Pham, M. B. Nguyen, G. H. Le, T. D. Nguyen, C. D. Pham, T. S. Le and T. A. Vu, Chemosphere, 2021, 265, 129062 CrossRef CAS PubMed.
- S. Parambadath, A. Mathew, A. Mohan and C. S. Ha, J. Environ. Chem. Eng., 2020, 8, 104248 CrossRef CAS.
- H. T. Vu, M. B. Nguyen, T. M. Vu, G. H. Le, T. T. T. Pham, T. D. Nguyen and T. A. Vu, Top. Catal., 2020, 63, 1046–1055 CrossRef CAS.
- R. Suresh, K. Giribabu, R. Manigandan, A. Stephen and V. Narayanan, RSC Adv., 2014, 4, 17146–17155 RSC.
- E. G. Vaschetto, G. A. Monti, E. R. Herrero, S. G. Casuscelli and G. A. Eimer, Appl. Catal., A, 2013, 453, 391–402 CrossRef CAS.
- K. Jeyalakshmi, S. Vijayakumar, S. Nagamuthu and G. Muralidharan, Mater. Res. Bull., 2013, 48, 760–766 CrossRef CAS.
- A. I. Mtz-Enriquez, C. Gomez-Solis, A. I. Oliva, A. Zakhidov, P. M. Martinez, C. R. Garcia, A. Herrera-Ramirez and J. Oliva, Mater. Chem. Phys., 2020, 244, 122698 CrossRef CAS.
- A. Pal, T. Das, S. Ghosh and M. Nandi, Dalton Trans., 2020, 49, 12716–12730 RSC.
- Y. Zhao, W. Wang, X. Jing, X. Gong, H. Wen and Y. Deng, J. Anal. Appl. Pyrolysis, 2020, 146, 104755 CrossRef CAS.
- S. An, G. Zhang, T. Wang, W. Zhang, K. Li, C. Song, J. T. Miller, S. Miao, J. Wang and X. Guo, ACS Nano, 2018, 12, 9441–9450 CrossRef CAS PubMed.
- X. Wang, L. Wang, B. Zhang, J. Feng, J. Zhang, X. Ou, F. Hou and J. Liang, J. Energy Chem., 2021, 59, 126–133 CrossRef.
- M. D. Donohue and G. L. Aranovich, Adv. Colloid Interface Sci., 1998, 76–77, 137–152 CrossRef CAS.
- G. Mitran, R. Ahmed, E. Iro, S. Hajimirzaee, S. Hodgson, A. Urdă, M. Olea and I. C. Marcu, Catal. Today, 2018, 306, 260–267 CrossRef CAS.
- E. Aawani, N. Memarian and H. R. Dizaji, J. Phys. Chem. Solids, 2019, 125, 8–15 CrossRef CAS.
- S. Usharani and V. Rajendran, Colloid Interface Sci. Commun., 2018, 24, 7–12 CrossRef CAS.
- M. M. Margoni, S. Mathuri, K. Ramamurthi, R. R. Babu and K. Sethuraman, Appl. Surf. Sci., 2017, 418, 280–290 CrossRef CAS.
- R. Abazari, S. Sanati and L. A. Saghatforoush, Chem. Eng. J., 2014, 236, 82–90 CrossRef CAS.
- T. K. Le, M. Kang, V. T. Tran and S. W. Kim, Mater. Sci. Semicond. Process., 2019, 100, 159–166 CrossRef CAS.
- X. N. Pham, H. T. Nguyen, T. N. Pham, T. T. B. Nguyen, M. B. Nguyen, V. T. T. Tran and H. V. Doan, J. Taiwan Inst. Chem. Eng., 2020, 114, 91–102 CrossRef CAS.
- Y. Nosaka and A. Nosaka, ACS Energy Lett., 2016, 1, 356–359 CrossRef CAS.
- M. B. Nguyen, G. H. Le, T. Duy, Q. K. Nguyen, T. Trang, T. Pham, T. Lee and T. A. Vu, J. Hazard. Mater., 2021, 420, 126560 CrossRef CAS PubMed.
- A. Kumar, G. Sharma, M. Naushad, A. H. Al-muhtaseb and A. Kumar, J. Environ. Manage., 2019, 231, 1164–1175 CrossRef CAS PubMed.
- T. Jayaraman, S. A. Raja, A. Priya, M. Jagannathan and M. Ashokkumar, New J. Chem., 2015, 39, 1367–1374 RSC.
Footnote |
| † Electronic supplementary information (ESI) available. See DOI: 10.1039/d1ra06901b |
| This journal is © The Royal Society of Chemistry 2021 |