
 Open Access Article
 This Open Access Article is licensed under a Creative Commons Attribution-Non Commercial 3.0 Unported Licence
Efficient third harmonic generation from FAPbBr3 perovskite nanocrystals†
Andrea
Rubino‡
a,
Tahiyat
Huq‡
b,
Jakub
Dranczewski
 b,
Gabriel
Lozano
a,
Mauricio E.
Calvo
a,
Stefano
Vezzoli
b,
Hernán
Míguez
*a and
Riccardo
Sapienza
*b
b,
Gabriel
Lozano
a,
Mauricio E.
Calvo
a,
Stefano
Vezzoli
b,
Hernán
Míguez
*a and
Riccardo
Sapienza
*b
aInstitute of Materials Science of Seville, Consejo Superior de Investigaciones Científicas (CSIC)-Universidad de Sevilla (US), Américo Vespucio 49, 41092, Seville, Spain. E-mail: h.miguez@csic.es
bThe Blackett Laboratory, Department of Physics, Imperial College London, London SW7 2BW, UK. E-mail: r.sapienza@imperial.ac.uk
First published on 4th November 2020
Abstract
The development of versatile nanostructured materials with enhanced nonlinear optical properties is relevant for integrated and energy efficient photonics. In this work, we report third harmonic generation from organic lead halide perovskite nanocrystals, and more specifically from formamidinium lead bromide nanocrystals, ncFAPbBr3, dispersed in an optically transparent silica film. Efficient third order conversion is attained for excitation in a wide spectral range in the near infrared (1425 nm to 1650 nm). The maximum absolute value of the modulus of the third order nonlinear susceptibility of ncFAPbBr3, χ(3)NC, is derived from modelling both the linear and nonlinear behaviour of the film and is found to be χ(3)NC = 1.46 × 10⁻¹⁹ m2 V−2 (or 1.04 × 10⁻¹¹ esu) at 1560 nm excitation wavelength, which is of the same order as the highest previously reported for purely inorganic lead halide perovskite nanocrystals (3.78 × 10⁻¹¹ esu for ncCsPbBr3). Comparison with the experimentally determined optical constants demonstrates that maximum nonlinear conversion is attained at the excitonic resonance of the perovskite nanocrystals where the electron density of states is largest. The ease of synthesis, the robustness and the stability provided by the matrix make this material platform attractive for integrated nonlinear devices.
Introduction
Halide perovskites offer an interesting platform as nonlinear optical materials1 due to their favourable photophysical properties, such as strong absorption above bandgap,2 high dielectric constant3 and the presence of strong excitonic resonances. In particular, high bandgap perovskites4,5 and systems confined with a high binding energy6 and large oscillator strength,7 should give rise to an excellent nonlinear performance. The centrosymmetric crystal structure of halide perovskites allows for third-order nonlinear effects, such as third harmonic generation (THG), light induced modulation and saturable absorption in single crystals of bulk material,8 polycrystalline thin films9 and 2D layered perovskites.10 Furthermore, one of the advantages of organic–inorganic lead (Pb) halide perovskites is that versatile chemical composition APbX3 with the easily changeable cation A (methylammonium, formamidinium, cesium) and anion X (chlorine, bromine, iodine) allows for improved stability,11 control over the photophysical properties in the visible spectrum,12 and a reversible bandgap tunability,13 features that are relevant for the development of light emitting devices.14 In this context, formamidinium-based perovskites have already demonstrated greater stability than their paradigmatic methylammonium-based counterparts, which makes them particularly interesting for optoelectronic applications based on their photoemission properties.15Alternatively, reducing the crystal size, if comparable to the characteristic exciton Bohr radius of the semiconductor, provides another way of tuning the spectral position of the third harmonic through the electronic bandgap shift resulting from quantum confinement effects. This approach makes unnecessary changing the chemical composition, thus avoiding problems related to phase segregation or structural instability.13 In this context, efficient second and third order optical nonlinearities have been observed for all inorganic CsPbX3 nanocrystals (ncCsPbX3), where X = Cl, Br or I,16 with maximum nonlinear conversion efficiencies and susceptibilities being reported for CsPbBr3 nanocrystals.17
In this work, we report evidence of THG from ligand free organic lead halide perovskite nanocrystals. We employ formamidinium lead bromide (CH(NH2)2PbBr3 or FAPbBr3) perovskite nanocrystals with diameters below 10 nm embedded in a transparent porous thin film matrix made of SiO2 particles. By varying the NIR excitation wavelength, efficient third order emission is observed from ncFAPbBr3 within the 475–550 nm wavelength range. We find that the highest value of the third order nonlinear susceptibility, χ(3)NC = (1.46 ± 0.19) × 10−19 m2 V−2 (i.e., 1.04 × 10⁻¹¹ esu), is similar to the best one reported so far for purely inorganic colloidal perovskite nanocrystals (3.78 × 10⁻¹¹ esu for ncCsPbBr3) (measured with z-scan),1,17 whose processing is much more involved due to the presence of organic ligands. Interestingly, this occurs when excitation takes place at λ = 1560 nm and hence when the third order emission occurs at λ/3 = 520 nm, i.e., when it matches the excitonic resonance. The third order nonlinear conversion efficiency, measured as the ratio between the power of the third harmonic and that of the pump laser, is 4.27 × 10⁻⁶ for a film of 1300 nm embedding ncFAPbBr3 at 6.5 vol%. From a practical perspective, the system we present also offers the versatility and ease of fabrication necessary to make these materials attractive for technological applications or for integration into more complex architectures.
Results and discussion
Fabrication process
The fabrication process of perovskite nanocrystals consists of a template synthesis method using a porous matrix, as reported in a previous work.18 The porous matrix structure is formed by a 1300 nm-thick highly uniform layer made of silicon dioxide (SiO2) nanoparticles of 30 nm diameter deposited by dip coating (Fig. 1a) onto a glass substrate. This gives rise to an optically transparent porous film of 50% porosity that has been thoroughly analysed elsewhere.18 Subsequently, a solution containing the FAPbBr3 perovskite precursors is infiltrated into the matrix by spin-coating. A final thermal treatment at 100 °C promotes the rapid crystallisation of the perovskite within the pores. By controlling the concentration of the precursors solution that is infiltrated into the void space of the porous matrix and the final rotation speed, we assure that the formation of perovskite nanocrystals occurs exclusively inside the pores, avoiding the presence of macro-crystals on the surface. In what follows, we will refer to this composite as ncFAPbBr3@SiO2. The SiO2 matrix has a multilayer structure which is visible via a cross-section in transmission electron microscopy, shown in Fig. 1b. As presented in Fig. 1c, the presence of perovskite nanocrystals is disclosed as brighter regions in the high-angle annular dark-field (HAADF) image. Perovskite nanocrystals inclusion in the matrix is also corroborated by the EDX lead mapping of the same section. The high-resolution micrograph presented in Fig. 1f illustrates that FAPbBr3 nanocrystals present an average diameter of 9 nm. For the sake of comparison, we synthesized a FAPbBr3 film using the same precursor solution directly spin-coated on a bare glass substrate.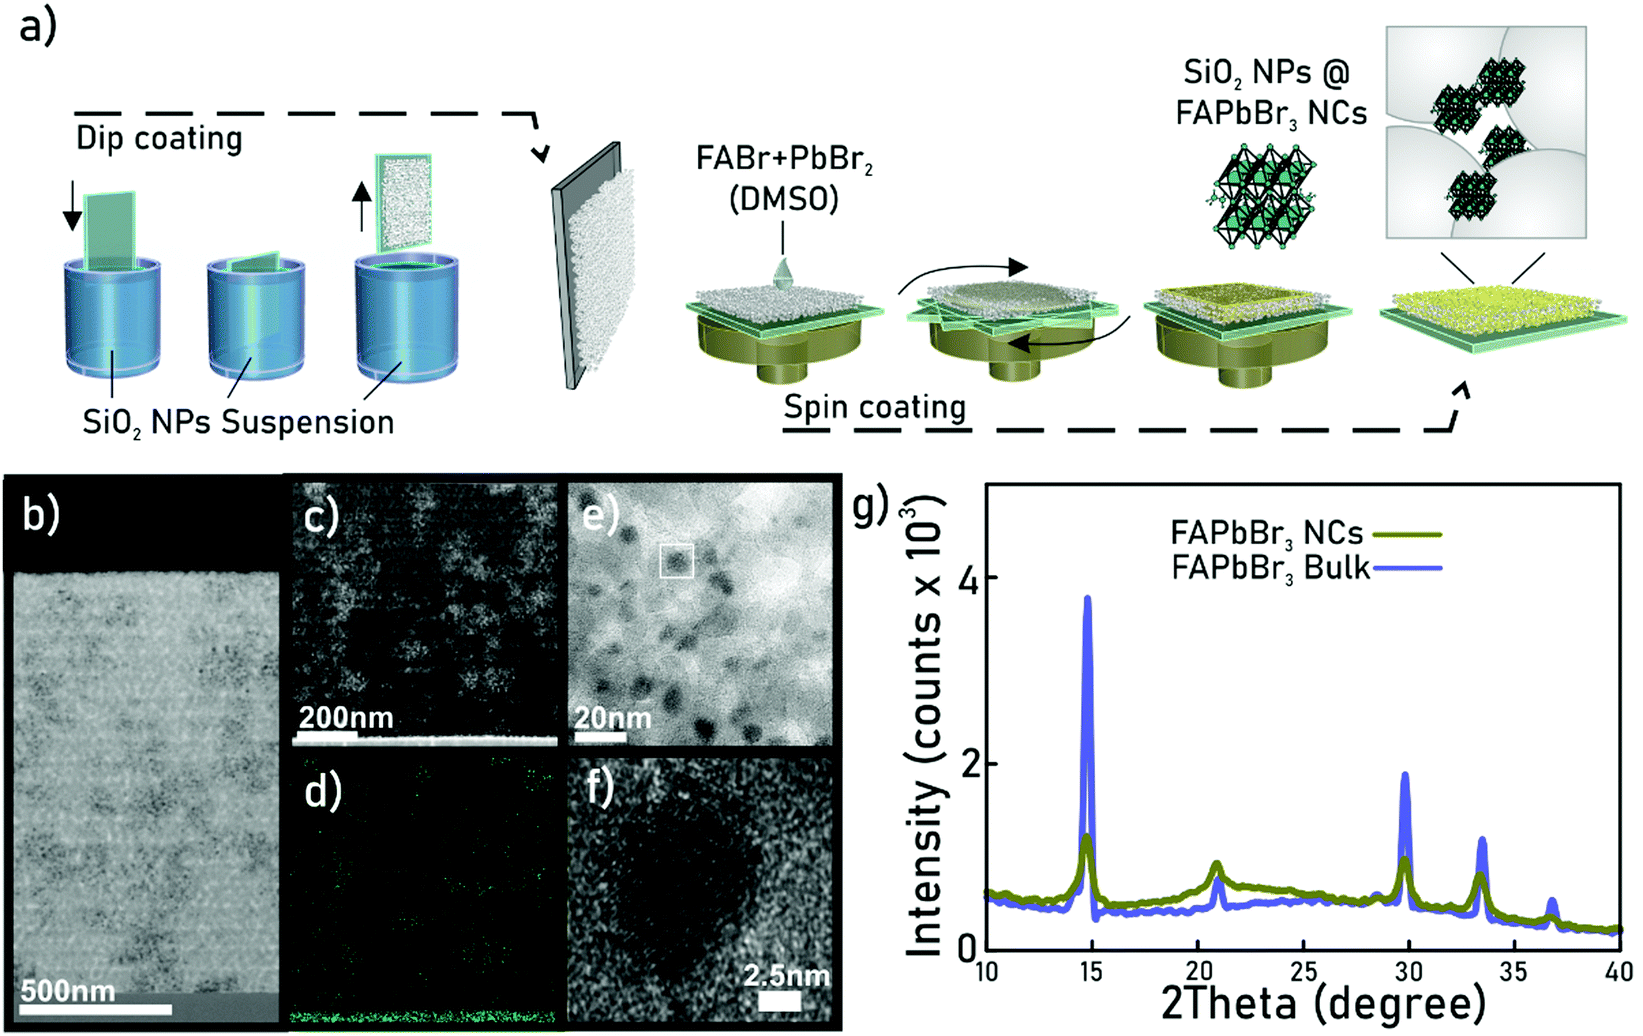 | ||
| Fig. 1 Fabrication process. (a) Scheme of the ncFAPbBr3@SiO2 film fabrication process. (b) low magnification TEM cross section of a ncFAPbBr3@SiO2 film. (c) HAADF-STEM image of a cross section and (d) the corresponding Pb mapping using EDX. (e) HRTEM micrograph of a ncFAPbBr3@SiO2 film, in which nanocrystals can be seen. (f) A closer look to a single FAPbBr3 nanocrystal. (g) XRD patterns of ncFAPbBr3@SiO2 (green line) and bulk (blue line) films. | ||
The X-ray diffraction performed at a grazing angle on the ncFAPbBr3@SiO2 and bulk FAPbBr3 films demonstrated that both samples have the same cuboid crystalline structure (Fig. 1g). Our synthetic strategy avoids the addition of organic ligands, characteristic of colloidal semiconductor nanocrystals,19 and hence facilitates the analysis of the nonlinear properties of the ensemble. Simultaneously, self-aggregation is prevented, as the matrix also favours the dispersion of the nanocrystals.18,20,21 Quantitative analysis of the elemental lead present in the film by Inductively Coupled Plasma Atomic Emission Spectroscopy (ICP-AES) reveals a 6.5 ± 0.1 vol% of FAPbBr3 nanocrystals in the film, which implies that silica and air occupy 50% and 43.5% of the composite volume respectively.
Linear optics characterisation
ncFAPbBr3@SiO2 films show exciton quantum confinement effects, as evidenced in Fig. 2a, where a 45 meV blue-shift of the photoluminescence peak, with respect to that of the bulk perovskite, can be clearly seen. This results from the exciton wave function confinement inside the FAPbBr3 nanocrystals. The emission spectral width also shows the absence of significant inhomogeneous broadening, hence supporting the presence of a narrow nanocrystal size distribution within the matrix. In parallel, Fig. 2b shows the absorptance of a ncFAPbBr3@SiO2 film (green line) and of a bulk, 300 nm thick, FAPbBr3 film (blue line), estimated by measuring total reflection and total transmission with an integrating sphere (DRA-2500, Agilent) attached to a UV-Vis-NIR spectrophotometer (Cary 5000, Agilent). Please note that, consistently, a blue-shift of the absorption band edge is observed.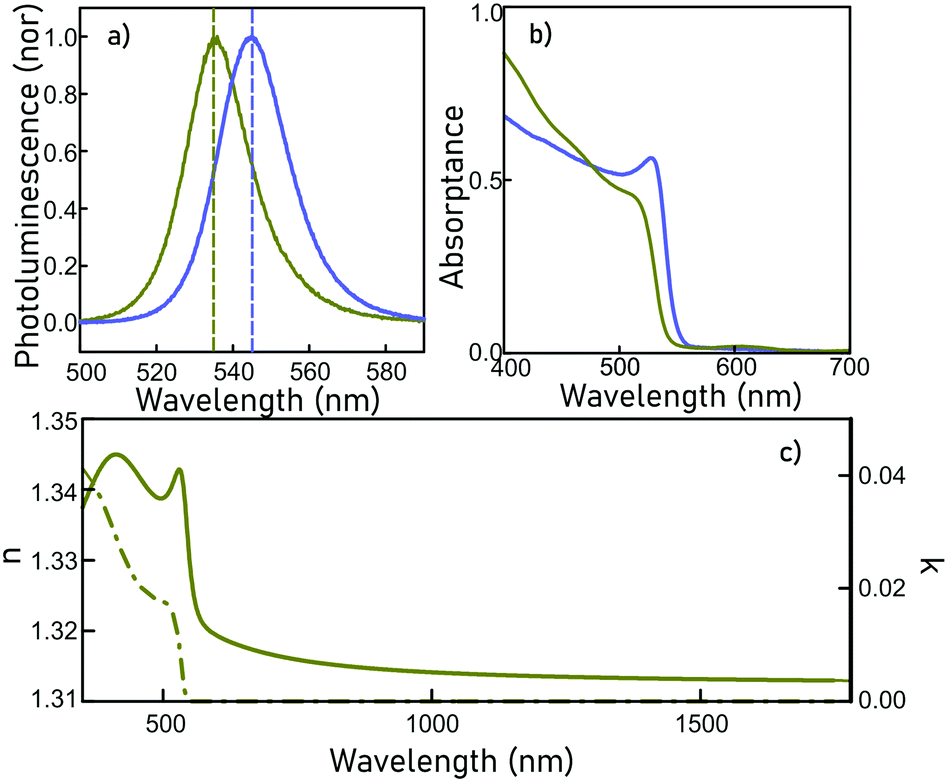 | ||
| Fig. 2 Linear optics measurements. (a) Normalised photoluminescence spectra of ncFAPbBr3@SiO2 and a FAPbBr3 bulk films (green and blue lines, respectively). Dotted lines indicate the spectral position of the PL maxima and are just a guide for the eye. (b) Absorptance of ncFAPbBr3@SiO2 and FAPbBr3 bulk films (green and blue lines, respectively). (c) Refractive index and extinction coefficient (solid and dotted lines respectively) of a ncFAPbBr3@SiO2 film. | ||
The refractive index, n, and extinction coefficient, κ, of the ncFAPbBr3@SiO2 film are obtained from the fittings of the measured optical reflectance and transmittance at different incidence angles (UMA, Agilent, Cary 7000),22 and are displayed in Fig. 2c. Both n and κ increase sharply for energies above the bandgap, while for lower energies κ is imposed to be zero and n is approximately 1.315, which is consistent with the expected filling fractions of silica, air and semiconductor in the composite. Knowing the refractive index of the medium, as well as the fill factor of each component, we can estimate the optical constants of the embedded FAPbBr3 nanocrystals, obtained using the Forouhi–Bloomer model,23 which will be later required to estimate its nonlinear coefficients.
Third-harmonic generation measurements
THG is the emission of a wave of frequency 3ω after excitation by an incident field of frequency ω (the pump), and it is mediated by the induced nonlinear polarisability, whose strength is quantified by the third order nonlinear susceptibility, χ(3). In our case, an excitation laser source (Yb:KGW PHAROS, Light Conversion) with 200 fs pulses and 100 KHz repetition rate is pumping an optical parametric amplifier (ORPHEUS, Light Conversion), producing pulses with energy of 0.5–1 μJ, tunable between 1340 nm to 1740 nm. The THG from the ncFAPbBr3@SiO2 film is excited at normal incidence by focusing the pump laser down to a ∼68 micrometer (FWHM) spot. The THG signal in the transmission direction is coupled into a fiber spectrometer (Flame, Ocean Optics) or into a power-meter for measurements of absolute efficiency. A detailed sketch of the setup is presented as ESI.† The laser power, Plaser1, is maintained at 15 mW for all pump wavelengths throughout the measurements, corresponding to an intensity of ∼7 GW cm−2, well below the sample damage threshold (Plaser1 = 117 mW, corresponding to an intensity of ∼50 GW cm−2.)Spectra taken from ncFAPbBr3@SiO2 films at different pump wavelengths between 1300–1740 nm, a selection of which are plotted in Fig. 3a (shaded areas), show sharp peaks at the third harmonic wavelength in the range 450–570 nm. These peaks have an intensity that depends on the frequency of the pump field, as shown in Fig. 3b. As a reference, the third harmonic spectra of a 1 mm thick glass microscope slide are also measured to factor out the fluctuations in intensity and beam-diameter of the laser pump beam. Glass is characterized by a spectrally flat nonlinear susceptibility,24 with value χ(3)glass = (1.6 ± 0.2) × 10−22 m V−2 (measured via THG).25
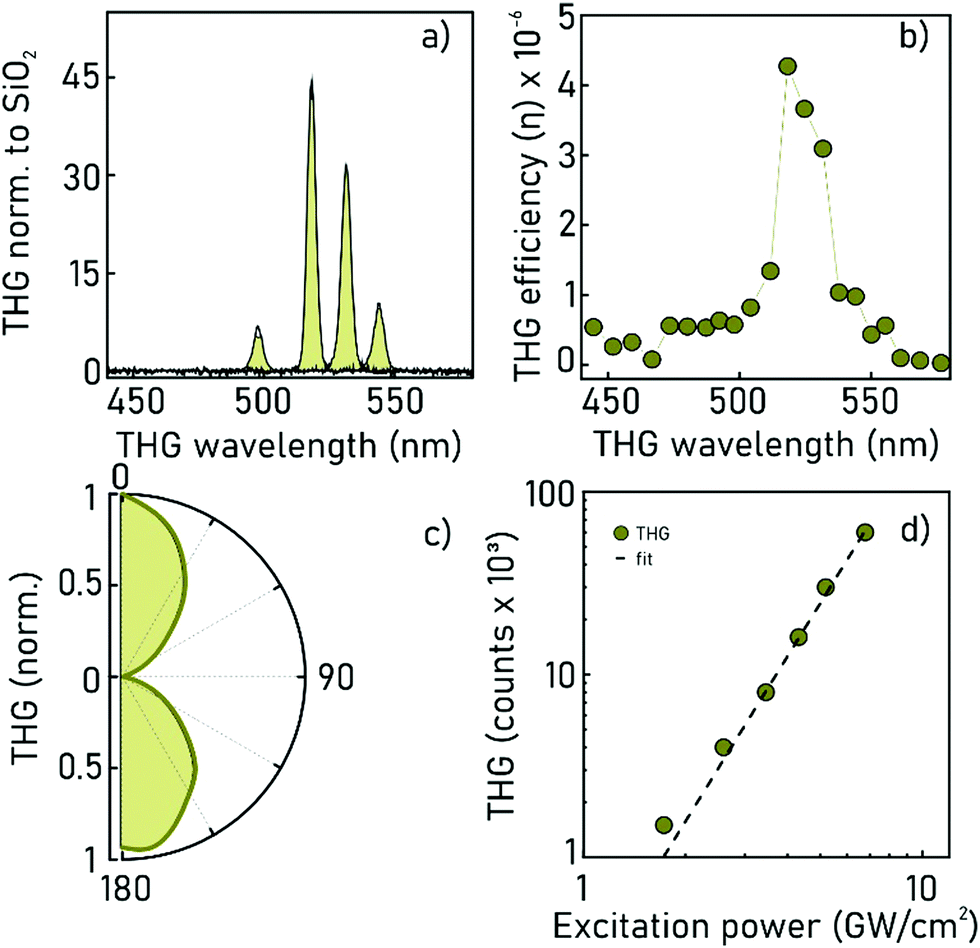 | ||
| Fig. 3 THG from ncFAPbBr3@SiO2 film. (a) Spectra of selected third harmonic emission lines attained from the film. Results are normalised to the THG maximum efficiency of silica glass. (b) Absolute THG efficiency from a ncFAPbBr3@SiO2 film. (c) Polarisation analysis of the third harmonic beam (λ1 = 1540 nm, λ3 = 513 nm). (d) Log–log plot of the third harmonic beam intensity versus pump power at λ1 = 1500 nm for the ncFAPbBr3@SiO2 film. The fitting (dashed line) demonstrates a linear dependence with slope 3 on the excitation power. | ||
The absolute efficiency of the generated third harmonic from a ncFAPbBr3@SiO2 composite film is reported in Fig. 3b. The absolute efficiency, η, is measured from η = Pcomposite3/Plaser1, where Pcomposite3 is the measured power of the third harmonic signal of the sample. A maximum conversion efficiency of 4.27 × 10⁻⁶ is attained for excitation at 1560 nm. In addition, the nature of the THG signal transmitted through the film is verified by recording the polarization of the generated third harmonic from the ncFAPbBr3@SiO2 films as shown in Fig. 3c, which, as expected, preserves the linear polarisation of the incident beam. Furthermore, by measuring the intensity of the generated third harmonic signal as a function of the excitation power, the characteristic cubic-dependence of a third-order effect is confirmed, as shown in Fig. 3d.
Extraction of nonlinear susceptibility
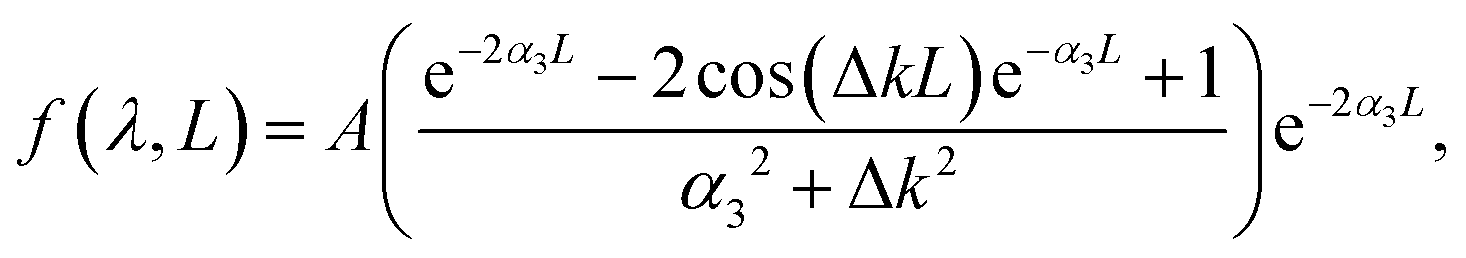
From the experimental spectral measurements of the THG signal from the ncFAPbBr3@SiO2 film in the wavelength range 1340–1740 nm, the spectral behaviour of the third-order susceptibility of the FAPbBr3 nanocrystals, χ(3)NC, can be extracted. In order to do so, we employ an analytical solution of nonlinear Maxwell's equations used to model the intensity of the third harmonic emission, I3, from thin films.26 The model is applicable when the pump is neither depleted in the film because of the nonlinear process (a common assumption when the energy conversion has low efficiency), nor is attenuated by linear absorption. The model also assumes plane waves, which is a very good approximation in our case where the pump is not tightly focused, and the thickness of the sample is of the order of the wavelength. The model also uses the slowly-varying amplitude approximation.| I3 = f(λ,L)|χ(3)|2I31, | (1) |
 | (2) |
 | (3) |
 | (4) |
Based on our determination of the dielectric constant of the composite film, we can now plot the spectral behaviour of α(λ) and Δk(λ) in the selected experimental range. This is done in Fig. 4a, where α(λ) is drawn as a green solid line and, as expected, falls off abruptly for energies below the electronic bandgap. The phase mismatch Δk(λ) (grey dashed line) follows the same spectral behaviour of the real part of the linear refractive index of the ncFAPbBr3@SiO2 film (Fig. 2c), presenting a sharp increase for energies above the bandgap.
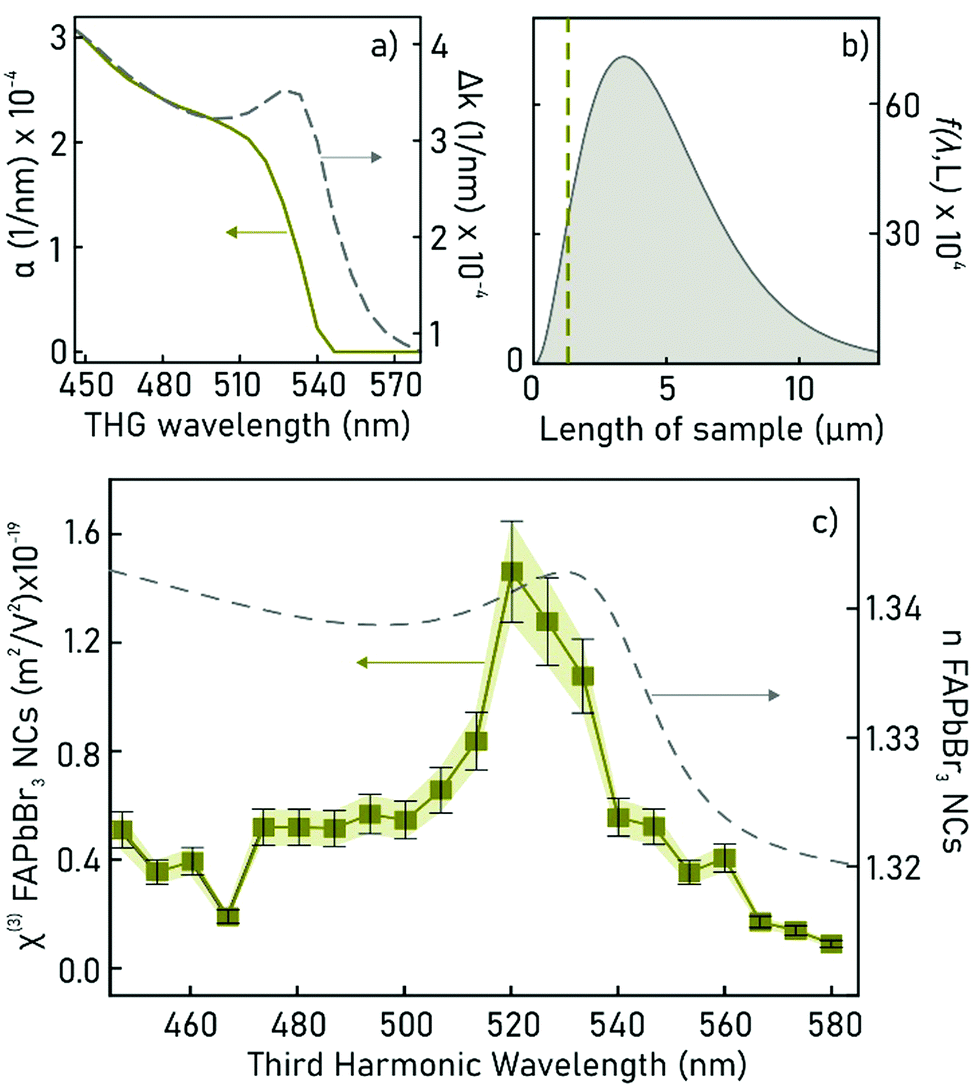 | ||
| Fig. 4 Extraction of third-order nonlinear susceptibility (χ(3)NC) of a ncFAPbBr3@SiO2 film. (a) Spectral behaviour of the absorption coefficient of the third harmonic wave and the phase mismatch between the fundamental and the third harmonic waves. (b) Calculated f(λ,L), which is proportional to third harmonic intensity, versus ncFAPbBr3@SiO2 film thickness (λ1 = 1560 nm, λ3 = 520 nm). The vertical dashed line indicates the actual thickness of the composite film (1300 nm). (c) Spectral dependence of both the estimated third order nonlinear susceptibility of the FAPbBr3 nanocrystals after volume correction and the linear refractive index of the composite (dashed line). | ||
We then study the effects of film thickness L on the modelled function, f(λ,L), given by eqn (2) and that determines the effect of the excitation length on the generated third harmonic, as indicated by eqn (1). For a fixed pump wavelength of 1560 nm, where the maximum THG intensity from the ncFAPbBr3@SiO2 composite film is experimentally observed, the length dependency of f(λ,L) is shown in Fig. 4b. THG has a quick raise and a sharp decrease for L larger than the absorption length in the medium, as show in Fig. 4b. The green dashed line indicates the thickness of the composite FAPbBr3 nanocrystal film (which is 1300 nm). Our model reveals that the efficiency of the THG from the composite FAPbBr3 nanocrystal film could be further increased by a factor of around 2 by fine tuning the film thickness.
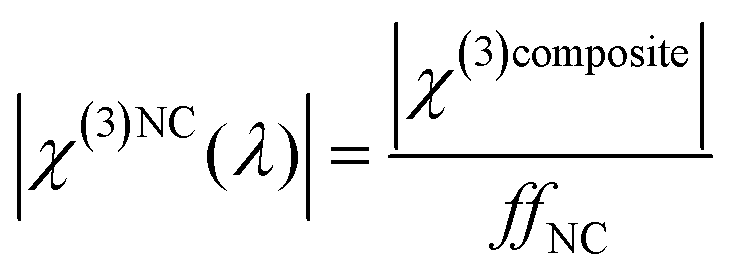
Finally, the extraction of the third-order susceptibility of the composite film (χ(3)composite), at each measured pump wavelength in the range 1340–1740 nm, can be extracted from the experimental values of the peak THG intensity from the ncFAPbBr3@SiO2 film with eqn (1). In order to account for the spectral fluctuations of the pump intensity, I1, in this equation, we take a ratio of the generated THG by the composite nanocrystal film to the THG generated by the microscope slide. This ensures that I1 is kept the same across the spectral measurements for both the sample and the reference, hence the fluctuations across different wavelengths can be cancelled out when taking the ratio (see ESI†). From this, an absolute value of χ(3)composite is found by multiplying by the spectrally-flat third-order nonlinear susceptibility of glass, χ(3)glass. Knowing that the volume filling fraction of perovskite nanocrystals in the composite film is ffNC = 0.065, we can estimate the spectrally dependent third-order nonlinear susceptibility of ncFAPbBr3, χ(3)NC, shown in Fig. 4c. This treatment assumes that the χ(3)NC is much greater than that of the encapsulating SiO2 matrix. In this approximation the third-order susceptibility of ncFAPbBr3 is:
 | (5) |
Conclusions
We have found experimental evidence of nonlinear third harmonic generation from organic lead halide perovskite nanocrystals. Full characterization of the dependence of the efficiency of this process was performed for FAPbBr3 nanocrystals embedded in a porous film for a wide range of near infrared excitation wavelengths, as well as an analysis of the effect of film thickness. A detailed characterization of the optical constants of the composite allows us to establish that maximum nonlinear conversion is achieved at the excitonic resonance, for which a third-order nonlinear susceptibility of 1.46 ± 0.19 × 10⁻¹⁹ m2 V−2 (1.04 × 10⁻¹¹ esu) is reported, which is, to the best of our knowledge, the largest reported for organic cation based perovskite nanocrystals so far, and of the same order than the best ones reported for purely inorganic colloidal perovskite nanocrystals. Our work expands the range of optoelectronic applications of perovskite quantum dots, already widely studied in the fields of solar energy conversion and lighting, to that of nonlinear optics.Conflicts of interest
There are no conflicts to declare.Acknowledgements
We would like to acknowledge the Spanish Ministry of Science, Innovation and Universities for funding under grant MAT2017-88584-R (AEI/FEDER,UE), and by EPSRC and URKI (EP/P033369 and EP/M013812). TH would like to acknowledge funding under the Schrödinger Scholarship programme.Notes and references
- J. Xu, X. Li, J. Xiong, C. Yuan, S. Semin, T. Rasing and X.-H. Bu, Adv. Mater., 2019, 1806736 Search PubMed.
- B. Wenger, P. K. Nayak, X. Wen, S. V. Kesava, N. K. Noel and H. J. Snaith, Nat. Commun., 2017, 8, 590 CrossRef.
- E. J. Juarez-Perez, R. S. Sanchez, L. Badia, G. Garcia-Belmonte, Y. Soo Kang, I. Mora-Sero and J. Bisquert, J. Phys. Chem. Lett., 2014, 5, 2390 CrossRef CAS.
- X. Chen, H. Lu, Y. Yang and M. C. Beard, J. Phys. Chem. Lett., 2018, 9, 2595 CrossRef CAS.
- O. A. Lozhkina, V. I. Yudin, A. A. Murashkina, V. V. Shilovskikh, V. G. Davydov, R. Kevorkyants, A. V. Emeline, Y. V. Kapitonov and D. W. Bahnemann, J. Phys. Chem. Lett., 2018, 9, 302 CrossRef CAS.
- D. Marongiu, M. Saba, F. Quochi, A. Mura and G. Bongiovanni, J. Mater. Chem. C, 2019, 7, 12006 RSC.
- X. Chen, Y. Wang, J. Song, X. Li, J. Xu, H. Zeng and H. Sun, J. Phys. Chem. C, 2019, 123, 10564 CrossRef CAS.
- D. J. Clark, C. C. Stoumpos, F. O. Saouma, M. G. Kanatzidis and J. I. Jang, Phys. Rev. B, 2016, 93, 195202 CrossRef.
- J. C. Johnson, Z. Li, P. F. Ndione and K. Zhu, J. Mater. Chem. C, 2016, 4, 4847 RSC.
- I. Abdelwahab, G. Grinblat, K. Leng, Y. Li, X. Chi, A. Rusydi, S. A. Maier and K. Ping Loh, ACS Nano, 2018, 12, 644 CrossRef CAS.
- C. Yi, J. Luo, S. Meloni, A. Boziki, N. Ashari-Astani, C. Grätzel, S. M. Zakeeruddin, U. Röthlisberger and M. Grätzel, Energy Environ. Sci., 2016, 9, 656 RSC.
- B. Park, B. Philippe, S. M. Jain, X. Zhang, T. Edvinsson, H. Rensmo, B. Zietz and G. Boschloo, J. Mater. Chem. A, 2015, 3, 21760 RSC.
- D. Myung Jang, K. Park, D. Hwan Kim, J. Park, F. Shojaei, H. Seok Kang, J.-P. Ahn, J. Woon Lee and J. Kyu Song, Nano Lett., 2015, 15, 5191 CrossRef.
- J. Li, L. Xu, T. Wang, J. Song, J. Chen, J. Xue, Y. Dong, B. Cai, Q. Shan, B. Han and H. Zeng, Adv. Mater., 2017, 29, 1603885 CrossRef.
- J. Yang, Z. Liu, M. Pi, H. Lin, F. Zeng, Y. Bian, T. Shi, J. Du, Y. Leng and X. Tang, Adv. Opt. Mater., 2020, 8, 2000290 CrossRef CAS.
- Y. Wang, X. Li, X. Zhao, L. Xiao, H. Zeng and H. Sun, Nano Lett., 2016, 16, 448 CrossRef CAS.
- S. Liu, G. Chen, Y. Huang, S. Lin, Y. Zhang, M. He, W. Xiang and X. Liang, J. Alloys Compd., 2017, 724, 889 CrossRef CAS.
- A. Rubino, M. Anaya, J. F. Galisteo-López, T. C. Rojas, C. M. E. Calvo and H. Míguez, ACS Appl. Mater. Interfaces, 2018, 10, 38334 CrossRef CAS.
- S. ten Brinck, F. Zaccaria and I. Infante, ACS Energy Lett., 2019, 4, 2739 CrossRef CAS.
- M. Anaya, A. Rubino, T. C. Rojas, J. F. Galisteo-López, M. E. Calvo and H. Míguez, Adv. Opt. Mater., 2017, 5, 1601087 CrossRef.
- A. Rubino, L. Caliò, A. García-Bennett, M. E. Calvo and H. Míguez, Adv. Opt. Mater., 2020, 8, 1901868 CrossRef CAS.
- J. Ávila, C. Momblona, P. Boix, M. Sessolo, M. Anaya, G. Lozano, K. Vandewal, H. Míguez and H. J. Bolink, Energy Environ. Sci., 2018, 11, 3292 RSC.
- A. R. Forouhi and I. Bloomer, Phys. Rev. B: Condens. Matter Mater. Phys., 1986, 34, 7018 CrossRef CAS.
- D. Milam, Appl. Opt., 1998, 37, 546 CrossRef CAS.
- U. Gubler and C. Bosshard, Phys. Rev. B: Condens. Matter Mater. Phys., 2000, 61, 10702 CrossRef CAS.
- N. Youngblood, R. Peng, A. Nemilentsau, T. Low and M. Li, ACS Photonics, 2017, 4, 8 CrossRef CAS.
Footnotes |
| † Electronic supplementary information (ESI) available: Details on the extraction of the third-order nonlinear susceptibility of FAPbBr3 nanocrystals. See DOI: 10.1039/d0tc04790b |
| ‡ These two authors contributed equally to this work. |
| This journal is © The Royal Society of Chemistry 2020 |