
 Open Access Article
 This Open Access Article is licensed under a Creative Commons Attribution-Non Commercial 3.0 Unported Licence
Molecular understanding of a π-conjugated polymer/solid-state ionic liquid complex as a highly sensitive and selective gas sensor†
Katherine
Stewart
a,
Saurav
Limbu
a,
James
Nightingale
a,
Katia
Pagano
a,
Byoungwook
Park
b,
Soonil
Hong
c,
Kwanghee
Lee
 bc,
Sooncheol
Kwon
*b and
Ji-Seon
Kim
*a
bc,
Sooncheol
Kwon
*b and
Ji-Seon
Kim
*a
aDepartment of Physics and Centre for Processable Electronics, Imperial College London, London, SW7 2AZ, UK. E-mail: ji-seon.kim@imperial.ac.uk
bSchool of Materials Science and Engineering (SMSE), Gwangju Institute of Science and Technology (GIST), Gwangju 500-712, Republic of Korea. E-mail: kwansc@gist.ac.kr
cResearch Institute for Solar and Sustainable Energies (RISE), Gwangju Institute of Science and Technology (GIST), Gwangju 500-712, Republic of Korea
First published on 6th August 2020
Abstract
Electric-field driven chemical doping modulation in a blend of solution-processed organic semiconductors (OSCs) and solid-state ionic liquids (SSILs) in response to volatile organic compounds (VOCs) provides a new exciting opportunity to facilitate printable and low-power chemical gas sensors (chemiresistors). In order to fully exploit this opportunity, a fundamental understanding of the molecular-level interactions among the OSCs, SSILs, and VOC components during the device operation is urgently needed. Herein, we demonstrate a highly sensitive and selective VOC gas sensor using π-conjugated polymer (here, P3HT as a model homopolymer) and SSIL blends. A newly developed SSIL forms a semi-crystalline solid at room temperature. P3HT with high molecular weight and regioregularity allows an extremely well-interconnected network in blends desirable for efficient charge transport. In P3HT:SSIL blends, we identify electric-field driven strong chemical interactions between π-CP and SSIL to tune the electrical conductivity of the π-CP. The enlarged interfacial areas in blends and the solid-state nature of the SSIL ensure highly tunable electrochemical interactions between them, efficiently modulating the electrical conductivity of the π-CP further upon exposure to different polar and non-polar VOCs. Our results demonstrate the π-conjugated polymer/SSIL complex as a new highly sensitive and selective gas sensor and provide a key scientific understanding of its molecular-level operational mechanism critical for developing molecular sensors towards next generation noninvasive diagnostics.
Introduction
Solution-processed organic semiconductors (OSCs) have shown promise as semiconducting materials because they can take advantage of both tunable optoelectronic properties and solution processability, enabling their use in low-cost and large-area devices.1 OSCs are composed of alternating single and double bonds with delocalised π-electrons along the backbone. The π-electron distribution of the OSCs and their structural orientation can be readily influenced by surrounding polarisation forces from nearby atoms and molecules.2 These characteristics can potentially lead to far-reaching outcomes in the field of miniaturised electronic sensors which transduce chemical stimuli into electronic signals.3,4 Polymer sensors offer highly functionalised groups ideal for VOC sensing with high sensitivity, synthetically tunable selectivity, and room temperature operation,5 offering a competitive alternative to the inorganic electronics.6,7 However, poor electrical characteristics and low surface interactions of organic semiconductors arising from a high-degree of structural disorder and inferior dielectric properties, respectively, must be improved to ensure the desirable sensing capabilities of chemiresistors (i.e., selectivity, sensitivity, speed, and stability).8Within the context of improving the electrical characteristics of OSCs, ionic liquids have been generally used to modulate the carrier density of conjugated polymers.9 They have many properties that make them applicable to thin film fabrication, including low volatility, high thermal and chemical stability, and high ionic conductivity.10 In organic light emitting diodes (OLEDs), ionic liquids have been used to improve electron injection.9 The incorporation of ionic liquids into polymer devices has been shown to reduce series resistance, lower energy barriers, and increase charge carrier mobility.11 Ionic liquids are desirable inclusions for gas sensing applications due to their good gas solubility, tunable physiochemical properties, and air and water stability.12,13 The disparity in the surface energy and hydrophobicity of conjugated polymers and liquid state ionic liquids can cause difficulties in realising efficient devices; instead, they often have slow turn-on and require prebiasing.14 Recently, the development of a solid-state ionic liquid (SSIL) with matching surface energy and stable ion diffusion has been shown to significantly improve device performance.9
In this respect, herein, we examine a novel π-conjugated polymer/solid-state ionic liquid complex, to realize a simple solid-state device for potential gas sensing applications. This study aims to investigate the properties of the ionic liquid blend using the different chemical and physical properties of a model organic polymer, P3HT (Fig. 1a), which is a widely used semiconductor polymer. Owing to its commercial availability, it is the ideal polymer to use in novel devices. There is already a wealth of knowledge of the characteristics and fabrication processes of P3HT, allowing it to be easily scaled up in new technologies.15 Controls over the polymer chain length and side chain positioning allow the study of the effects of the molecular order and crystallinity. With a greater understanding of how the blend mechanism works, there is a greater potential for fine-tuning the performance and opening up a variety of different applications. Furthermore, we identify the electric-field driven chemical interactions between P3HT and the SSIL at a molecular level and their electrostatic interactions with the exposed VOC using an assay of advanced structural and optical spectroscopic techniques such as in situ resonant Raman spectroscopy and high-angle annular dark-field scanning transmission electron microscopy.
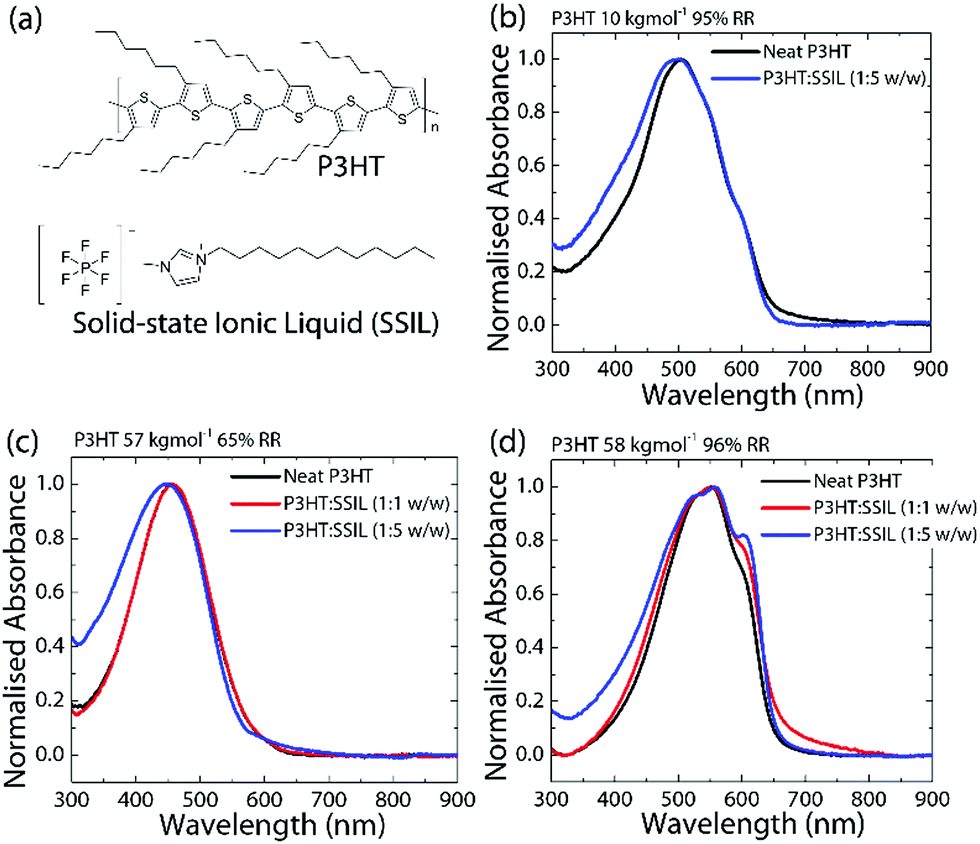 | ||
Fig. 1 (a) Chemical structure of the conjugated polymer P3HT and the solid state ionic liquid [C1C12IM+] [PF6−] (SSIL). Normalised absorbance spectra of P3HT neat, 1![[thin space (1/6-em)]](https://www.rsc.org/images/entities/char_2009.gif) :1 and 1:5 for (b) low Mw and high RR, (c) high Mw and low RR and (d) high Mw and RR P3HT blends. :1 and 1:5 for (b) low Mw and high RR, (c) high Mw and low RR and (d) high Mw and RR P3HT blends. | ||
Results and discussion
The molecular weight (Mw) dependence of the P3HT:SSIL blend was tested within the range of 10–160 kg mol−1, with a regioregularity (RR) of around 95%. The normalised absorbance values of the neat and blended films of 10 kg mol−1 95% regioregular P3HT (RR–P3HT) (low Mw, high RR) and 58 kg mol−1 96% RR–P3HT (high Mw, high RR) are shown in Fig. 1b and d, respectively. RR–P3HT shows a broad absorbance with a peak at 504 nm. When the molecular weight is increased, the absorption shows a redshift to 549 nm and an increase in the relative intensity of the 600 nm shoulder. This is an indication of an increased conjugation length and a higher molecular order.16 The effect of regioregularity was examined using P3HT samples of fixed Mw ≈ 60 kg mol−1 and regioregularities of 50–99%. Fig. 1c shows the absorbance of 57 kg mol−1 65% regio-random P3HT (RRa-P3HT) (high Mw, low RR). At a low regioregularity, the P3HT absorption shows a broad featureless absorption at a lower wavelength of 454 nm. In RRa-P3HT films, the randomly oriented side chains prevent stacking and reduce interchain interactions.17 The molecular weight and crystallinity dependence of P3HT absorbance has been well reported in the literature.16–19 The main features in the absorbance are observed between 500 and 600 nm and are attributed to both intra- and interchain interactions.20,21 Herein, our study connects such molecular weight and regioregularity dependence of P3HT with their electrical properties in a simple 2-terminal diode architecture and the efficiency of intermolecular interactions (particularly, doping) with the SSIL for chemical gas sensing applications.Optical absorption transition bands are dependent on the doping level of polymers.22 Under doped conditions, ground-state absorption peaks show significant bleaching as the proportion of the neutral polymer decreases with the concomitant appearance of a broad sub-bandgap absorption known as the polaronic band.23 The normalised absorbance (see Fig. 1b–d) of the P3HT:SSIL blend was used to examine the chemical doping and the influence of the SSIL on the P3HT electronic and morphological conditions. Since the SSIL has no absorption peaks in the visible range (Fig. S1 in the ESI†), any changes in the absorbance can be attributed to the electrostatic interactions and/or changes in the morphology of P3HT by the SSIL, however, not of the SSIL itself. The absorbance of the neat P3HT film compared to the 1:1 and 1:5 (P3HT:SSIL) blends is shown in Fig. 1b–d. There is no presence of any measurable sub-bandgap absorption, showing that the SSIL does not chemically dope P3HT in the ground state.24Fig. 1b and c show that, at low Mw and RR, blending with the SSIL shows minor changes to the overall absorbance with some broadening of the main peak at low wavelengths. This implies that the SSIL has only minor effects on the packing of the P3HT chains. Fig. 1d shows that P3HT with high Mw and RR shows an increase in the 600 nm shoulder as the blending ratio increases. This greater impact on the absorption characteristics suggests that it has a greater effect on the polymer interchain packing in comparison to lower Mw. The stronger vibronic shoulder at 600 nm is an indication of a higher molecular order.25,26 Such increases in relative absorbance suggest that blending with the SSIL increases the P3HT molecular order in the film, which is expected to have major impacts on the efficiency of intermolecular interactions between the SSIL and P3HT, resulting in different charge transport properties, as discussed below.
Electrical properties of P3HT:SSIL blends
The electrical performance of the P3HT and blends was compared via source–drain current measurements in a two-terminal diode architecture, chemiresistor (see Fig. 2a). Any changes in the electrical currents upon exposure to a given chemical gas are an indication of the presence of the analyte, i.e., a sensing response is measured by fluctuations in the resistance upon the interaction of the film with the given analyte.27,28 This architecture is particularly useful for studying the charge conduction of a semiconductor and the specific sensing mechanism of each system.29,30Fig. 2b shows the driven voltage-dependent currents across the neat and blended devices (with focus on the low-voltage regime, useful for low power devices). P3HT with both low Mw and RR shows no dependence on the applied voltage and measure a current of 10−10 A even under significant applied voltages of up to −60 V. When blended with the SSIL, the current is not enhanced showing that the ionic liquid blend has no positive effect on the conductivity of P3HT with low Mw or RR. At high Mw and RR, the neat P3HT film measures a current of 10−8 A at −0.1 V, which increases linearly with applied voltages following Ohm's law. When blended with the SSIL at a ratio of 1:1, there is an enhancement of the current level across all applied voltages, showing increased conductivity in the blended film. Blending with the SSIL also reduced the contact resistance and channel resistance by orders of magnitude from MΩ to kΩ ensuring more efficient charge injection and charge transport (Fig. S2 in the ESI†).
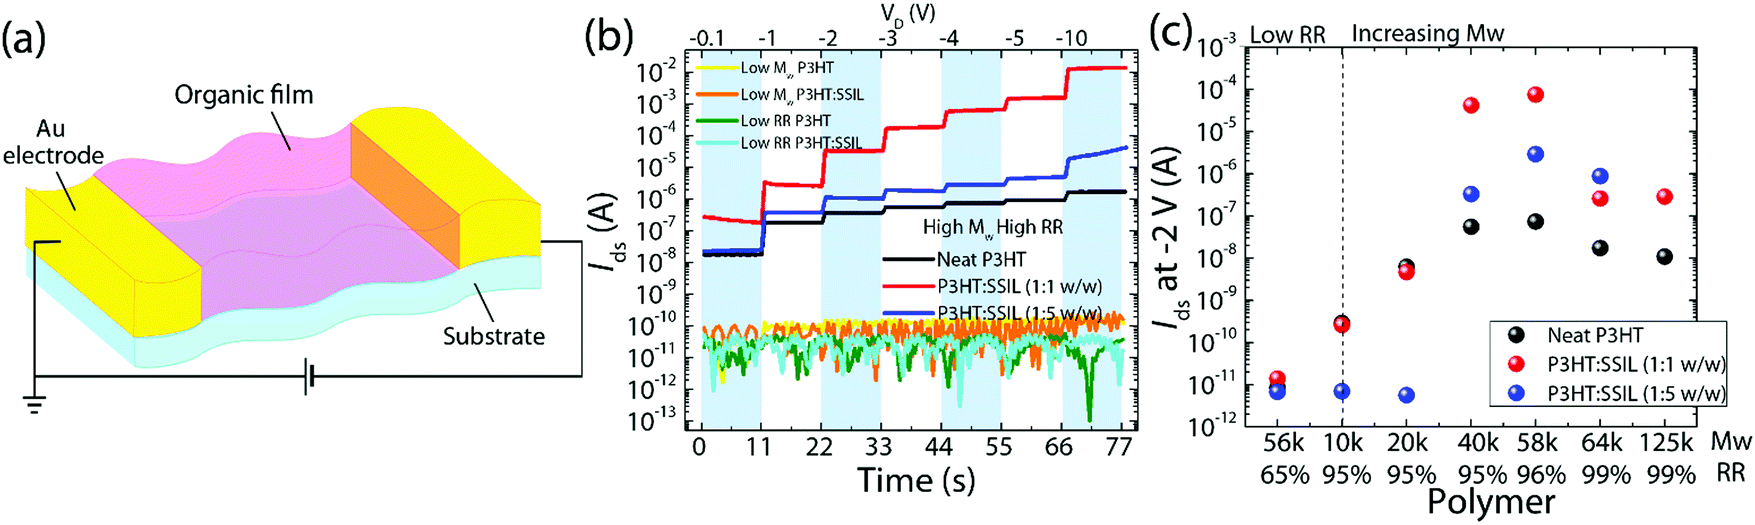 | ||
| Fig. 2 (a) Diagram of the chemiresistor device structure; (b) driven voltage dependence across the L = 5 μm and W = 2 mm chemiresistor channel and (c) mean drain current measured for each polymer under an applied bias of VD = −2 V. | ||
Fig. 2c summarises the electrical properties of P3HT dependent on its molecular weight (with the regioregularity shown in Fig. S3 in the ESI†). Here, mean currents are extracted from the driven voltage-dependent measurement at −2 V to compare across molecular weight, regioregularity, and the blending ratio. For the neat P3HT film, the current level increases from low Mw, saturating at around 40 kg mol−1, after which the extracted current level remains constant at 108 A. This correlates well with the previously reported critical molecular weight (Mc) of 34 kg mol−1 for P3HT, where the molecular packing changes from chain extended crystals to interlinked regions of crystalline lamellae.31 At low Mw, the SSIL blend shows a decrease in the current level for a high blending ratio and no enhancement when blended 1:1. When Mw is increased to 40 kg mol−1 both the 1:1 and 1:5 blends show increases in current levels under applied voltages. The P3HT:SSIL (1:1) blend with Mw = 58k and RR = 96% shows the best performance in the driven voltage dependence test, measuring a mean current of 7 × 10⁻⁵ A, which is three orders of magnitude greater than that of the corresponding neat film. The driven voltage dependence shows a clear increase in electrical performance when blended with the SSIL at high Mw and RR, showing a beneficial interaction with the SSIL. As previously discussed (via absorbance in Fig. 1b–d), such electrical current increases are not linked with ground-state chemical doping, suggesting a plausible link with electric field induced doping instead, which will be discussed in detail later (Fig. 5).
Thin film morphological characteristics
High angle annular dark-field scanning transmission electron microscopy (HAADF-STEM) was used to analyse and compare the morphology of the lowest Mw and the optimal electrical performance, 58 kg mol−1 (see Fig. 3). The neat films, shown in Fig. 3a and d for low Mw (10 kg mol−1) and high Mw (58 kg mol−1), show no features with little distinctive difference in morphology. However, the morphology of the low Mw 1:1 blended film (Fig. 3b) shows isolated large white regions on a darker background. Elemental profile scanning along the line indicated in Fig. 3c and shown in Fig. 3g can be used to examine the distribution of the two moieties in the blended film. The profile measures the proportion of P3HT by the sulphur atoms (from the thiophene ring) and the phosphorus and fluorine atoms (from the PF6− anion of the SSIL). This shows that the white isolated regions of the HAADF-STEM image in Fig. 3b essentially contain only P3HT with roughly 70 counts for sulphur compared to a count below 10 for both phosphorus and fluorine, while the surrounding dark regions measure 40 counts of both phosphorus and fluorine with no sulphur. This suggests that the low molecular weight P3HT forms localised aggregates and exhibits little intermixing with the SSIL. This correlates with the very minor changes in absorbance (discussed previously in Fig. 1) observed at low Mw; due to the segregation of the polymer and SSIL, there are minor changes to the environment for the majority of P3HT inside the aggregates and therefore no significant change in the absorbance. The morphology is confirmed on a more macroscopic scale by observing the film topography under a microscope and an atomic force microscope (Fig. S4 and S5 in the ESI†). Such fragmented nature of the semiconductor explains why the conductivity of the film is negatively impacted by blending with the SSIL at low Mw. The disruption of charge transfer pathways through the film is extensive and hopping from one region of P3HT to the next, which is likely to be limiting charge transport.
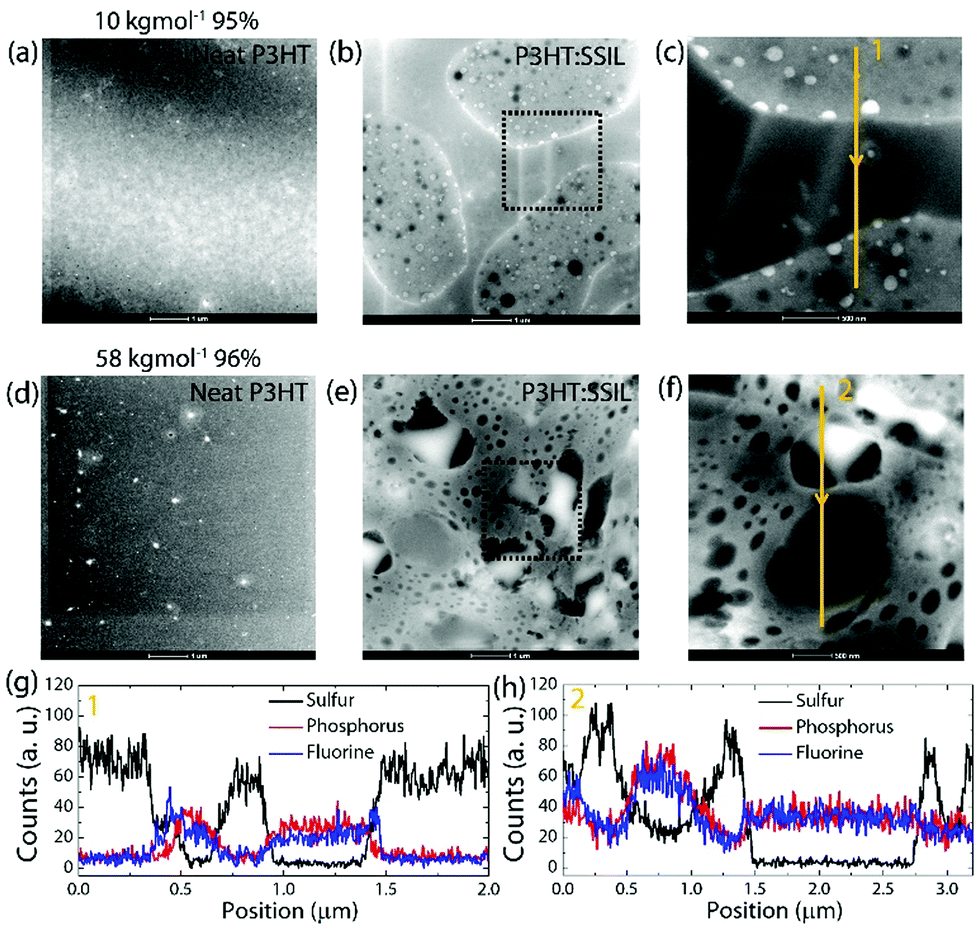 | ||
| Fig. 3 HAADF-STEM images of P3HT neat and P3HT:SSIL 1:1 films: low Mw P3HT (a) neat and (b) blend, and high Mw P3HT (d) neat and (e) blend (scale bar: 1 μm). 1-D elemental profile on the selected region of the low Mw blend ((1) c and g) and the high Mw blend ((2) f and h). | ||
In contrast, the 1:1 P3HT:SSIL blend with a high molecular weight shows a 3D porous network structure which connects across the whole sample area (see Fig. 3e). The elemental profile scan of the high molecular weight blend shows that there is a high concentration of sulphur from the P3HT component in the white interconnected areas, while the black holes contain predominantly phosphorus and fluorine from the PF6− anion. Unlike in the low Mw case, the indicators of the SSIL do not drop to zero counts in the areas containing high P3HT suggesting less segregated P3HT domains in the high Mw blend by forming 3D network structures between P3HT and the SSIL. Such a 3D blended structure is expected to enhance strong electrochemical interactions between the two components. This interconnectivity shows that transport through the blended films is much faster due to the creation of a network pathway between electrodes. Therefore, we conclude that the polymer chain packing plays a vital role in the incorporation of the SSIL into the blend. The change in the ionic liquid blending behaviour mirrors the molecular order transitions from chain extended crystals to interlinked lamella in an amorphous matrix. The interlinked lamella of high Mw P3HT is crucial to the formation of the interlinked network in the blend. The molecular order and planarity of the backbone are also shown to be important by the requirement to have a regioregularity above 90%.
VOC sensing capability
We now investigate the gas sensing ability of the highest performing blend, with high Mw and RR, testing for its response to acetone and toluene under controlled conditions. One of the potential endpoint applications of the P3HT:SSIL blend is to detect volatile organic compounds (VOCs) as biomarkers for use in breath diagnosis. The human breath contains hundreds of different VOCs32 and their relative concentrations can be very indicative of different medical conditions.33 Acetone is a polar solvent with links to medical conditions such as diabetes.34 Toluene is a non-polar solvent and is one of the benzene derivatives which can be used as an indicator of lung cancer.35The chemiresistor response to acetone and toluene at an applied voltage of VD = −2 V is displayed as a fractional change in resistance compared to the resistance before exposure (ΔR/Ro) in Fig. 4. The neat P3HT film shows a positive increase in resistance of a low magnitude at the highest concentration tested, <2% and <1% for acetone and toluene, respectively. The P3HT:SSIL (1:5) blend shows a significant enhancement in sensing response at an acetone concentration of 1500 ppm, with the maximum response of +8% with a stable response measured on the same device 7 days later (Fig. S6 in the ESI†). At a low concentration of 30 ppm, the blended film still shows a measurable reversible response to acetone. Under exposure to toluene, the blended P3HT shows a negative change in resistance (see Fig. 4d). At a high gas concentration of 1500 ppm, the response of −5% and a measurable reversible response of −0.5% are achieved at 30 ppm. The limits of detection were calculated to be 4.81 and 6.49 ppm for acetone and toluene, respectively (Fig. S7 in the ESI†). Note that the on/off response time for the toluene exposure is faster than that for the acetone exposure.
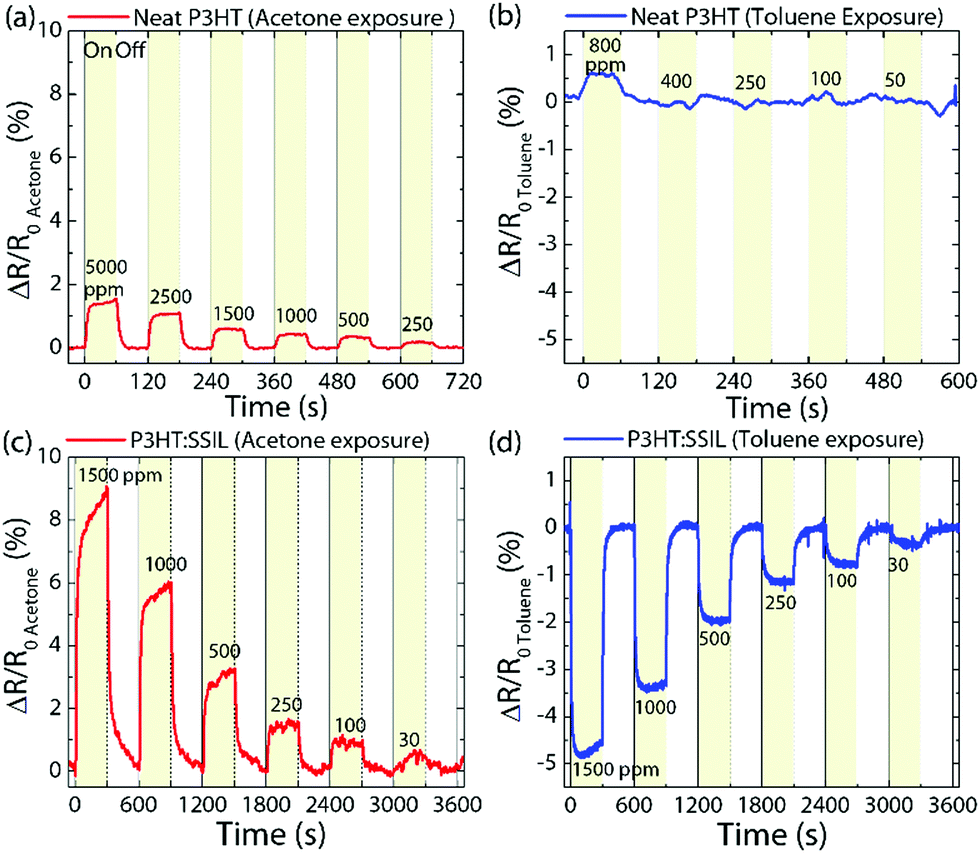 | ||
| Fig. 4 Percentage change in electronic resistance under acetone and toluene exposure at varying concentrations (ppm) for (a) and (b) neat P3HT and (c) and (d) the P3HT:SSIL 1:5 blend under an applied voltage VD = 2 V. | ||
The P3HT:SSIL blend shows selectivity between the polar acetone and the non-polar toluene. This is of particular interest as organic gas sensors often have low selectivity due to the many binding sites on the polymer chain.27 The VOC selectivity is of particular importance as it unlocks the possibility to create more accurate, cheaper, and easier to fabricate sensing arrays. The fine discriminatory abilities of the P3HT:SSIL blend are highly comparable and even superior to those of previously reported organic chemiresistors (Tables S1 and S2 in the ESI†).
Blending P3HT with the SSIL is shown to enhance the electrical properties of the chemiresistor (discussed previously in Fig. 2) which in turn increases the gas sensing response and introduces sensitivity between gas analytes. The effectiveness of the blend is determined by the molecular weight and regioregularity of the polymer. The molecular weight must exceed a critical value before the electrochemical doping properties of the SSIL are activated. A high regioregularity is required, suggesting that a higher degree of crystallinity is necessary to undergo the interaction with the SSIL. Both Mw and RR have a strong influence on the packing and morphology of the polymer chains, which in turn influences how the SSIL intermixes with P3HT and how the resulting thin film depends on the aggregation and packing of P3HT. This shows that the optimum P3HT:SSIL morphology is an interconnected P3HT pathway with a higher surface area and high conductivity. However, these methods are not able to give the full picture of what is happening at the molecular level and how the ions interact with the polymer chain.
Correlating device currents with electric field-dependent doping of the polymer by the SSIL
The specifics of device current measurements of the neat P3HT and P3HT:SSIL (1:1) blend chemiresistors are shown in Fig. 5a, while the concomitant in situ molecular probing via resonant Raman spectroscopy is shown in Fig. 5b and e for neat and blended films, respectively.9,22,23,36–38 For the neat device, the current increases linearly with the applied field with respect to Ohm's laws. For the blend, however, the current initially increases with respect to the same principle, followed by strong injection current turn-on at −1.3 V resulting in an order of magnitude higher currents compared to the neat P3HT film. Such field-dependent conductivity tuning is expected to originate from intermolecular interactions between P3HT and the SSIL, and thus Raman spectroscopy was conducted to gain insights into the chemical structure, molecular conformation, and π-electron density distribution in P3HT.39 The normalised Raman spectroscopy (Fig. S8 in the ESI†) shows that blending with the SSIL does not affect peak positions or relative intensities compared to the neat P3HT film. This confirms the absence of ground state doping (also shown by the absorbance spectra in Fig. 1) and additionally indicates that blending with the SSIL does not affect the molecular conformation of the π-conjugated backbone of P3HT.
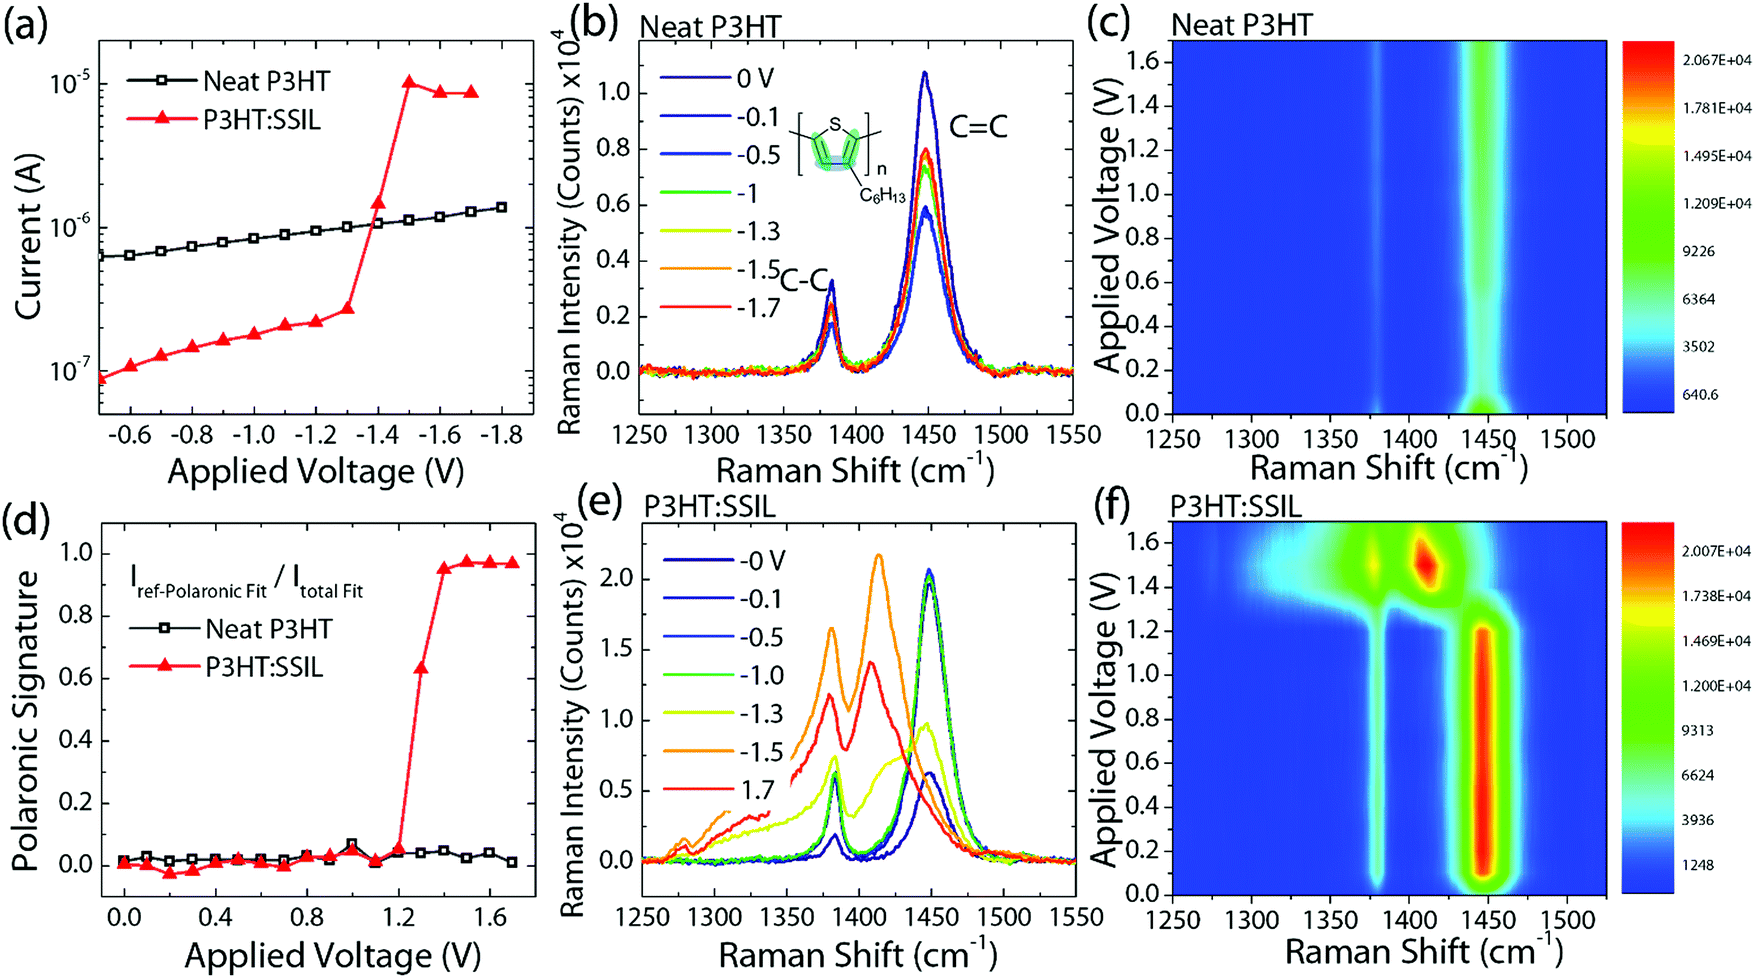 | ||
| Fig. 5
In situ field-dependent Raman spectroscopy (FDRS) of neat P3HT and the P3HT:SSIL 1:1 blend. (a) current measured during FDRS. FDRS for (b) neat P3HT and (e) the P3HT:SSIL blend. 2D Raman intensity plot at different applied voltages for (c) neat P3HT and (f) the P3HT:SSIL blend. (d) Polaronic signature fitted by a linear combination of the reference neutral and polaronic P3HT Raman peaks. | ||
As the P3HT:SSIL blends show stark enhancements of the electrical currents under applied voltages, in situ field-dependent resonant Raman spectroscopy (FDRS) was performed under device operating conditions. The FDRS of chemiresistors was conducted under 785 nm excitation, which is non-resonant with the ground-state absorption and resonant with the polaronic absorption of P3HT.23 The main features of the P3HT Raman signal are the C![[double bond, length as m-dash]](https://www.rsc.org/images/entities/char_e001.gif) C symmetric stretching mode (1450 cm−1) and the C–C intraring mode (1378 cm−1).40 For the neat P3HT film (58k 96% RR) (Fig. 5b), the Raman signal at 0 V resembles the open-circuit steady-state Raman one, and, with increasing drain voltages, there are no differences in the peak positions or relative intensities, clarified by the 2D Raman plots of absolute Raman intensity with Raman shift (abscissa) and applied voltage (ordinate) (Fig. 5c). Interestingly, Fig. 5e shows that the blend demonstrates drastically different behaviour, with a significant spectral transition at −1.3 V (the same voltage for current injection turn-on, discussed previously in Fig. 5a). Such a spectral transition is seen more clearly in the corresponding 2D Raman plots of the blend (see Fig. 5f). These dramatic changes in the Raman signal were also shown to be reversible upon the removal of the applied voltage (Fig. S9 in the ESI†) and highly reproducible (Fig. S10 in the ESI†).
C symmetric stretching mode (1450 cm−1) and the C–C intraring mode (1378 cm−1).40 For the neat P3HT film (58k 96% RR) (Fig. 5b), the Raman signal at 0 V resembles the open-circuit steady-state Raman one, and, with increasing drain voltages, there are no differences in the peak positions or relative intensities, clarified by the 2D Raman plots of absolute Raman intensity with Raman shift (abscissa) and applied voltage (ordinate) (Fig. 5c). Interestingly, Fig. 5e shows that the blend demonstrates drastically different behaviour, with a significant spectral transition at −1.3 V (the same voltage for current injection turn-on, discussed previously in Fig. 5a). Such a spectral transition is seen more clearly in the corresponding 2D Raman plots of the blend (see Fig. 5f). These dramatic changes in the Raman signal were also shown to be reversible upon the removal of the applied voltage (Fig. S9 in the ESI†) and highly reproducible (Fig. S10 in the ESI†).
The mechanics of the Raman spectral changes for neat and blend devices is shown by the evolution of the peak positions and intensities under applied voltages (Fig. 5b and e; see Fig. S11 in the ESI† for more details). For the neat P3HT film, the initial absolute Raman peak intensity decreases (uniform for both C–C and CC peaks), followed by steady increases with applied voltages (note however that the changes are minimal and within 50% of the initial value at 0 V). This is completely different for the blends, where a significant increase, particularly for the C–C peak, is observed beyond −1.2 V (a clear indication of field-induced interactions originating from the presence of the surrounding SSIL). Likewise, a frequency downshift by ≈40 cm−1 (from 1450 to 1410 cm−1) for the CC peak is observed only in the blends beyond −1.2 V, indicating molecular lattice reorganisation (here, corresponding to an enthalpic loss of ≈5.1 meV). We notice that the Raman spectral signature beyond −1.2 V closely resembles hole-polaronic Raman spectra (i.e. the P3HT polymer with sufficient hole-polarons >1020 cm−3), also reported previously by Nightingale et al.23 in an electrochemical cell. Refer to Fig. S12 in the ESI† for the reference neutral and hole-polaronic Raman spectra acquired in situ for an electrochemical cell. Thus, the Raman spectrum transitions from a neutral P3HT signature (e.g. at 0 V) to a hole-polaronic P3HT signature (e.g. at −1.7 V), where the transition turn-on occurs at −1.3 V, originate from the intermolecular electric field-induced doping of P3HT by the SSIL (termed as electrochemical doping). Understandably, the molecular lattice relaxation occurs due to an increase in hole polarons in the polymer leading to frequency downshift particularly of CC, i.e., an increase in the bond length and acquiring a more C–C like character (the lowering of the π electron density and force constant as the CC bond changes to be more single bond-like).41 Likewise, the peak intensity of the intraring C–C bond (1378 cm−1) increases as the π electron density increases.41 It has been suggested that there is a decrease in the Raman signal after the peak polaronic performance (at −1.5 V, see Fig. 5e) associated with the formation of doubly charged states, known as bipolarons, which are not resonant at 785 nm.42
The experimentally obtained field-dependent Raman spectra in Fig. 5b and e can be fitted by a linear combination of the reference neutral and polaronic P3HT Raman peaks (see Fig. S13 in the ESI†) to obtain the polaronic signature fraction given by IP/(IP + In), where IP and In are the integrated intensity of the polaronic spectral fit and neutral spectral fit, respectively. The resulting polaronic signature fraction represents the closeness of the polaronic or neutral spectral shape, where 1 corresponds to a 100% polaron P3HT shape while 0 corresponds to a 100% neutral P3HT shape. The polaronic signature fraction against applied voltages for neat and blended films shown in Fig. 5d clearly shows the formation of hole polarons in the polymer for blends. The trend closely correlates with the device currents (previously discussed in Fig. 5a). As the current density J = neμE, where elementary charge (e) and electric field (E) remain constant, it can be inferred that the transition point at −1.3 V is influenced by either the charge carrier density (n) or the charge mobility (μ). As an increase in the Raman intensity of the polaronic peaks is linked with an increase in the number of charges present,23 it can be concluded that the current injection turn-on is more likely to be contributed by an increased number density of holes travelling through the film. The blend shows two regimes in the charge transport characteristics. As a low voltage is applied, the current flows through the film, which is in line with the increase in the electric field. There is a steady increase in the current measured and an increase in the polaron resonant intensity but no structural change. In the second phase, once the number of charge carriers in the film has increased beyond the threshold charge density, the polymer starts to undergo structural changes, indicative of a high polaron density.
VOC induced molecular interactions
We now investigate the VOC induced effect on the molecular properties of the P3HT:SSIL blend devices, focussing on the exposure to acetone and toluene (see Fig. 6). The blend device's VOC selectivity towards the discrimination of acetone and toluene in in situ Raman measurement was same as that observed at lower VOC concentration (discussed previously in Fig. 4). The P3HT:SSIL blend shows a strong positive change in resistance under acetone exposure and a negative change under toluene exposure. The relative response time of acetone and toluene is more prominent than that at a lower concentration, where much faster negative response and recovery are seen when toluene is introduced into the sample chamber.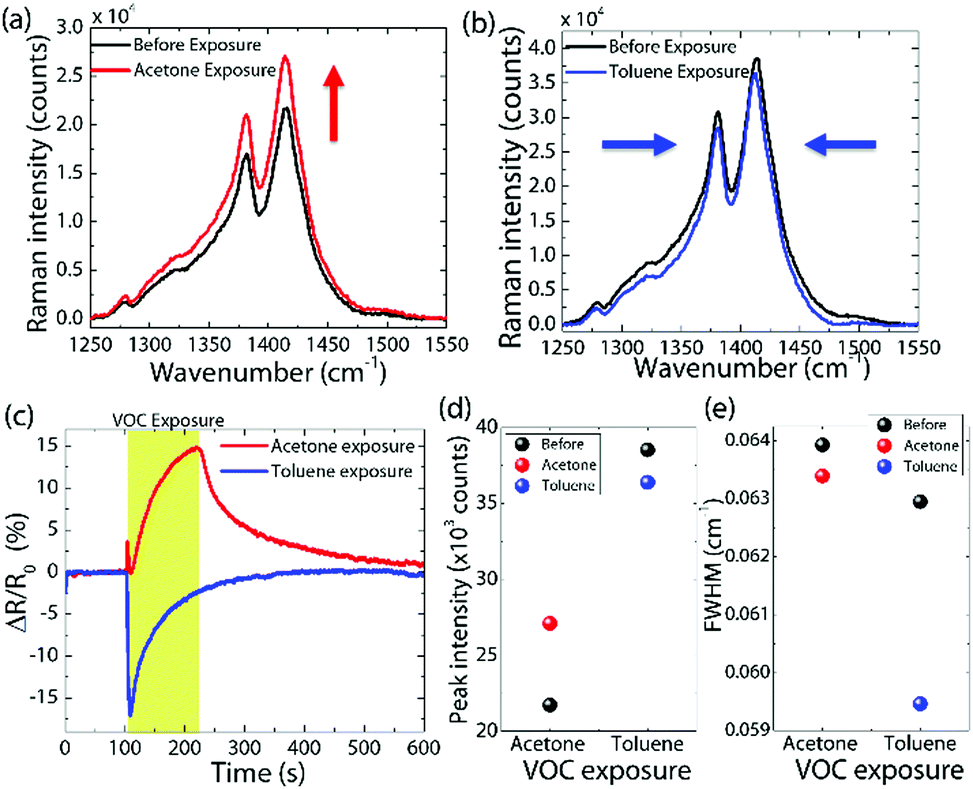 | ||
| Fig. 6
In situ Raman spectroscopy under VOC gas exposure for the 1:1 P3HT:SSIL blend in the presence of (a) acetone and (b) toluene. (c) Percentage change in electronic resistance under acetone and toluene exposure upon the injection of a high concentration of the VOC under an applied voltage of 4 V. (d) Peak intensity (the CC mode) and (e) FWHM of P3HT:SSIL before and after VOC exposure. | ||
The blend device shows the P3HT polaronic features under bias (4 V) before VOC exposure due to the interaction between the polymer and ionic liquid (discussed above). When the film is exposed to acetone, there is an increase in the overall intensity of Raman peaks (Fig. 6a) with no change in the peak position or relative intensity. In contrast, when exposed to toluene, the Raman signal shows a decrease in intensity and a narrowing of the FWHM (Fig. 6b). The narrowing of the peak suggests an increase in the P3HT molecular order25 which in turn results in a closer packing and faster charge transfer in the device.43 On the other hand, the Raman signal increase is associated with an increase in the polaron density present in P3HT. However, this increase does not improve the measured conductivity of the device upon exposure to acetone, suggesting potential trapping of polarons in P3HT by acetone.44
Based on the optical, morphological and electrical results obtained for the P3HT:SSIL blend, we hypothesise the transduction sensing mechanisms under different VOCs (Fig. 7). In the case of a high molecular weight neat P3HT film, the polymer chains are highly ordered in an interlinked lamellar packing. The conduction of charges through the film occurs by a mixture of intrachain along polymer chains including along the molecules between different lamella and by interchain hopping mechanisms.
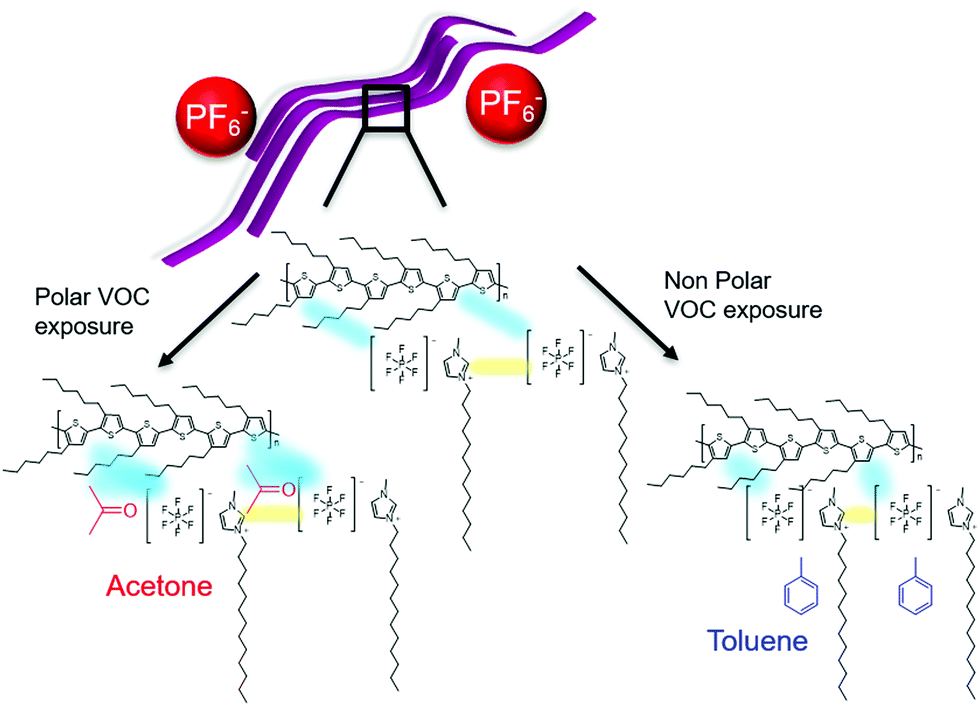 | ||
| Fig. 7 Schematic diagram showing the hypothesised sensing mechanism of P3HT:SSIL under exposure to polar and nonpolar solvents. An electrochemical interaction (blue) occurs between the SSIL and the P3HT backbone as long-lived polaronic states. The strength of this interaction is modulated by the presence of the VOC. Acetone chemically adsorbs onto the film, trapping the polaronic states and preventing effective transport to the electrodes, while the physical adsorption of toluene shortens the distance between P3HT and SSIL, strengthening the interaction. | ||
When P3HT is blended with the SSIL the morphology changes to create an interpenetrating network of P3HT pathways through the film. The electrochemical interaction of P3HT with the SSIL forms long-lived polaronic P3HT states under applied voltages. When the device is exposed to the gas analyte, VOCs can be adsorbed into the film physically or chemically. Upon exposure to toluene, P3HT shows an enhanced molecular order and reduced device resistance, suggesting a strengthening of the interaction between P3HT and the SSIL. As toluene is a large non-polar gas molecule with an aromatic ring, it is likely that it is adsorbed onto the porous film (i.e. physical adsorption), enabling proximity between polymer chains and the solid-state ionic liquids, increasing the P3HT molecular order and strengthening the electrochemical interactions between them.
In contrast, acetone is a smaller but highly polar gas molecule. When the blend is exposed to acetone there is an increase in device resistance and the response time is significantly slower. In this case, the negatively charged oxygen of the polar molecule can interact with the positively charged hole polarons in P3HT (i.e. chemical adsorption). Such an interaction can lead to the hole polaron in P3HT to be less mobile (e.g. trapped by the gas molecule), preventing effective transport to the electrode.45 This mechanism accounts for the increase in polaron density probed by Raman but the lower conductivity measured in the device upon acetone exposure.
Conclusions
In conclusion, we have demonstrated a highly sensitive and selective VOC gas sensor using π-conjugated polymer (P3HT)/SSIL blends. The polymer chain packing and resulting morphology in the blends are shown to be important to determine the degree of electrochemical interactions between P3HT and the SSIL. P3HT with high molecular weight and regioregularity forms an extremely well-interconnected network in blends desirable for efficient charge transport. In P3HT/SSIL blends, we have identified the electric-field driven strong chemical interactions between P3HT and the SSIL to tune the electrical conductivity of P3HT. The enlarged interfacial areas in blends and the solid-state nature of the SSIL ensure highly tuneable electrochemical interactions between them, efficiently modulating the electrical conductivity of P3HT further upon exposure to different polar and non-polar VOCs. Our results demonstrate the π-conjugated polymer/SSIL complex as a new highly sensitive and selective gas sensor platform and provide a key scientific understanding of its operational mechanisms at the molecular level, critical for developing molecular sensors towards next-generation non-invasive diagnostics.Experimental
Materials
P3HT was purchased from 1 M having a range of molecular weights and regioregularities. To study the Mw dependence, a range of 10–160 kg mol−1 was used with a regioregularity of around 95% and, to study the regioregularity dependence, the Mw was fixed at around 60 kg mol−1 and regularities between 50 and 99% were used. Solid state ionic liquid 1-dodecane-3-methylimidazolium hexafluorophosphate ([C1C12IM+] [PF6−]) was synthesised through a conventional method described elsewhere.Film preparation
P3HT and SSIL blends were dissolved in chloroform at 5 mg ml−1 and stirred at 40 °C. The solutions were filtered through a 0.45 μm filter and left for 48 hours before being spin-coated onto cleaned substrates at 2000 rpm/60 s. Films of 40 nm and 100 nm thickness were deposited for the neat and blended films, respectively. Chemiresistor devices were fabricated using Fraunhofer silicon wafers with a silicon dioxide layer and the source and drain electrodes (W = 2 mm, L = 5 μm) were formed of a 10 nm ITO adhesion layer and topped with 30 nm gold. The deposited films were dried in a desiccator overnight and stored in N2. Thin films on quartz for optical measurements were prepared in the same way.Absorbance
The absorption of thin films on quartz was measured using a Shimadzu UV-2600 UV/visible spectrophotometer with integrating sphere attachment. Air was used as a baseline reference and the thin film samples were corrected to the transmission of a clean blank quartz substrate.Electrical characterisation
Chemiresistor performance was measured using the driven voltage dependence (DVD) measurement on a probe station in a nitrogen glovebox. A drain voltage was applied between the source and drain electrodes for 10 s and the drain current was measured. The mean current for each applied voltage was extracted to evaluate the device performance.Transmission electron microscopy (TEM)
High angle annular dark-field scanning transmission electron microscope (HAADF-STEM) images of the sample films were collected using a Tecnai G2 F30 S-Twin microscope operated at an acceleration voltage of 300 kV. The sample films for the STEM measurements were obtained by peeling the predeposited film (t ≈ 70 nm) from a glass substrate, and the films were transferred onto carbon-coated 200-mesh copper grids (Electron Microscopy Sciences).Gas sensing
The VOC sensing measurement system consisted of four parts: (1) source: VOC gas tanks and regulators; (2) injection: mass-flow controller (MFC); (3) gas chamber: probes and a Peltier stage; and (4) analyser: Keithley 2400S and a homemade I–V LabVIEW system. High-purity air (nitrogen:oxygen = 7.9:2.1, 99.999% dry) was used to control the environment to be stable. The air and VOC were passed through the two MFCs; in one MFC, the air served as a reference gas for balancing the gas concentration, and in the other MFC the VOC served as the target analyte gas into the gas chamber (Nextron Co., Republic of Korea). The closed chamber was initially set at a RH less than 9% and a stage temperature of 20 °C, which were maintained during gas injection by using a constant moisture and heat controller connected to the main computer. The sensing signal was recorded using a Keithley 2400S system linked to a sensor device by electrical feedthrough. Initially, air (79% nitrogen and 21% oxygen) was supplied to the gas chamber at 1000 sccm. When the P3HT:SSIL blend chemiresistors reached a stable baseline current, the VOC analyte gases were injected at various concentrations. The total flow rate was fixed at 1000 sccm by adjusting the flow from the two MFCs to avoid temperature fluctuations near the surface of the organic chemiresistors.
Raman spectroscopy
A Renishaw inVia Raman microscope with an InGaAs detector was used to collect Raman spectra and with a 50× objective in a backscattering configuration. Spectra were collected using a 488 and 785 nm argon-ion laser at 130 and 9.0 mW power, respectively, and the laser probe was defocused to ∼10 μm. Calibration of the filter and grating was performed using the well-defined 520 cm−1 peaks of a Si reference. For in situ field dependent Raman spectroscopy (FDRS), the same Raman protocols were used. The sample was contained in a Linkam HFS600E-PB4 sample chamber and a drain voltage applied across the source and drain electrodes (see Fig. S14 in the ESI†). A constant VD was applied and held for 2 minutes before Raman measurements were taken, and 20 positions down the 5 μm channel were probed at each applied voltage.Conflicts of interest
The authors declare no competing financial interest.Acknowledgements
The authors acknowledge the UK EPSRC for studentships under DTG and the Processable Electronics Centre for Doctoral Training (EP/L016702/1). This research was also supported by the Global Research Laboratory Program of the National Research Foundation (NRF) funded by the Ministry of Science, ICT & Future Planning (NRF-2017K1A1A2013153), the Young Researchers Program of the NRF funded by the Ministry of Science, ICT & Future Planning (NRF-2018R1C1B6006177) and The Val O’Donoghue PhD Scholarship at Imperial College London. Thanks are due to Giandrin Barandun and Firat Güder for guidance on gas sensing.References
- D. Braga and G. Horowitz, Adv. Mater., 2009, 21, 1473–1486 CrossRef CAS.
- S. Few, C. Chia, D. Teo, J. Kirkpatrick and J. Nelson, Phys. Chem. Chem. Phys., 2017, 19, 18709–18720 RSC.
- L. Torsi, M. Magliulo, K. Manoli and G. Palazzo, Chem. Soc. Rev., 2013, 42, 8612–8628 RSC.
- C. Zhang, P. Chen and W. Hu, Chem. Soc. Rev., 2015, 44, 2087–2107 RSC.
- J. Dai, O. Ogbeide, N. Macadam, Q. Sun, W. Yu, Y. Li, B. L. Su, T. Hasan, X. Huang and W. Huang, Chem. Soc. Rev., 2020, 49, 1756–1789 RSC.
- A. H. Jalal, F. Alam, S. Roychoudhury, Y. Umasankar, N. Pala and S. Bhansali, ACS Sens., 2018, 3, 1246–1263 CrossRef CAS PubMed.
- M. Chen, Z. Li, W. Li, C. Shan, W. Li, K. Li, G. Gu, Y. Feng, G. Zhong, L. Wei and C. Yang, Nanotechnology, 2018, 29, 455501 CrossRef PubMed.
- W. Hu, L. Wan, Y. Jian, C. Ren, K. Jin, X. Su, X. Bai, H. Haick, M. Yao and W. Wu, Adv. Mater. Technol., 2019, 4, 1–38 Search PubMed.
- H. Yan, S. Limbu, X. Wang, J. Nightingale, I. Hamilton, J. Wade, S. Kwon, K. Lee and J. S. Kim, Adv. Funct. Mater., 2019, 29, 1–9 Search PubMed.
- M. Zagórska, E. Taler, I. Kulszewicz-Bajer, A. Proń and J. Nizioł, J. Appl. Polym. Sci., 1999, 73, 1423–1426 CrossRef.
- W. Yu, L. Zhou, S. Yu, P. Fu, X. Guo and C. Li, Org. Electron., 2017, 42, 387–392 CrossRef CAS.
- S. Che, R. Dao, W. Zhang, X. Lv, H. Li and C. Wang, Chem. Commun., 2017, 53, 3862–3865 RSC.
- T. Welton, Chem. Rev., 1999, 99, 2071–2083 CrossRef CAS PubMed.
- M. Suh, J. Bailey, S. W. Kim, K. Kim, D. J. Yun, Y. Jung, I. Hamilton, N. Chander, X. Wang, D. D. C. Bradley, D. Y. Jeon and J. S. Kim, ACS Appl. Mater. Interfaces, 2015, 7, 26566–26571 CrossRef CAS PubMed.
- N. Persson, M. McBride, M. Grover and E. Reichmanis, Curr. Opin. Solid State Mater. Sci., 2016, 20, 338–343 CrossRef CAS.
- M. Trznadel, A. Pron, M. Zagorska, R. Chrzaszcz and J. Pielichowski, Macromolecules, 1998, 31, 5051–5058 CrossRef CAS PubMed.
- R. Mauer, M. Kastler and F. Laquai, Adv. Funct. Mater., 2010, 20, 2085–2092 CrossRef CAS.
- A. Zen, J. Pflaum, S. Hirschmann, W. Zhuang, F. Jaiser, U. Asawapirom, J. P. Rabe, U. Scherf and D. Neher, Adv. Funct. Mater., 2004, 14, 757–764 CrossRef CAS.
- R. J. Kline, M. D. McGehee, E. N. Kadnikova, J. Liu, J. M. J. Fréchet and M. F. Toney, Macromolecules, 2005, 38, 3312–3319 CrossRef CAS.
- J. Clark, J. F. Chang, F. C. Spano, R. H. Friend and C. Silva, Appl. Phys. Lett., 2009, 94, 3–6 Search PubMed.
- F. C. Spano and C. Silva, Annu. Rev. Phys. Chem., 2014, 65, 477–500 CrossRef CAS PubMed.
- E. Tan, A. M. Pappa, C. Pitsalidis, J. Nightingale, S. Wood, F. A. Castro, R. M. Owens and J. S. Kim, Biotechnol. Bioeng., 2020, 117, 291–299 CrossRef CAS PubMed.
- J. Nightingale, J. Wade, D. Moia, J. Nelson and J. S. Kim, J. Phys. Chem. C, 2018, 122, 29129–29140 CrossRef CAS.
- K. H. Yim, G. L. Whiting, C. E. Murphy, J. J. M. Halls, J. H. Burroughes, R. H. Friend and J. S. Kim, Adv. Mater., 2008, 20, 3319–3324 CrossRef CAS.
- W. C. Tsoi, D. T. James, J. S. J. S. Kim, P. G. Nicholson, C. E. Murphy, D. D. C. Bradley, J. Nelson and J. S. J. S. Kim, J. Am. Chem. Soc., 2011, 133, 9834–9843 CrossRef CAS PubMed.
- J. Razzell-Hollis, S. Limbu and J. S. Kim, J. Phys. Chem. C, 2016, 120, 10806–10814 CrossRef CAS.
- A. N. Mallya, R. Kottokkaran and P. C. Ramamurthy, Sens. Actuators, B, 2014, 201, 308–320 CrossRef CAS.
- A. Lv, Y. Pan and L. Chi, Sensors, 2017, 17, 213 CrossRef PubMed.
- D. T. Simon, E. O. Gabrielsson, K. Tybrandt and M. Berggren, Chem. Rev., 2016, 116, 13009–13041 CrossRef CAS PubMed.
- C. Bartic and G. Borghs, Anal. Bioanal. Chem., 2006, 384, 354–365 CrossRef CAS PubMed.
- F. P. V. Koch, J. Rivnay, S. Foster, C. Müller, J. M. Downing, E. Buchaca-Domingo, P. Westacott, L. Yu, M. Yuan, M. Baklar, Z. Fei, C. Luscombe, M. A. McLachlan, M. Heeney, G. Rumbles, C. Silva, A. Salleo, J. Nelson, P. Smith and N. Stingelin, Prog. Polym. Sci., 2013, 38, 1978–1989 CrossRef CAS.
- L. Pauling, A. B. Robinson, R. Teranishi and P. Cary, Proc. Natl. Acad. Sci. U. S. A., 1971, 68, 2374–2376 CrossRef CAS PubMed.
- M. Phillips, Sci. Am., 1992, 267, 74–79 CrossRef CAS PubMed.
- K. Staszek, A. Rydosz, E. Maciak, K. Wincza and S. Gruszczynski, Sens. Actuators, B, 2017, 245, 882–894 CrossRef CAS.
- G. Peng, U. Tisch, O. Adams, M. Hakim, N. Shehada, Y. Y. Broza, S. Billan, R. Abdah-Bortnyak, A. Kuten and H. Haick, Nat. Nanotechnol., 2009, 4, 669–673 CrossRef CAS PubMed.
- J. Luke, E. M. Speller, A. Wadsworth, M. F. Wyatt, S. Dimitrov, H. K. H. Lee, Z. Li, W. C. Tsoi, I. McCulloch, D. Bagnis, J. R. Durrant and J. S. Kim, Adv. Energy Mater., 2019, 9, 1–14 Search PubMed.
- S. Limbu, S. Pont, A. B. Doust, S. Kwon, P. Fuller, E. Tan, J. R. Durrant and J. S. Kim, Adv. Mater. Interfaces, 2019, 6, 1–10 CAS.
- W. C. Tsoi, D. T. James, J. S. Kim, P. G. Nicholson, C. E. Murphy, D. D. C. Bradley, J. Nelson and J. S. Kim, J. Am. Chem. Soc., 2011, 133, 9834–9843 CrossRef CAS PubMed.
- S. Wood, J. R. Hollis and J. S. Kim, J. Phys. D: Appl. Phys., 2017, 50, 073001 CrossRef.
- J. Yin, Z. Wang, D. Fazzi, Z. Shen and C. Soci, J. Phys. Chem. C, 2016, 120, 1994–2001 CrossRef CAS.
- V. Hernandez, C. Castiglioni, M. Del Zoppo and G. Zerbi, Phys. Rev. B: Condens. Matter Mater. Phys., 1994, 50, 9815–9823 CrossRef CAS PubMed.
- C. Enengl, S. Enengl, S. Pluczyk, M. Havlicek, M. Lapkowski, H. Neugebauer and E. Ehrenfreund, ChemPhysChem, 2016, 17, 3836–3844 CrossRef CAS PubMed.
- W. C. Tsoi, D. T. James, E. B. Domingo, J. S. Kim, M. Al-Hashimi, C. E. Murphy, N. Stingelin, M. Heeney and J. S. Kim, ACS Nano, 2012, 6, 9646–9656 CrossRef CAS PubMed.
- G. S. Ryu, B. Nketia-Yawson, E. Y. Choi and Y. Y. Noh, Org. Electron., 2017, 51, 264–268 CrossRef CAS.
- R. Di Pietro and H. Sirringhaus, Adv. Mater., 2012, 3367–3372 CrossRef CAS PubMed.
Footnote |
| † Electronic supplementary information (ESI) available: See DOI: 10.1039/d0tc03093g |
| This journal is © The Royal Society of Chemistry 2020 |