 Open Access Article
Experimental corroboration of the thermoelectric performance of Bi2PdO4 oxide and Pb-doped derivatives†
Paula
Kayser
 *ab,
Federico
Serrano-Sanchez
 a,
Oscar Juan
Dura
 c,
François
Fauth
 d and
José Antonio
Alonso
 *a
*a
aInstituto de Ciencia de Materiales de Madrid, C.S.I.C., Cantoblanco E-28049, Madrid, Spain. E-mail: paula.kayser@ed.ac.uk; ja.alonso@icmm.csic.es
bCentre for Science at Extreme Conditions and School of Chemistry, The University of Edinburgh, Edinburgh EH9 3JZ, UK
cDepartamento de Física Aplicada and INEI, Universidad de Castilla-la Mancha, 13071 Ciudad Real, Spain
dCELLS-ALBA Synchrotron, E-08290 Cerdanyola del Valles, Barcelona, Spain
First published on 14th March 2020
Abstract
A theoretical study has recently revealed Bi2PdO4 to be a promising p-type oxide thermoelectric material, with excellent electrical properties and low thermal conductivity, due to its structural peculiarities. Polycrystalline samples of the pristine material and Pb-doped Bi1.9Pb0.1PdO4 have been prepared by a conventional solid-state reaction, and an exhaustive structural characterization has been performed by high-energy synchrotron X-ray diffraction. Thermoelectric transport properties have been measured in the 300–800 K temperature range. The undoped compound displays p-type semiconductor behaviour and extremely high values of thermopower, up to 1458 μV K−1 at 340 K, along with low lattice thermal conductivity, related to large vibrations of Bi and O atoms. In the Pb-doped derivative the electrical resistivity is greatly enhanced, which along with a reduction of the lattice thermal conductivity results in an improved thermoelectric performance by more than one order of magnitude. These features underline the promising further optimization of this material aiming at thermoelectric applications.
Introduction
Thermoelectric materials have attracted vast attention for many decades due to their capacity to interconvert heat and electricity.1,2 These materials provide a unique opportunity to recover waste heat energy and transform it directly into electricity, or to produce a temperature gradient when electricity is supplied. Therefore, they are ideal candidates for applications such as power generators, thermal energy sensors, coolers, etc.3 The performance of thermoelectric devices is measured by using the figure of merit ZT, which determines the theoretical fraction of the Carnot efficiency that can be reached by a thermoelectric material. It is defined as ZT = (S2σT)/(κL + κe), where S is the Seebeck coefficient, σ is the electrical conductivity, κL is the lattice thermal conductivity, κe is the electronic thermal conductivity and T is the absolute temperature. We thus look for materials with large power factors (S2σ), and low thermal conductivity. This is a challenge since the Seebeck coefficient and the electric conductivity change in opposite directions, following the Pisarenko relation.4 In addition to these parameters associated with the efficiency, thermoelectric materials require: (i) to exhibit good chemical and mechanical stability, non-toxicity, (ii) to show resistance to redox reactions and (iii) to operate in a wide range of temperatures in air, to be competitive as commercial materials.Since transition metal oxides fulfil these requirements, they offer a rich playground for developing promising thermoelectric materials and hence, in the last years the interest in this family of compounds has rapidly increased. The finding of great thermo-power value (characterised by the Seebeck coefficient) in the layered NaxCoO2 oxides5,6 encouraged the scientific community to explore new transition metal oxides as potential thermoelectric materials, such as SrTiO3,7 a well-known n-type oxide with large power factor and other layered cobaltite compounds as La0.8Sr0.2CoO3, Ca3Co4O98 and Bi2Sr2Co2Oy, which display promising thermoelectric properties.9,10 As enumerated herein, there are many advantages in using transition-metal oxides compared to other thermoelectric materials; for instance, the electronic properties can be easily tailored, they exhibit a broad range of electric properties as well as thermal behaviours, and the physics of the phonons in these compounds have been deeply studied and comprehended.11 However, transition-metal oxides also present some drawbacks such as poor electrical conductivity with low charge-carrier mobility and high thermal conductivity. These values are contrary to the desired ones and yield low values of ZT. The most common chemical strategies to invert these values are chemically doping or modifying the stoichiometry, in order to create certain degree of crystal disorder, and introducing extra sites, which may contribute to hamper the phonon transport.12,13 Recently, it has been demonstrated that s2 lone electron pairs of the p-block elements provoke anharmonic bonds in high-symmetry crystalline solids.14,15 Last year, Jiangang He et al.16 suggested an alternative approach to develop new thermoelectric materials with a “lone pair cation” and a d8 cation in square-planar coordination, demonstrated via ab initio calculations for Bi2PdO4 oxide. On the one side, the use of oxides with a highly distorted oxygen environment originated from the lone pairs of Bi3+ cations is proposed to reduce the lattice thermal conductivity. On the other side, in order to increase the power factor, the localised Pd2+ dz2 orbitals in a square planar arrangement contribute to stabilise a flat and disperse valence band structure. Therefore, Bi2PdO4 was proposed to be an ideal candidate for thermoelectric applications.
In the present contribution, we have realized this theoretical approach by synthesizing and characterizing the thermoelectric properties of Bi2PdO4, thus confirming that it fulfils the expectations. We present an exhaustive crystallographic analysis by means of high-energy X-ray synchrotron diffraction at different temperatures and the subsequent correlation with the thermoelectric properties. In fact, it presents Seebeck coefficients as high as 1218 μV K−1 at 750 K and a reduced (compared to other oxides) thermal conductivity of 1.5 W m−1 K−1 at this temperature. The interpretation of the experimental data, supported by the theoretical calculation previously reported, has been essential to deeply understand the advantages and drawbacks of this oxide. This study represents the starting point to design new materials with enhanced properties, such as Bi2−xPbxPdO4 where the charge-carriers density could be optimized.17,18 Herein, the composition Bi1.8Pb0.1PdO4 has also been investigated.
Experimental
Bi2PdO4 and Bi1.90Pb0.1PdO4 samples were prepared using conventional solid-state reaction. Stoichiometric amounts of Bi2O3, PdO and PbO were ground as acetone slurry and heated at 730 °C during 12 h (2 min per degree rate). Then the samples were pressed into 12 mm pellets and sintered under the same experimental conditions (730 °C during 12 h).19The specimens, obtained as a brown well-crystallised powders, were initially characterised by laboratory X-ray diffraction, using a Bruker-AXS D8 diffractometer (40 kV, 30 mA), controlled by DRIFFACTPLUS software, in Bragg–Brentano reflection geometry with Cu Kα radiation (λ = 1.5418 Å) and a lynxeye detector. Further crystallographic analyses were carried out at the BL04-MSPD beamline of ALBA synchrotron in order to accurately identify and refine the crystal structure. Synchrotron X-ray diffraction (SXRD) patterns were collected in high angular resolution mode (so-called MAD set-up, Multicrystal Analyser Detectors), selecting an incident beam with 38 keV radiation (λ = 0.3511 Å).20 The samples were contained in 0.7 mm diameter quartz capillaries. Using high-energy synchrotron X-rays allowed collecting data on such absorbing material in transmission mode. SXRD data were recorded at 295 (RT), 573, 673 and 773 K to study potential phase transitions that may affect the thermoelectric properties. The Rietveld refinement21 of the crystal structure was performed using the FullProf suite.22 A pseudo-Voigt function was chosen to generate the line shape of the diffraction peaks. The scale factor, background coefficients, zero-point error, pseudo-Voigt corrected for asymmetry parameters, positional coordinates and isotropic thermal factors of the Bi (Pb), Pd and O atoms were refined in the final runs.
Results and discussion
As observed in Fig. 1, the SXRD patterns show sharp and well-defined reflections, indexed in the P4/ncc (# 130) tetragonal cell. In this model, Bi(Pb) atoms occupy the 8f (x, −x, ¼) Wyckoff positions, Pd atoms the 4c (¼, ¼, z) sites and the oxygen anions are placed at the 16g (x, y, z) sites. The Rietveld analysis resulted in a satisfactory agreement between the observed and calculated profiles. The occupancy factor for oxygen atoms confirmed a full stoichiometry. No impurities were detected in any case. For the Pb-doped sample, some reflection profiles are asymmetric and show a Lorentzian tail on the left side at low angles and on the right side at high angles (Fig. 1b); therefore, an instrumental parameters issue has been discarded. For this sample, the asymmetric broadening on all the patterns has been modelled using a distribution of the unit-cell parameters within the same space group. The introduction of a second phase with the following cell parameters a1 = a2 and c1 ≠ c2, has led to a successful structural refinement as observed in the inset of Fig. 1b. The asymmetry origin of the peaks could be ascribed to local inhomogeneous distribution of Pb, leading to Pb-rich areas. Unfortunately, it is not possible to refine the Bi and Pb occupancy by means of X-rays due to their similar scattering strength. A summary of selected internal parameters is displayed in Tables 1 and 2. Some of the refined parameters for the doped sample is included in the ESI† (Table S1).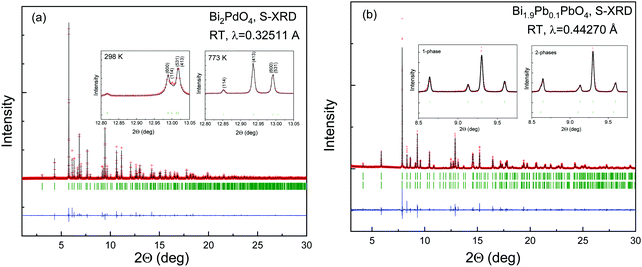 | ||
| Fig. 1 Observed (crosses), calculated (solid line) and difference (bottom) S-XRD Rietveld profiles for (a) Bi2PdO4 and (b) Bi1.90Pb0.1PdO4 at 298 K collected at MSPD diffractometer (ALBA). The vertical green markers represent the positions of the space-group-allowed Bragg reflections. The remaining patterns at 573, 673 and 773 K are included in the ESI† (Table S1). | ||
| 298 K | 573 K | 673 K | 773 K | |
|---|---|---|---|---|
| a (Å) | 8.62292(4) | 8.62232(3) | 8.62196(3) | 8.62142(2) |
| c (Å) | 5.91023(3) | 5.95078(2) | 5.96635(2) | 5.98181(2) |
| V (Å3) | 439.453(4) | 442.107(3) | 443.528(2) | 444.621(2) |
| Bi 8f (x, −x, ¼) | ||||
| x | −0.07953(7) | −0.07917(6) | −0.07908(6) | −0.07880(6) |
| B iso (Å2) | 0.83(2) | 1.41(2) | 1.60(2) | 1.85(2) |
| Pd 4c (¼, ¼, z) | ||||
| z | 0.0816(4) | 0.0815(3) | 0.0816(3) | 0.0819(3) |
| B iso (Å2) | 0.19(4) | 0.54(4) | 0.69(4) | 0.82(4) |
| O 16g (x, y, z) | ||||
| x | 0.359(1) | 0.357 (1) | 0.3574(9) | 0.3578(9) |
| y | 0.046(1) | 0.044(1) | 0.0432(9) | 0.0421(9) |
| z | 0.584(2) | 0.587 (2) | 0.589 (1) | 0.588 (1) |
| B iso (Å2) | 0.9(2) | 1.7(2) | 1.7(2) | 2.1(2) |
| Reliability factors | ||||
| R Bragg (%) | 3.88 | 3.32 | 3.31 | 3.63 |
| R p (%) | 10.6 | 8.66 | 8.01 | 7.90 |
| R wp (%) | 14.6 | 11.8 | 10.7 | 10.8 |
| R exp (%) | 7.53 | 7.62 | 7.62 | 8.34 |
| χ 2 | 3.75 | 2.39 | 1.98 | 1.95 |
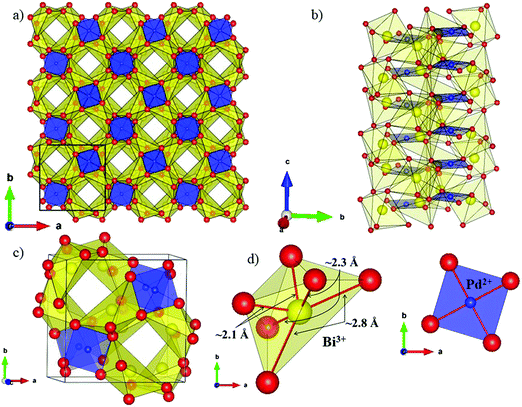
The local environment and the internal parameters at room temperature and at high temperatures have been analysed. As it was predicted, the lone electron pairs 6s2 of Bi3+ cause a large distortion in the [BiO6] octahedra giving rise to three different bond distances: 2.32(1), 2.82(1) and 2.15(1) Å. These values are very close to the corresponding Bi–O distances described for Bi2PdO4 in ref. 15 (2.387, 2.716, 2.143 Å) or for the analogous cuprate Bi2CuO4 (2.3336(7) 2.7590(6) and 2.1280(6) Å).23,24 The lack of a regular octahedral framework, which favours the anharmonicity, in combination with the lone pairs acting as a stereochemical barrier, both contribute to lower the lattice thermal conduction. The Pd2+ cation is equidistant to four oxygen anions in a square-planar coordination forming one-dimensional Pd2+ chains along c without any connecting oxygen between them. Since the Pd–Pd interatomic distance is 2.995(3) Å at RT, the formation of direct Pd–Pd bonds is not excluded, and this fact has relevant implications in the electronic structure, as previously reported. Some schematic views of the structure are represented in Fig. 2.
The thermal evolution of the SXRD diagrams show that the crystal structure of Bi2PdO4 remains tetragonal in the temperature range 298–773 K. The overall size of the unit-cell increases with temperature, as denoted by the volume expansion represented in Fig. 3. Since the a-axis exhibits a subtle negative thermal expansion (8.62292(4) Å at 298 K and 8.62142(2) Å at 773 K) evolving in the opposite direction to the volume, the enlargement effect is exclusively associated with the variation of the c-axis, which undergoes a change from 5.91023(3) Å at 298 K to 5.98181(2) Å at 773 K. This effect can be observed in the evolution of the different peaks (see inset of Fig. 1). While the reflections hkl are shifted towards lower 2θ as long as the temperature increases, the corresponding h00 slightly moves to higher angles. This unexpected tendency is also observed in the behaviour of one of the Bi–O distances, which decreases from 2.82(1) Å to 2.794(8) Å when temperature increases. Pd–O bond distances remain virtually constant, while Pd–Pd bond length expands linearly with temperature, as expected considering the way in which the unit-cell expands. The valences of the cations, calculated from structural data using the bond-valence Brown's model,25 confirm the presence of trivalent Bi3+ and divalent Pd2+. The square-planar coordination environment for Pd2+ ions leads into a specific splitting in the energy level of the 4d orbitals with the dz2 orbitals becoming the highest level of the valence band, which is crucial in order to accomplish a flat (in the ab plane) and disperse (along the c-axis) band. The formation of direct Pd–Pd bonds along the chains of PdO4 squares determines the electron delocalization along c, and affects the transport and thermoelectric properties, as discussed below.
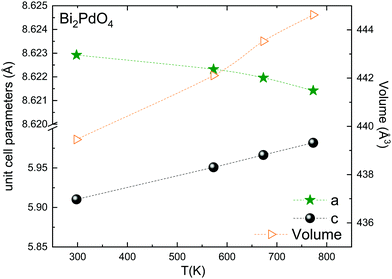 | ||
| Fig. 3 Thermal evolution of the unit-cell parameters and volume. The inset drawing represent the unit-cell. | ||
The introduction of 5% of Pb2+, with larger ionic size than Bi3+ (r(Bi3+) = 1.03 Å vs. r(Pb2+) = 1.19 Å), gives rise to an anisotropic variation of the unit-cell parameters. While the a-axis undergoes an elongation, the c-axis is shortened with respect to undoped compound. Unexpectedly, the overall effect produces a slight contraction of the lattice, as can be seen in the volume values, since the hole doping effect upon replacing trivalent Bi by divalent Pd predominates over the steric factor. The most relevant structural modification in the Pb-compound is the reduction of the Pd–Pd distance. This metal–metal bond length is directly related with the bandwidth and the band order; the shorter distance directly affects the electron delocalization and creates a better mobility path for charge carriers, increasing the electrical conductivity.
An interesting insight into the crystal structure results from the localization of the lone electron pairs belonging to Bi3+ ions. This can be unveiled from Difference Fourier synthesis from high-quality X-ray diffraction data, as those collected in the present work. The difference between observed and calculated structure factors contain invaluable information about missed electron density located in interatomic regions of the unit cell. Fig. 4 shows the positive electronic density maps corresponding to the lone electron pairs of Bi. The electron density lobes are found at distances from Bi approximately equivalent to those expected for typical Bi–O bond, in the 2.1–2.5 Å range, as described elsewhere.26 As mentioned in the introduction, it is believed that the lone electron pairs contribute to phonon scattering, which substantially decreases the thermal conductivity of Bi2PdO4 oxide, within the limits of the best thermoelectric oxides that find applications in the intermediate temperature range between 700–900 K.
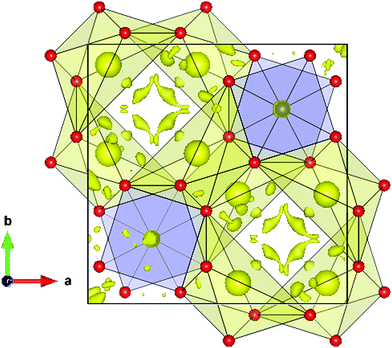 | ||
| Fig. 4 Difference Fourier synthesis from high-quality synchrotron X-ray diffraction data, highlighting the lobes of the Bi lone electron pairs, directed to an empty region of the unit cell. | ||
Transport properties
The electrical resistivity was obtained by combining a current source (Keithley 6220) with a nanovoltmeter (Keithley 2182A) in the Van der Pauw configuration. The Seebeck coefficient was measured in bar shaped samples by comparison with a reference constantan wire by using a commercial instrument from MMR technologies. These both magnitudes were determined from 300 K to 720 K. The electrical resistivity (Fig. 5 left) shows an exponential decay throughout the whole measurement range, in agreement with an intrinsic semiconductor behaviour. It falls from a maximum value over 103 Ω m at 300 K to a minimum value of 1.9 Ω m at 750 K. Two exponential regions can be distinguished, which can be attributed to different charge carriers activation processes. The first one arises from intrinsic defects that overcome the potential barriers of grain boundaries at lower temperatures, whereas the second one comes from thermal excitation across the band gap at higher temperature. It is possible to evaluate the high-temperature behaviour (>500 K) using an exponential fit, for which the activation energy of charge carriers is determined as 0.42 eV. This value lies well within the energy range calculated by DFT for PBE functionals (0.15 eV), and that determined for HSE06 functionals (1.41 eV). The resistivity values are still much higher than those found in the theoretical study performed by J. He et al.16 of the order of 10−5 Ω m. This difference is probably associated with a low carrier concentration and the scattering mechanisms of charge carriers in the sample. Furthermore, our study is focused on polycrystalline samples, while theoretical calculations discuss an ideal single crystal, and grain boundary and microstructural features have been demonstrated to strongly affect carriers scattering in other thermoelectric materials.27 Compared to other common high-performance thermoelectric oxides, these values of resistivity are still high; other oxides like Ca3Co4O928 prepared by conventional sintering, displays 3 × 10⁻⁴ Ω m in the whole temperature range of 300–973 K and polycrystalline NaCo2O420 samples have shown values of 4 × 10⁻⁴ Ω m at 730 K. A great improvement of the electrical resistivity is observed in the Pb doped derivative Bi1.9Pb0.1PdO4, which is reduced down to 10−3 Ω m at 700 K. This enormous reduction of three orders of magnitude could be attributed both, to the increased carrier concentration due to the hole-doping effect induced when Pb partially replaces Bi, and to the shorter metal–metal (Pd–Pd) distances, for which an increased overlap would yield broader bandwidth and an enhanced conductive path with increased carrier mobilities.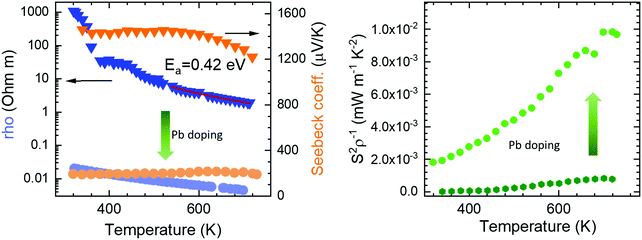 | ||
| Fig. 5 Temperature dependence of (left) Seebeck coefficient and resistivity, and (right) power factor of pristine Bi2PdO4 (dark colours) and Bi1.9Pb0.1PdO4 (light colours). | ||
The Seebeck coefficient variation is shown in Fig. 5(left). Measurements of Bi2PdO4 exhibit a p-type behaviour with extremely high values from 1458 μV K−1 at 340 K to 1218 μV K−1 at 720 K, in agreement with the localized dz2 flat valence band in the ab plane and large band degeneracy near the Fermi level.16 The evolution with temperature is almost invariable up to 550 K, point at which the Seebeck coefficient starts to diminish due to the thermal excitation of minority carriers. The predicted Seebeck coefficient16 follows a similar invariant trend and displays values close to 650 μV K−1 for a carrier concentration of 1018 cm−3, which along with the resistivity values, suggest that the carrier concentration in our undoped samples is much lower and that other factors, such as grain boundaries, are playing an important role in the transport properties. These great values of the Seebeck coefficient provide room for optimization of the carrier concentration and its fine-tuning in relation to the electrical resistivity, as other oxides displays much lower values in the range 60–100 μV K−1, as described for polycrystalline Bi2Sr2Co2Ox29 in the 300–1000 K temperature interval, or between 130 and 180 μV K−1 measured in Ca3Co4O928 at 300–973 K. Such is the case, that Pb doping reduces the Seebeck coefficient to the range of 200 μV K−1, still in the range of good oxide thermoelectric materials values, and predicted for carrier concentrations between 5 × 1019 cm−3 and 1020 cm−3.16
The power factor, S2σ of the undoped compound (Fig. 5 right), increases with temperature up to a maximum of 0.8 μW m−1 K−2, resulting from the electrical resistivity variation and an almost constant Seebeck coefficient. These values are below those found by the theoretical predictions,16 as a consequence of the higher electrical resistivity. As mentioned, the large Seebeck coefficient offers wide room for tuning through the optimization of the carrier concentration, as experimentally realized in Bi1.9Pb0.1PdO4. Its enhanced resistivity improves the power factor up to 10 μW m−1 K−2. This huge enhancement by only one first attempt supports the promising predictions by theoretical calculations, and suggest that a synergistic improvement of Seebeck coefficient and electrical conductivity could be achieved by further doping strategies or new sample elaboration that diminish the scattering of charge carriers.
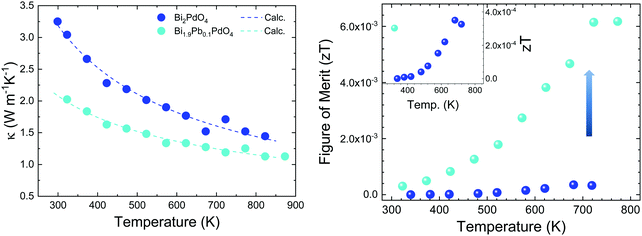
Thermal diffusivity (α) of the samples was measured in a Linseis LFA instrument in the temperature range of 300–800 K by the laser-flash method. The surfaces of the pellets were covered with a thin graphite coating to maximize full emissivity from the backside and absorption at the front surface. The total thermal conductivity is calculated by κ = αCpd, where Cp = 297 J kg−1 K−1 is the specific heat, determined by means of the Dulong–Petit approximation,30 and d is the sample density. The thermal conductivity of the pristine and doped samples (Fig. 6 left) reflect the lattice conductivity, as the electronic contribution can be neglected due to high resistivity. A monotonous decrease is observed throughout the temperature range. Bi2PdO4 displays a maximum value of 3.3 W m−1 K−1 at 300 K down to 1.45 W m−1 K−1 at 823 K, being significantly lower compared to those measured in other oxide thermoelectric materials, as Ca3Co4O9 and NaCo2O4, which show values around 2.0–4.0 W m−1 K−1![[thin space (1/6-em)]](https://www.rsc.org/images/entities/char_2009.gif) 8,31 in this temperature range, and in fact, close to those previously described by the theoretical work of J. He et al.16 The main source of this low lattice thermal conductivity is the structural distortion produced by the lone electron pair of Bi (Fig. 6), and the related strong anharmonicity and distortion of the octahedral framework. Large isotropic displacement parameters found in Bi and O positions, and therefore, strong vibrations, have an important impact on the low thermal conductivity, which is in agreement with the theoretical study.16 Moreover, the Pb-doped sample display even lower values as 1.1 W m−1 K−1 at 823 K, which could be ascribed to the disorder produced upon doping, as suggested in the SXRD section. Additionally, the lattice thermal conductivity of the Pb-doped and the undoped samples was analyzed in terms of the Callaway model32,33 by considering three scattering mechanisms. Therefore, the model includes boundary scattering, point defects scattering and the Umklapp phonon–phonon scattering. Whereas the grain boundary term and the Umklapp scattering term show a similar trend for both samples, the point defect scattering term is markedly larger for the Pb-doped sample as we expected. The results of the calculated lattice thermal conductivity are included in Fig. 6(left). Still, it would be possible to improve the thermoelectric efficiency of this material by further reduction of the lattice conductivity using other approaches as nanostructuration.
8,31 in this temperature range, and in fact, close to those previously described by the theoretical work of J. He et al.16 The main source of this low lattice thermal conductivity is the structural distortion produced by the lone electron pair of Bi (Fig. 6), and the related strong anharmonicity and distortion of the octahedral framework. Large isotropic displacement parameters found in Bi and O positions, and therefore, strong vibrations, have an important impact on the low thermal conductivity, which is in agreement with the theoretical study.16 Moreover, the Pb-doped sample display even lower values as 1.1 W m−1 K−1 at 823 K, which could be ascribed to the disorder produced upon doping, as suggested in the SXRD section. Additionally, the lattice thermal conductivity of the Pb-doped and the undoped samples was analyzed in terms of the Callaway model32,33 by considering three scattering mechanisms. Therefore, the model includes boundary scattering, point defects scattering and the Umklapp phonon–phonon scattering. Whereas the grain boundary term and the Umklapp scattering term show a similar trend for both samples, the point defect scattering term is markedly larger for the Pb-doped sample as we expected. The results of the calculated lattice thermal conductivity are included in Fig. 6(left). Still, it would be possible to improve the thermoelectric efficiency of this material by further reduction of the lattice conductivity using other approaches as nanostructuration.
The figure of merit is plotted against temperature in Fig. 6(right). These values follow the same trend as the power factor, increasing throughout the temperature range up to 4 × 10⁻⁴ at 680 K for the undoped Bi2PdO4 and to 6 × 10⁻³ at 720 K for Bi1.9Pb0.1PdO4. It is noteworthy the large thermopower of the pristine compound, consequence of a large band degeneracy and DOS, being a good starting point for the optimization of the thermoelectric performance. As a prove of concept, the figure of merit is largely enhanced by Pb doping due to the combination of electrical and thermal transport improvements, highlighting Bi2PdO4 and its derivatives as promising thermoelectric materials.
Conclusions
The predictions of good thermoelectric coefficients in Bi2PdO4 have been realized in a polycrystalline sample prepared by solid-state reactions, yielding maximum S = 1458 μV K−1 at 340 K. The poor electronic conductivity is overcome in a Pd-doped sample, achieving better conductivities by three orders of magnitude, and an improved power factor up to 10 μW m−1 K−2. An excellent correlation between crystal structure and properties has been established from high angular resolution SXRD data: the collapse of the unit cell along c-direction upon Pb doping, opposite to the expected from steric considerations, accounts for an increment of the charge carriers density, associated with the shorter Pd–Pd distances, presumably involving direct metal–metal bonds. The synchrotron diffraction data also permit the localization of the Bi electron lone pairs, at approximate distances of a Bi–O bond. The presence of lone electron pairs are responsible for the extremely distorted BiO6 coordination environment, and correlated to a low thermal conductivity, better than that usually displayed by thermoelectric oxides. This parameter is even reduced upon Pb-doping as a consequence of the introduced structural disorder, and ascribed to anharmonicity of the chemical bonds. Therefore, Bi2PdO4 and doped derivatives can be auspicious as thermoelectric materials, since the transport properties are still susceptible of significant improvements.Conflicts of interest
There are no conflicts to declare.References
- P. Vaqueiro and A. V. Powell, J. Mater. Chem., 2010, 20, 9577–9584 RSC.
- D. M. Rowe, Thermoelectrics and its Energy Harvesting, 2-Volume Set, CRC Press, Boca Raton, 2012 Search PubMed.
- S. B. Riffat and X. Ma, Appl. Therm. Eng., 2003, 23, 913–935 CrossRef.
- J. R. Sootsman, D. Y. Chung and M. G. Kanatzidis, Angew. Chem., Int. Ed., 2009, 48, 8616–8639 CrossRef CAS PubMed.
- I. Terasaki, Y. Sasago and K. Uchinokura, Phys. Rev. B: Condens. Matter Mater. Phys., 1997, 56, R12685–R12687 CrossRef CAS.
- I. Terasaki, Thermoelectric materials in layered transition-metal oxides, ICT 2005, 24th International Conference on Thermoelectrics, 2005, Clemson, SC, USA, 2005, pp. 301–306.
- A. Mehdizadeh Dehkordi, S. Bhattacharya, T. Darroudi, J. W. Graff, U. Schwingenschlögl, H. N. Alshareef and T. M. Tritt, Chem. Mater., 2014, 26, 2478–2485 CrossRef CAS.
- S. Butt, W. Xu, M. U. Farooq, G. K. Ren, F. Mohmed, Y. Lin and C.-W. Nan, J. Am. Ceram. Soc., 2015, 98, 1230–1235 CrossRef CAS.
- R. Funahashi and M. Shikano, Appl. Phys. Lett., 2002, 81, 1459–1461 CrossRef CAS.
- J. D. Baran, D. Kepaptsoglou, M. Molinari, N. Kulwongwit, F. Azough, R. Freer, Q. M. Ramasse and S. C. Parker, Chem. Mater., 2016, 28, 7470–7478 CrossRef CAS.
- S. Walia, S. Balendhran, H. Nili, S. Zhuiykov, G. Rosengarten, Q. H. Wang, M. Bhaskaran, S. Sriram, M. S. Strano and K. Kalantar-zadeh, Prog. Mater. Sci., 2013, 58, 1443–1489 CrossRef CAS.
- L.-D. Zhao, V. P. Dravid and M. G. Kanatzidis, Energy Environ. Sci., 2014, 7, 251–268 RSC.
- G. Tan, L.-D. Zhao and M. G. Kanatzidis, Chem. Rev., 2016, 116, 12123–12149 CrossRef CAS PubMed.
- M. D. Nielsen, V. Ozolins and J. P. Heremans, Energy Environ. Sci., 2013, 6, 570–578 RSC.
- E. J. Skoug and D. T. Morelli, Phys. Rev. Lett., 2011, 107, 235901 CrossRef PubMed.
- J. He, S. Hao, Y. Xia, S. S. Naghavi, V. Ozoliņš and C. Wolverton, Chem. Mater., 2017, 29, 2529–2534 CrossRef CAS.
- N. Bettahar, P. Conflant and F. Abraham, J. Alloys Compd., 1992, 188, 211–214 CrossRef CAS.
- N. Bettahar, P. Conflant, J. C. Boivin, F. Abraham and D. Thomas, J. Phys. Chem. Solids, 1985, 46, 297–299 CrossRef CAS.
- R. M.-B. Arpe and H. Müller-Buschbaum, Z. Naturforsch. B, 1976, 31, 1708–1709 Search PubMed.
- F. Fauth, R. Boer, F. Gil-Ortiz, C. Popescu, O. Vallcorba, I. Peral, D. Fullà, J. Benach and J. Juanhuix, Eur. Phys. J. Plus, 2015, 130, 160 CrossRef.
- J. Rodríguez-Carvajal, Phys. B, 1993, 192, 55–69 CrossRef.
- H. Rietveld, J. Appl. Crystallogr., 1969, 2, 65–71 CrossRef CAS.
- J. L. Garcia-Munoz, J. Rodriguez-Carvajal, F. Sapina, M. J. Sanchis, R. Ibanez and D. Beltran-Porter, J. Phys.: Condens. Matter, 1990, 2, 2205–2214 CrossRef CAS.
- E. W. Ong, G. H. Kwei, R. A. Robinson, B. L. Ramakrishna and R. B. Von Dreele, Phys. Rev. B: Condens. Matter Mater. Phys., 1990, 42, 4255–4262 CrossRef CAS PubMed.
- I. Brown, Z. Kristallogr. – Cryst. Mater., 1992, 199, 255–274 CrossRef CAS.
- J. Galy and R. Enjalbert, J. Solid State Chem., 1982, 44, 1–23 CrossRef CAS.
- D. L. Medlin and G. J. Snyder, Curr. Opin. Colloid Interface Sci., 2009, 14, 226–235 CrossRef CAS.
- Y. Liu, Y. Lin, Z. Shi, C.-W. Nan and Z. Shen, J. Am. Ceram. Soc., 2005, 88, 1337–1340 CrossRef CAS.
- R. Funahashi, I. Matsubara and S. Sodeoka, Appl. Phys. Lett., 2000, 76, 2385–2387 CrossRef CAS.
- D. P.-L. a. P. A. Thérèse, Ann. Chim. Phys., 1819, 10, 395–413 Search PubMed.
- K. Kurosaki, H. Muta, M. Uno and S. Yamanaka, J. Alloys Compd., 2001, 315, 234–236 CrossRef CAS.
- J. Callaway and H. C. von Baeyer, Phys. Rev., 1960, 120, 1149–1154 CrossRef CAS.
- G. S. Nolas, G. Fowler and J. Yang, J. Appl. Phys., 2006, 100, 043705 CrossRef.
Footnote |
| † Electronic supplementary information (ESI) available. See DOI: 10.1039/d0tc00818d |
| This journal is © The Royal Society of Chemistry 2020 |


