High recorded color rendering index in single Ce,(Pr,Mn):YAG transparent ceramics for high-power white LEDs/LDs†
Yuelong
Ma‡
 ab,
Le
Zhang‡
 *acd,
Tianyuan
Zhou
 a,
Bingheng
Sun
 a,
Yun
Wang
 b,
Jian
Kang
 a,
Pan
Gao
 e,
Jin
Huang
 a,
Farida A.
Selim
 c,
Chingping
Wong
 d,
Ming
Li
 f and
Hao
Chen
 *a
*a
aJiangsu Key Laboratory of Advanced Laser Materials and Devices, School of Physics and Electronic Engineering, Jiangsu Normal University, Xuzhou, 221116, P. R. China. E-mail: zhangle@jsnu.edu.cn; chenhao@jsnu.edu.cn
bSchool of Mechanical Engineering, Jiangsu University, Zhenjiang, 212013, P. R. China
cDepartment of Physics and Astronomy, Bowling Green State University, Bowling Green, 43403, USA
dSchool of Materials Science and Engineering, Georgia Institute of Technology, Atlanta, 30332, USA
eCollege of Materials Science and Engineering, Nanjing Tech University, Nanjing, 210009, P. R. China
fDepartment of Mechanical, Materials and Manufacturing, University of Nottingham, Nottingham NG14BU, UK
First published on 12th February 2020
Abstract
Transparent ceramics (TCs) are incredibly promising color converters for high-power white LEDs/LDs. However, the preparation process of multiple structured TCs with a high color rendering index (CRI) is a complicated technical challenge, and the inability of single-structured TCs to achieve a high CRI significantly limits their real applications. In this study, high quality single-structured Ce,(Pr,Mn):YAG TCs with “wide peak” and “narrow peak” red light emissions were designed and fabricated via a solid-state reaction and a vacuum sintering method. Compared with the emission spectra of Ce:YAG TC, the synchronous doping of Pr3+ and Mn2+ ions into Ce:YAG TC resulted in inhomogeneous broadening of the full width at half maximum (FWHM) from 91.7 nm to 102.2 nm. Impressively, the CRI of a single Ce,(Pr,Mn):YAG TC-based high-power white LED was as high as 84.8, and the correlated-color temperatures (CCTs) of the white LEDs/LDs were 5450 K and 3550 K, respectively. Furthermore, when the addition amounts of Pr3+ and Mn2+ were 0.2 at% and 0.8 at%, respectively, the as-prepared Ce,(Pr,Mn):YAG TC displayed a high quantum efficiency (IQE = 48.14%) and excellent color stability (only 5% fluctuation). Therefore, this study not only demonstrates how to overcome the spectrum deficiencies of single-structured TCs that restrain intrinsic CRI improvement, but also provides a reference for the pursuit of high luminescence properties. This work significantly reinforces the understanding of the CRI problems of TC-based high-power lighting, which is crucial for the real application of white LEDs/LDs.
1 Introduction
In recent years, white lighting emitting diodes and laser diodes (LEDs/LDs) have been considered as a new generation of light sources owing to their long lifetimes, energy savings and environmentally friendly nature.1–3 Currently, the most commonly used color converting material for white LEDs/LDs is the Ce3+:Y3Al5O12 (Ce:YAG) phosphor. Unfortunately, with the rising power of white LEDs and LDs, this phosphor usually suffers from decreasing luminous efficiency and chromaticity shifts due to heat accumulation. Therefore, color converters such as glass ceramics or phosphors in glass (PiG),4–7 single crystals (SCs),8–10 and transparent ceramics (TCs)11–13 have been proposed to replace the applied phosphor due to their facile implementation of the remote encapsulation mode. Compared with PiG and SCs, Ce:YAG TCs are developing rapidly due to their low cost, ease of achieving high doping concentration, short production cycles, high thermal conductivity (about 14 W m−1 K−1) and high mechanical strength.14–18 However, limited by the proportion mismatch of their emitted light, Ce:YAG TCs can hardly meet the requirement of a high color rendering index (CRI). This restricts the application of this brand-new solid-state lighting technology with TCs as the color converter.To address this problem, numerous strategies have been proposed to improve the CRI of Ce:YAG TCs. Co-doping red-emitting ions, such as Pr3+, Eu3+, Sm3+ or Cr3+, into Ce:YAG TC19–22 has been considered as an effective way to compensate for the loss of the red component. For example, the obtained CRI of a reported Ce/Pr-doped YAG TC was only 66.9.23 A Ce/Pr/Cr tri-doped YAG TC was investigated, and the highest CRI of the encapsulated white LEDs was 78.20 Although co-doping Pr3+ ions into Ce:YAG ceramics is a promising strategy to increase their CRI performance, the diverse charge states and the “narrow band” emission of Pr3+ ion dramatically limit the CRI of the ceramics.24–27 In addition to Pr3+ doping, a Ce3+/Mn2+/Si4+ tri-doped YAG TC obtained a CRI as high as 82.5.28 Unfortunately, the luminous efficiency of Ce3+/Mn2+/Si4+:YAG was only 14.0 lm W−1. Mn2+ ion has multiple coordination numbers in the YAG host; however, only 6-coordinated Mn2+ contributes to the 580 nm emission, which is significant to promote the CRI in white LEDs/LDs. Increasing the Mn2+ doping concentration would force excess Mn2+ ions to occupy the 4 coordinated Al3+ sites (emitted at 740 nm), which exceeds the cutoff wavelength of the CIE 1931 color-matching function x.22,29–33 Therefore, the contribution of Mn2+ doping to the CRI improvement of white LEDs/LDs is still limited.
Designing ceramics with multiple structures has been employed to regulate the spectral properties of TCs to achieve high CRI. A Ce:YAG/Ce,Cr:YAG dual-layered phosphor ceramic revealed that the colorimetric parameters could be controlled by the Cr3+ ion concentration and ceramic thickness; however, its CRI value was not provided.34 A Ce:YAG/Ce:(Gd,Y)AG dual-layered TC was constructed using a silicone binder, and a CRI of 62.9 was obtained.35 However, the designed structure was unreliable in white LED applications due to its poor thermal stability and refractive index mismatch. In addition, a Ce:GYAG/Ce:YAG ceramic was fabricated by controlling the powder ratios, and the obtained CRI was only 70.36 However, the nonuniform linear shrinkage of the composite ceramics inevitably resulted in the generation of micro cracks and defects. Furthermore, the red phosphor Eu2+:CaAlSiN3 (Eu:CASN) was coated on the Ce:YAG TC surface using the spin-coating technique, which effectively increased the red component of the emitted light, and a CRI of up to 85 was obtained.17 However, the red phosphor is unstable and easily decomposes or oxidizes. Also, the preparation process of the red phosphor is harsh. These reported CRI improvement methods with respect to the composite structure design strategy were achieved merely by spectral superposition and interface combination, which inevitably result in complex fabrication processes, high cost and difficult encapsulation. Efforts have been made by researchers to enhance the CRI of TC; most of the obtained CRIs were lower than 70, except for the red light-emitting ion doping strategy, as shown in Table S1 in the ESI.†15,19,20,23,37–46 Therefore, there is no doubt that adjusting the emitted color proportion in single-structured TCs should be considered as an effective strategy to pursue high CRI performance.
Considering the appropriate red-green-blue light proportion along with the simultaneous emission of wide and narrow peaks in the red region, the strategy of synchronous doping of Pr3+ and Mn2+ ions into Ce:YAG TC is expected to achieve a high CRI value. In this study, based on the specific design of synchronous doping of Pr3+ and Mn2+ ions, the multi-path energy transfer of both “wide peak” and “narrow peak” red light emission in single structured TCs was proposed. The microstructures, optical properties, quantum efficiencies, color stability and surface temperatures of the Ce,(Pr,Mn):YAG TCs were investigated systematically. In addition, high-power white LED/LD devices were designed and constructed in the remote encapsulation mode, and the luminous performance of the as-prepared TCs was verified with the purpose of providing approaches to fabricate TCs with high CRI. This excellent color performance indicates that this work will open a new perspective to develop TCs for real applications in the lighting, projection and scintillation fields in the future.
2 Experimental procedure
2.1 Preparation of Ce,(Pr,Mn):YAG ceramics
In this study, commercial Al2O3 (99.99%, Alfa Aesar, Ward Hill, America), Y2O3 (99.99%, Alfa Aesar, Ward Hill, America), CeO2 (99.995%, Shandong Xiya, Shandong, China), Pr6O11 (99.995%, Shandong Xiya, Ltd, Shandong, China) and MnCO3 (99.9%, Shandong Xiya, Shandong, China) were selected as the starting materials, and 0.5 wt% tetraethyl orthosilicate (99.99%, Alfa Aesar, Ward Hill, America) was chosen as the sintering additive. These starting powders were mixed precisely using an analytical balance according to the formula (Ce0.003PrxY0.997−x)3(Al1−yMny)5O12 (x = 0, 0.002, 0, 0.0005, 0.001, 0.0015, 0.002, 0.004 and y = 0, 0, 0.004, 0.005, 0.006, 0.007, 0.008, 0.01), denoted as Pr0Mn0, Pr02Mn0, Pr0Mn04, Pr005Mn05, Pr01Mn06, Pr015Mn07, Pr02Mn08, and Pr04Mn10, respectively, and the detailed formula design is listed in Table 1.| Sample no. | Stoichiometry | Doping (at%) | ||
|---|---|---|---|---|
| Ce | Pr | Mn | ||
| Pr0Mn0 | (Ce0.003Y0.997)3Al5O12 | 0.3 | — | — |
| Pr02Mn0 | (Ce0.003Pr0.002Y0.995)3Al5O12 | 0.3 | 0.2 | — |
| Pr0Mn04 | (Ce0.003Y0.997)3(Al0.996Mn0.004)5O12 | 0.3 | — | 0.4 |
| Pr005Mn05 | (Ce0.003Pr0.0005Y0.9965)3(Al0.995Mn0.005)5O12 | 0.3 | 0.05 | 0.5 |
| Pr01Mn06 | (Ce0.003Pr0.001Y0.996)3(Al0.994Mn0.006)5O12 | 0.3 | 0.1 | 0.6 |
| Pr015Mn07 | (Ce0.003Pr0.0015Y0.9955)3(Al0.993Mn0.007)5O12 | 0.3 | 0.15 | 0.7 |
| Pr02Mn08 | (Ce0.003Pr0.002Y0.995)3(Al0.992Mn0.008)5O12 | 0.3 | 0.2 | 0.8 |
| Pr04Mn10 | (Ce0.003Pr0.004Y0.993)3(Al0.99Mn0.01)5O12 | 0.3 | 0.4 | 1.0 |
The mixed powders were ball milled with high purity alumina balls for 20 h under 200 rpm in ethanol, and the obtained slurry was then dried at 80 °C for 24 h in an oven. The dried powders were ground and sieved through a 150-mesh screen. After pressing the powders into pellets at 20 MPa using a stainless steel mold (Φ = 22 mm), the obtained green bodies were then cold isostatic pressed (CIPed) at 220 MPa for 10 min. The CIPed green bodies were calcined at 700 °C for 6 h in air to remove the organic residues and then vacuum sintered at 1750 °C for 8 h under 10−5 Pa in a tungsten mesh heated vacuum furnace (712T, Thermal Technology LLC, USA). Finally, all the sintered ceramics were polished on both surfaces to 1.0 mm for characterization.
2.2 Characterization
The phase compositions of all the samples were characterized using a X-ray diffraction (XRD) machine equipped with a copper target X-ray tube (D8 Avance, Bruker, Karlsruhe, Germany) in the scanning range of 10–80°. The crystal structure refinement was performed by the Rietveld method using the General Structure Analysis System (GSAS) software.47–49 The morphologies of the sintered ceramics were characterized by scanning electron microscopy (SEM; JSM-6510, JEOL, Tokyo, Japan). The transmittance spectra of the polished samples were tested using an UV-Vis-NIR spectrophotometer (Lambda 950, PerkinElmer, USA). Photoluminescence (PL), photoluminescence excitation (PLE) and fluorescence decay spectra were measured using a fluorescence spectrophotometer (FLS920P, Edinburgh, UK) with a scintillating xenon lamp. The chromaticity parameters of the samples were measured using an integrating sphere (R98, Everfine, Hangzhou, China) excited by a 460 nm blue chip as well as a 455 nm laser source. All these measurements were carried out at room temperature.3 Results and discussion
3.1 Phase structures and microstructures
The XRD patterns of the sintered Ce,(Pr,Mn):YAG TCs are shown in Fig. 1. The diffraction peaks of all the Ce,(Pr,Mn):YAG ceramics matched well with the crystal structure of YAG (JCPDS 033-0040), and no impurity phases (e.g. YAP, YAM, CeO2, Pr6O11 or MnCO3) were detected; this indicates that the Ce3+, Mn2+ and Pr3+ ions were completely solid-soluted into the YAG lattice. With Pr3+ and Mn2+ doping, the diffraction peaks of the ceramics shifted to lower angles (in the right part of Fig. 1(a), around 33.5°). This demonstrated that Pr3+ and Mn2+ doping resulted in a larger unit cell. Generally, due to their similar ion radii, Pr3+ (0.096 nm, CN = 8) occupies the dodecahedral Y3+ (0.1019 nm, CN = 8) position, and Mn2+ (0.066 nm, CN = 6) occupies the octahedral Al3+ (0.0535 nm, CN = 6) site in the YAG lattice.29,30,50–52 A schematic of the crystal structure of the Ce,(Pr,Mn):YAG TCs is displayed in Fig. 1(b). Therefore, the concentration variation of the quantity of Mn2+ ion substituting Al3+ ion in this study was greater than that of Pr3+ ion substituting Y3+ ion, resulting in the lower angle shift of the main diffraction peak (420) in the XRD pattern.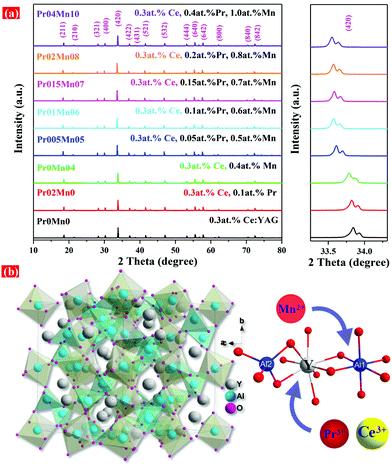 | ||
| Fig. 1 XRD patterns of (a) TCs with different Pr3+ and Mn2+ doping concentrations and magnified XRD patterns around 33°, (b) schematic of the crystal structure of the Ce,(Pr,Mn):YAG TCs. | ||
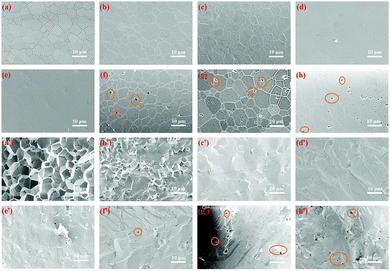
The SEM micrographs of the polished surfaces and fracture surfaces of the prepared ceramics are exhibited in Fig. 2. The average gain size was determined by the linear intercept method. All the samples showed regular grains and clean grain boundaries. Notably, the samples Pr0Mn0 to Pr005Mn05 exhibited completely dense microstructures, leading to their high transmittance. However, with increasing Mn and Pr concentrations up to 0.4 at% and 0.1 at%, respectively, micro-pores could be easily observed (Fig. 2(e)–(g)), resulting in decreased transparency. From the fracture surfaces of the ceramics (Fig. 2(e′)–(g′)), it could be found that their fracture modes changed from intergranular to transgranular with increasing Mn and Pr doping concentrations. This was remarkably similar to the results obtained by Jiang et al.53 The average grain sizes of Pr0Mn0–Pr04Mn10 were 5.34 μm, 5.98 μm, 6.26 μm, 6.28 μm, 9.91 μm, 6.08 μm, 6.34 μm and 6.12 μm, respectively, indicating that addition of a small amount of active ions did not greatly affect the grain size of the ceramics. The particle size distributions of all the samples can be found in Fig. S1 (ESI†). Moreover, it has been pointed out that the second phases and micro-pores can act as scattering centers in phosphor ceramics,6,11,45,54–58 resulting in increased extraction efficiency of the incident blue light, which has a favorable effect on the luminous performance of TCs. Actually, in the application of white LED lighting, the second phase indeed enhances the utilization of incident blue light and weakens the TIR (total interface refraction). However, further research should be carried out on white LD lighting.
3.2 Optical properties
The in-line transmission spectra and appearances of the Ce,(Pr,Mn):YAG TCs are presented in Fig. 3. In the inset, the words behind the TCs can be clearly recognized by the naked eye, indicating good transparency of the ceramics. Obviously, with increasing Pr3+ and Mn2+ concentrations, the color of the samples varied from yellow to orange-red. Therefore, it can be concluded that the emission of the TCs was tuned effectively by doping with Pr3+ and Mn2+ ions, which is important to enhance the red light emission of white LEDs/LDs. The Ce:YAG TC Pr0Mn0 possessed the best transmittance, which reached 80.7% at 800 nm. Absorption bands around at 330 to 360 nm and 440 to 470 nm could be observed for all the ceramics, originating from the 4f–5d1 and 4f–5d2 transitions of Ce3+ ions. The characteristic absorption bands of Mn2+ (440 nm/534 nm) and Pr3+ (450 nm/605 nm) ions were also observed from all the Pr/Mn-doped samples. The absorption bands around 450 nm and 605 nm were attributed to the 3H4 → 3P0 and 3H4 → 1D2 transitions of Pr3+ ion,59 whereas the 440 nm and 534 nm bands were due to the 6A1 → 4T2 and 4T1 → 4T2 transitions of Mn2+ ions.22,32,57,60,61 With increasing Mn2+ and Pr3+ concentrations, the transmittance at 800 nm of the TCs declined sharply (T = 80.7–44.0%). The detailed transmittances of the ceramics located at 800 nm and 400 nm are shown in Fig. S2 (ESI†). The decrease in transmittance can be attributed to the sintering promotion effects of the Pr6O11 and MnCO3 raw powders as sintering additives, which accelerated the grain boundary migration rate of the ceramics during sintering. As a result, a portion of the intergranular pores could be enclosed into the grains to form intragranular pores, which can act as scattering centers to decrease the optical transmittance of the sintered ceramics. A similar phenomenon was observed for reported (Y,Gd)AG:Ce ceramics, in which intragranular pores were observed in the heavily Gd-doped samples.16,18,39,62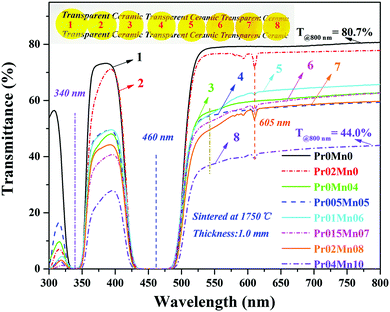 | ||
| Fig. 3 Optical transmission spectra of the Ce,(Pr,Mn):YAG TCs with 1.0 mm thickness and their appearances (inset). | ||
The PL and PLE spectra of the as-prepared ceramics are depicted in Fig. 4. From the PLE spectra (λem = 545 nm), it can be clearly seen that all the samples exhibited two broad excitation bands located at 330–360 nm and 440–470 nm, respectively, originating from the 4f–5d2 and 4f–5d1 transitions of Ce3+ ion (Fig. 4a). The characteristic emission peaks of Ce3+ (545 nm), Pr3+ (609 nm) and Mn2+ (580 nm) ions can be observed, respectively, in Fig. 4b. According to the optimization of the applied sintering additive and sintering method, divalent Mn was obtained in the Ce,(Pr,Mn):YAG TCs. This can be attributed to three main reasons. Firstly, MnCO3 raw powders (Mn2+ ions) were applied as the raw material, which prevented the adverse charge state conversion of Mn2+ ions from the source because the Mn2+ state is the most stable charge state. Secondly, the sintering process was carried out under a high vacuum atmosphere without a subsequent annealing process; thus, it was impossible to oxidize the Mn2+ ions into higher charge states. Finally, the applied sintering additive was SiO2, and this also prevented the conversion of Mn2+ ions to adverse charge states. Therefore, the charge state conversion of Mn ion could be directly observed from the spectral properties of all the Ce,(Pr,Mn):YAG TCs. Additionally, the PL spectrum of Pr0Mn04 was distinctly expanded compared to that of Pr0Mn0, which was caused by the emission of Mn2+ ions (580 nm). Meanwhile, the characteristic emission peaks of Ce3+, Pr3+ and Mn2+ ions could be observed for all the Ce,(Pr,Mn):YAG TCs (Fig. 4c). Notably, inhomogeneous spectral broadening could be achieved though the synergistic effect of synchronous doping of Pr3+ and Mn2+ ions, and the corresponding FWHM values increased from 91.7 to 102.2 nm with increasing Pr3+ and Mn2+ concentrations (Fig. 4d). The structural parameters are listed in Table S2 and Fig. S3 (ESI†). The polyhedron distortion ratio (D) value increased with increasing addition of Pr3+ and Mn2+ ions. Therefore, incorporating Pr3+ and Mn2+ can reduce the local symmetry of the dodecahedron CeO8 in the Ce,(Pr,Mn):YAG TC. Generally, the FWHM is dependent on the local coordination environment of Ce3+, which is affected by the host composition.63–66 The increase of the FWHM can be ascribed to the increased polyhedron distortion ratio and the reduced structural symmetry in the Pr02Mn08 TC. A PL band with a wide FWHM is advantageous in promoting the color-conversion in Ce:YAG TC, which is beneficial to achieve warm light emission with a high CRI.
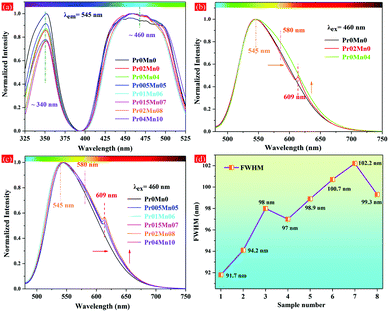 | ||
| Fig. 4 Normalized (a) PLE and (b and c) PL spectra and (d) the FWHM evolution of the PL spectra of the prepared ceramics. | ||
3.3 Luminous performance of white LEDs/LDs
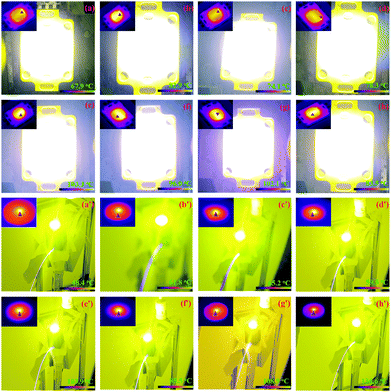
To further evaluate the luminous properties of the ceramics and validate their availability as white light convertors, white LED devices were assembled by combining the ceramics with a 20 W blue LED chip (460 nm) using the remote encapsulation mode. Also, a white LD using a 455 nm laser emitting source was constructed by the transmission mode.67 The lighting photographs and infrared thermal images of the TC-based white LEDs/LDs are shown in Fig. 5. With increasing Pr3+ and Mn2+ concentrations, the emitting color of the assembled white LEDs distinctly varied from yellow-white to pure white, and the highest color rending property was reached (CRI = 84.8) when the Pr3+ and Mn2+ concentrations were 0.2 at% and 0.8 at%, respectively. However, the emitting color of the Pr04Mn10 sample transformed into yellowish-white owing to the mismatched Pr3+/Mn2+ concentration (Fig. 5(h)). Therefore, the hue of the TCs could be regulated by the synchronous doping effect.Additionally, the temperature distributions of all the ceramics were uniform, indicating their good thermal conductivity (see the inset of Fig. 5). The operating temperature increased from 67.9 °C (Pr0Mn0) to 103.3 °C (Pr01Mn06) and then decreased to 83.5 °C (Pr04Mn10). It was found that the Pr0Mn0 sample exhibited the lowest temperature; this illustrates that energy loss, which will be transferred into residual heat, is inevitable during the energy transfer process among Ce3+–Pr3+–Mn2+ ions.
Warm yellow light emission could be observed from all the LD-excited TC devices, and no obvious change was observed with respect to the hue (Fig. 5(a′–h′)). Notably, the Pr02Mn08 sample exhibited red-yellow emission (CRI = 70, CCT = 3550 K), indicating that its red emission component was higher than those of the other samples. As a result, the TC-based white LD in this study could be used as a warm light source with high CRI.
Interestingly, for the temperature distribution of the white LDs, the measured temperatures matched well with the optical transmittance of the samples (Fig. 3), confirming that the residual pores reduced the thermal conductivity of the ceramics. Compared with the LED light source, the LD source is a point light source with a high energy density (12 W mm−2). Accordingly, the effect of the residual pores on the heat dissipation of ceramics under LD excitation is more obvious than that under LED excitation. It has been reported that heat accumulation decreases the luminance performance of white LDs.
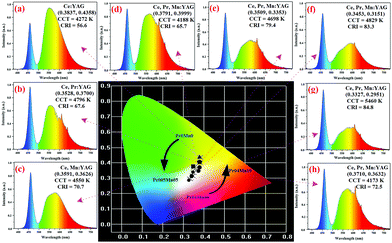
The electroluminescence spectra and chromaticity parameters are shown in Fig. 6. The CIE color coordinates ranged from (0.3837, 0.4358) to (0.3327, 0.2951), corresponding to the yellow and white areas, respectively. Amazingly, the CRI of the Pr02Mn08 sample was as high as 84.8. To the best of our knowledge, this is the highest recorded CRI value obtained from a single-structured TC material. Meanwhile, the CCT of the white LED devices varied from 4272 to 5456 K, which are relatively ideal values on the Planck trajectory. As a result, the obtained ceramics in this study exhibit desirable luminance performance, which addresses the widespread challenge of CRI improvement in single-structured TCs.
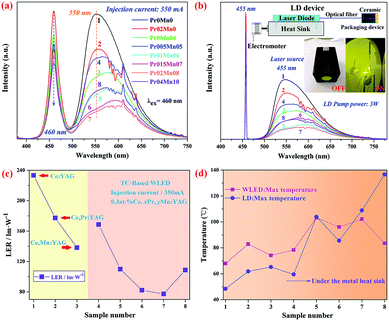
Fig. 7(a and b) shows the electroluminescence spectra of the white LEDs and LDs. The characteristic yellow-red bands between 500 nm and 700 nm correspond to the emission bands of Ce3+, Mn2+ and Pr3+ ions. The decreased blue light intensity for the Ce,(Pr,Mn):YAG TCs was attributed to their increased scattering loss compared with that of Ce:YAG. Obviously, the emission intensity of the samples decreased markedly with increasing concentration of Pr3+ and Mn2+ ions, resulting in decreased intensity of the blue-green component and the increased yellow-red proportion.
A schematic of the designed white LD device is shown in the insert of Fig. 7(b). Our previous research indicated that the transmission mode of white LDs has better color stability than their reflection mode.67 A metal heat sink with the embedded ceramic was employed to improve the heat dissipation of the TC-based LD device, and all the measurements were carried out using the same structured heat sink. The measured colorimetric parameters are listed in Table S3 (ESI†).
The luminous efficiency of radiation (LER) was calculated by formula S1 (ESI†). As shown in Fig. 7(c), the LER of the ceramics gradually declined from Pr0Mn0 to Pr04Mn10. There are two reasons for this phenomenon. One is that with the increasing Pr3+ and Mn2+ concentrations, the energy transfer-induced energy loss increases synchronously. The other factor is the decreased transmission of TCs with increasing Pr3+ and Mn2+ concentration.
Compared with Ce:YAG TC, the energy loss in the energy transfer process of the Ce,(Pr,Mn):YAG TCs will inevitably decrease the LER. In other words, a trade-off exists between LER and CRI. Yang et al. mixed green Eu2+:(Ba,Sr)2SiO4 and red Eu2+:CaAlSiN3 phosphors as a color convertor, and the achieved CRI was as high as 89, with only 56.5 lm W−1 LER obtained.68
In addition to strict control of the light proportion, the heat dissipation capability is a key factor that affects the luminance property of TCs, especially in high power white LED/LD lighting applications. Xie et al. demonstrated that the better the heat dissipation, the smaller the thermal accumulation, which is beneficial to mitigate the “thermal run-away” phenomenon of TCs to improve the resulting CRI.12 Considering that the metal heat sink could effectively improve the heat dissipation, the plate-like metal heat sink was designed to solve the heat accumulation problem under LD excitation with high energy density. As can be seen from Fig. 7(d), the heat accumulation was controlled effectively by the plate-like metal heat sink, and a similar operation temperature was obtained compared with that of the LED excitation source.
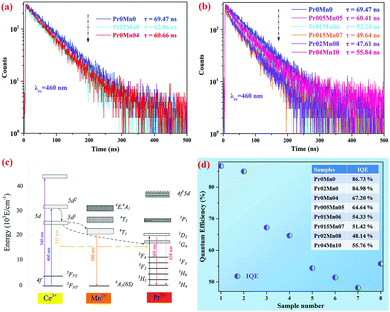
To further explore the energy transfer of the Ce,(Pr,Mn):YAG TCs, the fluorescence decay behaviors of Ce3+ at 545 nm were investigated under 460 nm excitation, as shown in Fig. 8(a) and (b). Single exponential decay was observed in all samples. With increasing Mn2+ and Pr3+ concentrations, the lifetimes of the samples displayed a decreasing trend from 69.47 ns (Pr0Mn0) to 60.66 ns (Pr0Mn04), revealing energy transfer between the Ce3+–Pr3+ ions and Ce3+–Mn2+ ions. Meanwhile, from Fig. 8(b), the lifetimes of the doped TCs decreased with increasing Ce3+, Pr3+ and Mn2+ concentrations, manifesting the increased energy transfer efficiency. Moreover, the increased lifetime of the Pr04Mn10 sample was attributed to the concentration quenching effect.
A schematic of the energy transfer process of the Ce3+–Pr3+–Mn2+ system in the YAG host is provided in Fig. 8(c). The 5d state of the Ce3+ ions splits into the 5d1 and 5d2 states, respectively. Electrons are excited to the upper 5d1 state of the Ce3+ ions by the 460 nm excitation; next, they are transferred to the 4T1 state of Mn2+ ions after a rapid relaxation process and are then transferred to the 6A1 ground state of the Mn2+ ions to produce a 580 nm light emission. Simultaneously, the energy transfer process between Ce3+ and Pr3+ ions (5d1 → 1G4) also takes place, resulting in the 609 nm red emission. Fig. 8(d) presents the IQEs of the as-prepared ceramics. With increasing Pr and Mn concentrations, the IQE of the corresponding TCs declined gradually from 86.73% to 48.14%, and then increased to 55.76%. The decreased quantum efficiency can be attributed to the energy transfer among the Ce3+–Pr3+–Mn2+ ions in the Ce,(Pr, Mn):YAG TCs.
The chromaticity parameters of the Pr02Mn08-based LED as a function of the working current are represented in Fig. 9. Obviously, with increasing injection current from 100 mA to 400 mA, the CRI increased from 82.7 to 84.8 and then decreased to 83.5. Additionally, the CCT increased from 4850 K to 6100 K with increasing current due to the increased blue light proportion. However, the variations of Dx and Dy were merely 0.031 and 0.046, respectively, which are almost negligible. Notably, the fluctuations of both CRI and CCT were only 5%, demonstrating the excellent color stability of the TCs. The detailed CCT, CRI and CIE color coordinate parameters are listed in Tables S4–S7 (ESI†). In general, the enhanced heat accumulation and blue light emission at a high driving current result in lower photon-to-photon transfer efficiency.7,60,69–73 As a result, the chromaticity parameters changed due to the color component mismatch, which affected the luminous performance of the white LEDs.
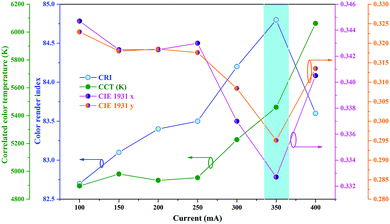 | ||
| Fig. 9 The colorimetric parameters of Pr02Mn08 under blue LED excitation as a function of the driving current. | ||
4 Conclusions
In this paper, by synchronous doping with Pr3+ and Mn2+ ions, a recorded CRI of 84.8 and natural white light emission with a CCT of 5456 K were obtained in single-structured Ce,(Pr,Mn):YAG TCs, and an inhomogeneous broadening of the FWHM from 91.7 nm to 102.2 nm was realized. In addition, the fluctuations of the obtained CRI and CCT under different driving currents of the blue LED were only 5%, demonstrating its excellent color stability. Also, a 3550 K CCT of the warm white light emission under self-constructed LD excitation was realized, and the obtained CRI was 70. Therefore, this study paves a way for the commercialization of TC-based white LEDs/LDs in the fields of high CRI lighting and displays.Conflicts of interest
The authors declare that we do not have any commercial or associative interest that represents a conflict of interest in connection with the work submitted.Acknowledgements
The authors acknowledge the generous financial support from the National Natural Science Foundation of China (61975070, 51902143, 61971207 and 61775088), Priority Academic Program Development of Jiangsu Higher Education Institutions (PAPD), Key Research and Development Project of Jiangsu Province (BE2018062 and BE2019033), Postgraduate Research & Practice Innovation Program of Jiangsu Province (KYCX18_2096, KYCX18_2097, KYCX18_2098, KYCX18_2099), Natural Science Foundation of Jiangsu Province (BK20191467), International S&T Cooperation Program of Jiangsu Province (BZ2019063) and Special Project for Technology Innovation of Xuzhou City (KC19250). Special thanks to Gloria Technology LLC (Xuzhou, China) for the electro-luminescence characterization of the white LED devices.Notes and references
- S. Pimputkar, J. S. Speck, S. P. DenBaars and S. Nakamura, Nat. Photonics, 2009, 3, 180–182 CrossRef CAS.
- X. Ma, X. Li, J. Li, C. Genevois, B. Ma, A. Etienne, C. Wan, E. Véron, Z. Peng and M. Allix, Nat. Commun., 2018, 9, 1175 CrossRef PubMed.
- H. Lin, T. Hu, Y. Cheng, M. Chen and Y. Wang, Laser Photonics Rev., 2018, 12, 1700344 CrossRef.
- D. Chen, W. Xiang, X. Liang, J. Zhong, H. Yu, M. Ding, H. Lu and Z. Ji, J. Eur. Ceram. Soc., 2015, 35, 859–869 CrossRef CAS.
- X. Zhang, J. Yu, J. Wang, B. Lei, Y. Liu, Y. Cho, R. J. Xie, H. W. Zhang, Y. Li, Z. Tian, Y. Li and Q. Su, ACS Photonics, 2017, 4, 986–995 CrossRef CAS.
- M. Gong, W. Xiang, J. Huang, C. Yin and X. Liang, RSC Adv., 2015, 5, 75781–75786 RSC.
- R. Xiang, X. Liang, P. Li, X. Di and W. Xiang, Chem. Eng. J., 2016, 306, 858–865 CrossRef CAS.
- J. Xu, A. Thorseth, C. Xu, A. Krasnoshchoka, M. Rosendal, C. Dam-Hansen, B. Du, Y. Gong and O. B. Jensen, J. Lumin., 2019, 212, 279–285 CrossRef CAS.
- C. Yang, G. Gu, X. Zhao, X. Liang and W. Xiang, Mater. Lett., 2016, 170, 58–61 CrossRef CAS.
- T. Xu, L. Yuan, Y. Chen, Y. Zhao, L. Ding, J. Liu, W. Xiang and X. Liang, Opt. Mater., 2019, 91, 30–34 CrossRef CAS.
- S. Li, Q. Zhu, D. Tang, X. Liu, G. Ouyang, L. Cao, N. Hirosaki, T. Nishimura, Z. Huang and R. J. Xie, J. Mater. Chem. C, 2016, 4, 8648–8654 RSC.
- Y. Xu, S. Li, P. Zheng, L. Wang, S. You, T. Takeda, N. Hirosaki and R. J. Xie, J. Mater. Chem. C, 2019, 7, 11449–11456 RSC.
- L. Zhang, Q. Yao, Y. Ma, B. Sun, C. Shao, T. Zhou, Y. Wang, F. A. Selim, C. Wong and H. Chen, J. Mater. Chem. C, 2019, 7, 11431–11440 RSC.
- B. Sun, L. Zhang, T. Zhou, C. Shao, L. Zhang, Y. Ma, Q. Yao, Z. Jiang, F. A. Selim and H. Chen, J. Mater. Chem. C, 2019, 7, 4057–4065 RSC.
- C. Gu, X. J. Wang, C. Xia, S. Li, P. Liu, D. Li, H. Li, G. Zhou, J. Zhang and R. J. Xie, J. Mater. Chem. C, 2019, 7, 8569–8574 RSC.
- X. Qian, M. Shi, B. Yang, Y. Li, J. Zou, Z. Liu and F. Zheng, Opt. Mater., 2019, 94, 172–181 CrossRef.
- X. Qian, Y. Li, M. Shi, B. Yang, F. Zheng, Z. Liu and J. Zou, Ceram. Int., 2019, 45, 21520–21527 CrossRef CAS.
- X. Liu, H. Zhou, Z. Hu, X. Chen, Y. Shi, J. Zou and J. Li, Opt. Mater., 2019, 88, 97–102 CrossRef CAS.
- Y. Tang, S. Zhou, X. Yi, S. Zhang, D. Hao and X. Shao, J. Am. Ceram. Soc., 2017, 100, 2590–2595 CrossRef CAS.
- S. Feng, H. Qin, G. Wu, H. Jiang, J. Zhao, Y. Liu, Z. Luo, J. Qiao and J. Jiang, J. Eur. Ceram. Soc., 2017, 37, 3403–3409 CrossRef CAS.
- W. Xu, D. Chen, S. Yuan, Y. Zhou and S. Li, Chem. Eng. J., 2017, 317, 854–861 CrossRef CAS.
- Q. Zhou, L. Dolgov, A. M. Srivastava, L. Zhou, Z. Wang, J. Shi, M. D. Dramićanin, M. G. Brik and M. Wu, J. Mater. Chem. C, 2018, 6, 2652–2671 RSC.
- Y. Tang, S. Zhou, X. Yi, D. Hao, X. Shao and J. Chen, J. Alloys Compd., 2018, 745, 84–89 CrossRef CAS.
- C. Hu, X. Feng, J. Li, L. Ge, Y. Zhang, H. Kou, J. Xu and Y. Pan, Opt. Mater., 2017, 69, 214–218 CrossRef CAS.
- Z. Hu, M. Cao, H. Chen, Y. Shi, H. Kou, T. Xie, L. Wu, Y. Pan, X. Feng, A. Vedda, A. Beitlerova, M. Nikl and J. Li, Opt. Mater., 2017, 72, 201–207 CrossRef CAS.
- Q. Liu, X. Li, J. Dai, Z. Yang, T. Xie and J. Li, Opt. Mater., 2018, 84, 330–334 CrossRef CAS.
- Z. Hu, X. Chen, H. Chen, Y. Shi, X. Liu, T. Xie, H. Kou, Y. Pan, E. Mihóková, M. Nikl and J. Li, J. Lumin., 2019, 210, 14–20 CrossRef CAS.
- G. Ao, Y. Tang, X. Yi, Y. Tian, J. Chen, D. Hao, Y. Lin and S. Zhou, J. Alloys Compd., 2019, 798, 695–699 CrossRef.
- Y. Zhang, S. Hu, Y. Liu, Z. Wang, G. Zhou and S. Wang, Ceram. Int., 2018, 44, 23259–23262 CrossRef CAS.
- D. Chen, Y. Zhou, W. Xu, J. Zhong, Z. Ji and W. Xiang, J. Mater. Chem. C, 2016, 4, 1704–1712 RSC.
- Y. Shi, Y. Wang, Y. Wen, Z. Zhao, B. Liu and Z. Yang, Opt. Express, 2012, 20, 21656–21664 CrossRef CAS PubMed.
- W. Xiang, J. Zhong, Y. Zhao, B. Zhao, X. Liang, Y. Dong, Z. Zhang, Z. Chen and B. Liu, J. Alloys Compd., 2012, 542, 218–221 CrossRef CAS.
- Z. Pan, J. Chen, H. Wu and W. Li, Opt. Mater., 2017, 72, 257–264 CrossRef CAS.
- X. Yi, S. Zhou, C. Chen, H. Lin, Y. Feng, K. Wang and Y. Ni, Ceram. Int., 2014, 40, 7043–7047 CrossRef CAS.
- C. Hu, Y. Shi, X. Feng and Y. Pan, Opt. Express, 2015, 23, 18243–18255 CrossRef CAS PubMed.
- S. Chen, B. Jiang, Y. Wang, Q. Zhu, Q. Yang, W. Ma, G. Zhang and L. Zhang, J. Rare Earths, 2019, 37, 978–983 CrossRef CAS.
- S. Hu, C. Lu, G. Zhou, X. Liu, X. Qin, G. Liu, S. Wang and Z. Xu, Ceram. Int., 2016, 42, 6935–6941 CrossRef CAS.
- Y. Liu, M. Zhang, Y. Nie, J. Zhang and J. Wang, J. Eur. Ceram. Soc., 2017, 37, 4931–4937 CrossRef CAS.
- C. Shao, L. Zhang, T. Zhou, L. Gu, B. Sun, Z. Jiang, Q. Yao, W. Bu, K. Wang and H. Chen, Ceram. Int., 2018, 44, 8672–8678 CrossRef CAS.
- L. Zhang, B. Sun, L. Gu, W. Bu, X. Fu, R. Sun, T. Zhou, F. A. Selim, C. Wong and H. Chen, Appl. Surf. Sci., 2018, 455, 425–432 CrossRef CAS.
- Y. Ma, L. Zhang, L. Zhang, T. Zhou, Z. Jiang, B. Sun, Q. Yao, H. Chen and Y. Wang, Ceram. Int., 2019, 45, 4817–4823 CrossRef CAS.
- B. Wang, J. Ling, Y. Zhou, W. Xu, H. Lin, S. Lu, Z. Qin and M. Hong, J. Lumin., 2019, 213, 421–426 CrossRef CAS.
- S. Liu, P. Sun, Y. Liu, T. Zhou, S. Li, R.-J. Xie, X. Xu, R. Dong, J. Jiang and H. Jiang, ACS Appl. Mater. Interfaces, 2019, 11, 2130–2139 CrossRef CAS PubMed.
- X. Liu, X. Qian, P. Zheng, Z. Hu, X. Chen, H. Pan, J. Zou, R. Xie and J. Li, J. Eur. Ceram. Soc., 2019, 39, 4965–4971 CrossRef CAS.
- X. Liu, X. Qian, Z. Hu, X. Chen, Y. Shi, J. Zou and J. Li, J. Eur. Ceram. Soc., 2019, 39, 2149–2154 CrossRef CAS.
- J. Chen, Y. Tang, X. Yi, Y. Tian, G. Ao, D. Hao, Y. Lin and S. Zhou, Opt. Mater. Express, 2019, 9, 3333–3341 CrossRef CAS.
- T. Wang, Q. Xiang, Z. Xia, J. Chen and Q. Liu, Inorg. Chem., 2016, 55, 2929–2933 CrossRef CAS PubMed.
- H. Qin, J. Jiang, Z. Luo and H. Jiang, J. Mater. Chem. C, 2016, 4, 244–247 RSC.
- Y. Liu, J. Silver, R. J. Xie, J. Zhang, H. Xu, H. Shao, J. Jiang and H. Jiang, J. Mater. Chem. C, 2017, 5, 12365–12377 RSC.
- L. Feng, Z. Hao, X. Zhang, L. Zhang, G. Pan, Y. Luo, L. Zhang, H. Zhao and J. Zhang, Dalton Trans., 2016, 45, 1539–1545 RSC.
- H. Chen, H. Lin, J. Xu, B. Wang, Z. Lin, J. Zhou and Y. Wang, J. Mater. Chem. C, 2015, 3, 8080–8089 RSC.
- R. Zheng, D. Luo, Y. Yuan, Z. Wang, Y. Zhang, W. Wei, L. B. Kong, D. Tang and R. J. Xie, J. Am. Ceram. Soc., 2015, 98, 3231–3235 CrossRef CAS.
- Q. Liu, Y. Yuan, J. Li, J. Liu, C. Hu, M. Chen, L. Lin, H. Kou, Y. Shi, W. Liu, H. Chen, Y. Pan and J. Guo, Ceram. Int., 2014, 40, 8539–8545 CrossRef CAS.
- Z. Liu, S. Li, Y. Huang, L. Wang, H. Zhang, R. Jiang, F. Huang, X. Yao, X. Liu and Z. Huang, J. Alloys Compd., 2019, 785, 125–130 CrossRef CAS.
- Y. H. Song, E. K. Ji, B. W. Jeong, M. K. Jung, E. Y. Kim, C. W. Lee and D. H. Yoon, Dyes Pigm., 2017, 139, 688–692 CrossRef CAS.
- Y. Liu, S. Liu, P. Sun, Y. Du, S. Lin, R. J. Xie, R. Dong, J. Jiang and H. Jiang, ACS Appl. Mater. Interfaces, 2019, 11, 21697–21701 CrossRef CAS PubMed.
- J. Yu, S. Si, Y. Liu, X. Zhang, Y. Cho, Z. Tian, R. Xie, H. Zhang, Y. Li and J. Wang, J. Mater. Chem. C, 2018, 6, 8212–8218 RSC.
- J. Wang, X. Tang, P. Zheng, S. Li, T. Zhou and R. J. Xie, J. Mater. Chem. C, 2019, 7, 3901–3908 RSC.
- H. Song, C. Lu, X. Liu and Z. Xu, Opt. Mater., 2016, 60, 394–397 CrossRef.
- Y. Tian, Y. Tang, X. Yi, G. Ao, J. Chen, D. Hao, Y. Lin and S. Zhou, J. Alloys Compd., 2020, 813, 152236 CrossRef CAS.
- E. Tong, K. Song, Z. Deng, S. Shen, H. Gao, W. Su and H. Wang, J. Lumin., 2020, 217, 116787 CrossRef CAS.
- J. Y. Zhang, Z. H. Luo, Y. F. Liu, H. C. Jiang, J. Jiang, G. Q. Liu, J. X. Zhang and H. M. Qin, J. Eur. Ceram. Soc., 2017, 37, 4925–4930 CrossRef CAS.
- H. Ding, H. Qin, S. Feng, H. Hua, Q. Du, H. Jiang, J. Jiang and H. Jiang, Chem. Commun., 2019, 55, 12188–12191 RSC.
- P. Sun, P. Hu, Y. Liu, S. Liu, R. Dong, J. Jiang and H. Jiang, J. Mater. Chem. C, 2020, 8, 1405–1412 RSC.
- H. Ji, L. Wang, Y. Cho, N. Hirosaki, M. S. Molokeev, Z. Xia, Z. Huang and R. J. Xie, J. Mater. Chem. C, 2016, 4, 9872–9878 RSC.
- H. Ji, L. Wang, M. S. Molokeev, N. Hirosaki, Z. Huang, Z. Xia, O. M. ten Kate, L. Liu and R. Xie, J. Mater. Chem. C, 2016, 4, 2359–2366 RSC.
- J. Kang, L. Zhang, Y. Li, Y. Ma, B. Sun, Y. Liu, T. Zhou, F. A. Selim, C. P. Wong and H. Chen, J. Mater. Chem. C, 2019, 7, 14357–14365 RSC.
- Y. J. Park, S. W. Kim, C. J. Kim, Y. J. Lee and J. Hwang, J. Alloys Compd., 2019, 794, 94–100 CrossRef CAS.
- P. Huang, B. Zhou, Q. Zheng, Y. Tian, M. Wang, L. Wang, J. Li and W. Jiang, Adv. Mater., 2020, 32, 1905951 CrossRef CAS PubMed.
- R. Cao, L. Wu, X. Di, P. Li, G. Hu, X. Liang and W. Xiang, Opt. Mater., 2017, 70, 92–98 CrossRef CAS.
- Z. Lin, H. Lin, J. Xu, F. Huang, H. Chen, B. Wang and Y. Wang, J. Alloys Compd., 2015, 649, 661–665 CrossRef CAS.
- J. Huang, X. Hu, J. Shen, D. Wu, C. Yin, R. Xiang, C. Yang, X. Liang and W. Xiang, CrystEngComm, 2015, 17, 7079–7085 RSC.
- J. Li, Q. Liang, J. Y. Hong, J. Yan, L. Dolgov, Y. Meng, Y. Xu, J. Shi and M. Wu, ACS Appl. Mater. Interfaces, 2018, 10, 18066–18072 CrossRef CAS PubMed.
Footnotes |
| † Electronic supplementary information (ESI) available. See DOI: 10.1039/d0tc00032a |
| ‡ These authors contributed equally to this work. |
| This journal is © The Royal Society of Chemistry 2020 |

