Fabrication of lightweight and flexible silicon rubber foams with ultra-efficient electromagnetic interference shielding and adjustable low reflectivity†
Jianming
Yang
,
Xia
Liao
 *,
Gui
Wang
,
Jia
Chen
,
Wanyu
Tang
,
Tengfei
Wang
and
Guangxian
Li
College of Polymer Science and Engineering, State Key Laboratory of Polymer Materials Engineering, Sichuan University, Chengdu 610065, People's Republic of China. E-mail: xliao@scu.edu.cn
First published on 19th November 2019
Abstract
Lightweight and efficient electromagnetic interference (EMI) shielding composites are of great significance for the development of next generation communication technology, wearable equipment and high-power electronic equipment. However, it is still challenging to achieve the purpose of both high EMI shielding performance and a low reflection ratio. In this work, lightweight and flexible silicon rubber composite foams were fabricated through supercritical carbon dioxide (scCO2) foaming and layered structure construction. The magnetic ferriferrous oxide (Fe3O4)@multi-walled carbon nanotube (MWCNT) nanoparticles and the porous structure of the upper layer of silicon rubber/Fe3O4@MWCNT foam act as an effective absorbing layer, while dense silver particles with high conductivity on the surface of silver-coated non-woven fabric (Ag@NWF) show efficient electromagnetic (EM) wave reflection ability at the bottom. The EM waves undergo the process of “absorption–reflection–reabsorption” when they travel in the layered structure foam. The composite foam shows an EMI shielding effectiveness (SE) approaching 90 dB at a low filler content (2.08 vol% Fe3O4@MWCNTs and 0.81 vol% Ag) and density (0.38 g cm−3) in 8.2–12.4 GHz due to the selective distribution of silver nanoparticles on the surface of non-woven fabric and the introduction of a porous structure. The average reflection coefficient (R) is as low as 0.54, which indicates that only 54% of the EM waves are reflected back to the air. Moreover, the R value reaches a very low peak of 0.026 because of the destructive interference between the reflected and incident EM waves. This work provides a feasible idea for the preparation of lightweight, high efficiency and low reflection EMI shielding composites.
1. Introduction
With the popularization of electronic communication equipment in contemporary society, the resulting electromagnetic (EM) radiation has become a serious pollution that cannot be ignored.1–5 Therefore, it is of great significance to develop electromagnetic interference (EMI) shielding materials.6–8 Conductive polymer composites are used extensively in the field of EMI shielding owing to their advantages of lightweight, easy process, adjustable conductivity and corrosion resistance.9–13 Previous studies showed that increasing the electrical conductivity is one of the most effective measures to enhance the EMI shielding effectiveness (SE) of the materials. The conductivity of multi-walled carbon nanotubes (MWCNTs)/waterborne polyurethane composites can reach 2100 S m−1 when the filler content is 76.2 wt%, and their EMI SE can reach 62 dB in the 8.2–12.4 GHz frequency range (X-band). However, the reflection SE and reflection coefficient (R) of the composites are up to 15 dB and 0.97 respectively, indicating that 97% of the EM waves are reflected outside.14 Recently, transition-metal carbides (MXenes) have been used to fabricate EMI shielding materials due to their ultrahigh conductivity (4665 S m−1).15,16 The EMI SE of MXenes films can exceed 90 dB, but the reflected SE is up to 25 dB, and more than 99% of EM waves are reflected.17 Although the composites show outstanding EMI SE at high conductivity, the enormous impedance mismatch between air and materials will cause intense reflection of EM waves, thus resulting in serious secondary EM wave pollution.Recent studies have shown that porous EMI shielding materials exhibit lower reflection efficiency for EM waves.18 Furthermore, the existence of bubbles can significantly reduce the density and preparation cost of EMI shielding materials, thus broadening their applications in related areas such as aerospace, automobile, electronics and communication. So far the main methods of fabricating porous materials are supercritical foaming,19–23 chemical foaming,24 salt-leaching,25 phase separation26 and template-directed chemical vapor deposition (CVD).27 Among these methods, supercritical carbon dioxide (scCO2) foaming is widely used owing to its environmental protection and simplicity. Currently, various thermoplastic13,25,28,29 and thermoset30 polymers have been used to manufacture EMI shielding foams. Nevertheless, these composite foams show inadequate flexibility, which limits their applications in the fields of microelectronics technology, flexible electronic products and wearable devices.31 Now little attention has been paid on the development of flexible silicon rubber based EMI shielding composite foam because of its complex molding technology. Silicone rubber foam with various cell morphologies has been successfully prepared by the scCO2 foaming method in our previous work.18,32–35 At present silicone rubber foam is widely applied in electronic components, instruments, meters and automotive absorbers owing to its good thermal stability, excellent thermal insulation, superb flexibility and earthquake resistance.
For an EMI shielding composite, how to control the interaction between the microwave and the filler is the key to achieve high microwave absorption performance. These interactions are mainly determined by the dielectric response of the composite. Traditional carbon and metal fillers shield EM waves mainly through strong dielectric loss, which is not conducive to the absorption of the incident EM waves.8,36,37 By introducing magnetic particles into the composite, the EM waves can be transformed into heat energy through eddy current loss, hysteresis loss and residual loss, thereby increasing the absorption of EM waves. So far some ferromagnetic nanoparticles have been used to hybridize with carbon nanomaterials to obtain magnetic nano-fillers, such as MWCNT/reduced graphene oxide (rGO) coated with Fe3O4 nanoparticles (Fe3O4@MWCNT/Fe3O4@rGO)38,39 and FeCo alloy decoration rGO (FeCo@rGO).40 However, the intrinsic structure of carbon nanomaterials will be destroyed after the decoration of magnetic nanoparticles, which significantly reduces their conductivity. Recent studies have shown that silver nanoparticles can effectively improve the EMI SE of composites because of their extremely high electrical conductivity.41–43 Silver-coated non-woven fabric (Ag@NWF) not only exhibits excellent EMI shielding performance, but also shows good flexibility, which is due to the efficient overlap of silver nanoparticles and the unique braided structure of non-woven fabric (NWF). Accordingly, both low reflectivity and high EMI SE can be achieved by combining an absorbing layer that comprises magnetic nanoparticles and a reflecting layer formed by highly conductive fillers through layered structure design.
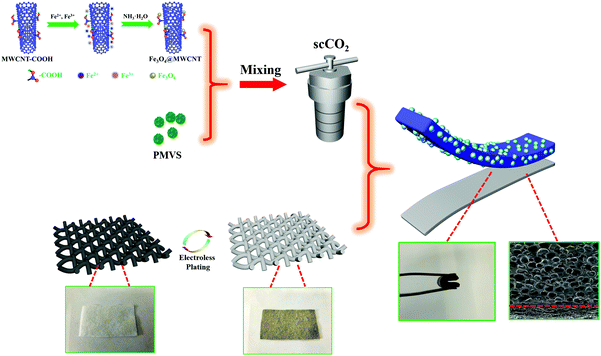
Herein, we first report an original lightweight and flexible layered methyl vinyl silicon rubber (VMQ)/Fe3O4@MWCNT/Ag@NWF foam with ultra-efficient EMI SE and adjustable low reflection characteristics by the combination of scCO2 foaming technology and layered structure construction. Once the EM waves propagate in the composite foams, they will undergo the process of “absorption–reflection–reabsorption” and are dissipated as much as possible, thus reducing the secondary EM wave pollution. The composite foam exhibits an average EMI SE of 88.4 dB and an average R value of 0.54 at a thickness of only 2.0 mm in the X-band. Interestingly, the R value shows a minimum peak value owing to the destructive interference between the incident and reflected EM waves. The R value of the foam is only 0.026 at 8.00 GHz, indicating that only 2.6% of the EM waves are reflected. The design of this layered structure provides a new insight into the preparation of high SE and low reflection EMI shielding composites.
2. Experimental
2.1 Materials
NWF was supplied by Hunan Heng’an Co., Ltd, China. AgNO3, SnCl2·2H2O, HCl, NH3·H2O, NaKC4H4O6·4H2O, α-D-(+)-glucose (C6H12O6), NaOH, FeCl3·6H2O, FeCl2·4H2O, ethanol, cyclohexane (CYH) and toluene were purchased from Chengdu Kelong Chemicals Co., Ltd. MWCNTs-COOH (diameter: 10–30 nm, length: 20–30 μm, purity >98 wt%) was received from Chengdu Organic Chemicals Co., Ltd. Polymethylvinylsiloxane (PMVS) was obtained from China Bluestar Chengrand Co., Ltd. 2,5-Dimethyl-2,5-dioxy(tertiary butyl peroxy)hexane (DBPH) was supplied by Linyi Huafeng Rubber Plastic Technology Co., Ltd. Poly(ethylene-vinyl acetate) (PEVA) was kindly provided by DuPont Company. Commercial CO2 was purchased from Qiaoyuan Gas Co., Ltd.2.2 Preparation of composite foams
![[thin space (1/6-em)]](https://www.rsc.org/images/entities/char_2009.gif) :
:![[thin space (1/6-em)]](https://www.rsc.org/images/entities/char_2009.gif) 1) and Fe3O4@MWCNT-2 (the ratio of MWCNTs to Fe3O4 was about 2
1) and Fe3O4@MWCNT-2 (the ratio of MWCNTs to Fe3O4 was about 2![[thin space (1/6-em)]](https://www.rsc.org/images/entities/char_2009.gif) :
:![[thin space (1/6-em)]](https://www.rsc.org/images/entities/char_2009.gif) 5) respectively.
5) respectively.
2.3 Characterization
The morphology and microstructure of Fe3O4@MWCNT nanoparticles were characterized by a JEOL-2100F transmission electron microscope (TEM). The crystal structures of Ag@NWF, NWF and Fe3O4@MWCNTs were obtained by X-ray diffraction (XRD, X’Pert PRO, PNAlytical, Dutch) with Cu Kα radiation. The morphology of VMQ/Fe3O4@MWCNT/Ag@NWF foams, Ag@NWF and NWF was investigated by a Quanta 250 scanning electron microscope (SEM). The distribution of fillers was characterized using X-ray energy dispersive spectroscopy (EDS) on the basis of SEM observation. The magnetic properties were analysed by using a 7407 vibrating sample magnetometer (VSM). The electrical conductivities of composite foams were measured by a four-point probes resistivity measurement system (RTS-9), and each sample was tested three times and the average of the results was taken. The EMI shielding performance was tested with an Agilent N5230 vector network analyzer according to ASTM ES7-83.1,24–26 The total SE (SET), absorbed SE (SEA), reflected SE (SER), reflection coefficient (R), transmission coefficient (T) and absorption coefficient (A) were computed through the measured S-parameters (S11 and S21) over the X-band and 12–18 GHz. (the detailed calculations are shown in eqn (S1)–(S6) of the ESI†).5,41,44–463. Results and discussion
3.1 Characterization of Fe3O4@MWCNTs and Ag@NWF
The morphology of Fe3O4@MWCNTs was characterized by TEM as shown in Fig. 2a–d. It was found that the MWCNTs present a high specific surface area, which is beneficial for the loading of nanoparticles. Fe3O4 nanoparticles grow uniformly on the surface of MWCNTs, forming a three-dimensional nanoparticle/nanotube structure (Fig. 2b). The existence of Fe3O4 nanoparticles can prevent the agglomeration of MWCNTs. In addition, the Fe3O4 nanoparticles on the surface of MWCNTs increased obviously with the increasing amount of FeCl3·6H2O, FeCl2·4H2O and NH3·H2O in the synthesis of Fe3O4@MWCNTs (Fig. 2c–d). The structure of MWCNTs can remain intact after the adhesion of Fe3O4 nanoparticles, which makes a great contribution to the connection between nanoparticles in the silicone rubber matrix.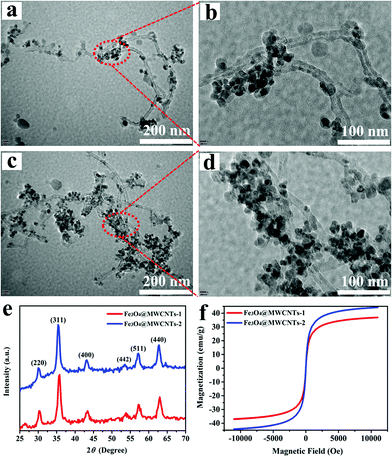 | ||
| Fig. 2 TEM images of (a and b) Fe3O4@MWCNTs-1 and (c and d) Fe3O4@MWCNTs-2. (e) XRD spectra and (f) magnetic properties of Fe3O4@MWCNTs. | ||
The XRD patterns of Fe3O4@MWCNTs are shown in Fig. 2e. The XRD characteristics indicate six diffraction peaks at 2θ = 30.4, 35.8, 43.4, 53.8, 57.2, and 62.9°, which are related to the characteristic (220), (311), (400), (422), (511) and (440) planes, according to the cubic spinal crystal structure of Fe3O4 (JCPDS file no. 19-1629). Combined with the XPS spectra of Fe3O4@MWCNTs (Fig. S1, ESI†), it can be proved that Fe3O4 nanoparticles have been successfully synthesized. Fig. 2f displays the magnetic properties of Fe3O4@MWCNTs and Fe3O4 at room temperature. As shown in the figure, Fe3O4@MWCNT nanoparticles present a typical S-shape hysteresis loop like that of Fe3O4, which indicates that they already possess ferromagnetic properties after Fe3O4 is anchored. Moreover, the saturation magnetization of Fe3O4@MWCNTs-2 can be increased to 44.2 emu g−1 by increasing the mass ratio of Fe3O4 to MWCNT. Current reports have shown that magnetic properties play an important role in absorbing EM waves.38–40 Such high magnetization of Fe3O4@MWCNTs can strengthen the absorption of EM waves through magnetic loss.
Fig. 3a–c show the SEM images of Ag@NWF and NWF. It can be found that the NWF consists of numerous single fibers forming a porous structure. The pure NWF fibers exhibited a smooth surface. Nevertheless, the surface of Ag@NWF became rough after electroless plating. The SEM results (Fig. 3c) show that a dense silver coating was deposited on the surface of NWF. Fig. 3d shows the Ag mapping image of Ag@NWF corresponding to Fig. 3b, which demonstrates the deposition of silver nanoparticles on the surface of NWF. In order to further confirm the chemical composition of NWF, Fig. 3e presents the XRD patterns of Ag@NWF and pure NWF. The XRD characteristics of Ag@NWF indicate five diffraction peaks at 2θ = 38.4, 44.6, 64.6, 77.6 and 81.8°, which are related to the characteristic (111), (200), (220), (311) and (222) planes, according to the face-centered cubic crystal of silver (JCPDS Card No. 04-0783). The above results indicate that silver nanocrystals were successfully synthesized on the surface of NWF.
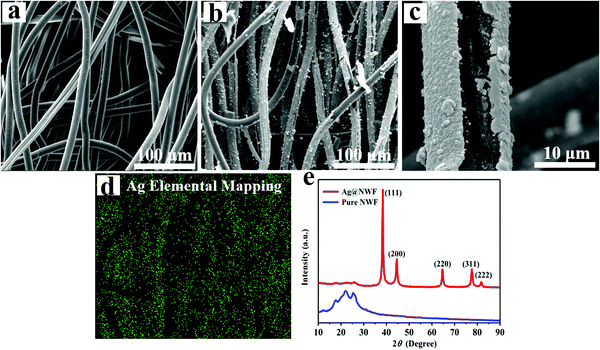 | ||
| Fig. 3 SEM images of (a) NWF and (b and c) Ag@NWF, (d) Ag EDS elemental mapping of Ag@NWF, and (e) XRD patterns of Ag@NWF and pure NWF. | ||
3.2 Microstructure of composite foams
Fig. 4a and b show the cross-sectional morphology of the VMQ/Fe3O4@MWCNT/Ag@NWF composite foams, which presents a layered structure (Fig. 4b). It can be seen that Fe3O4@MWCNT nanoparticles disperse uniformly in the silicone rubber matrix without obvious agglomeration as seen from the high magnification SEM image (Fig. 4c), which can effectively enhance the absorption of EM waves by magnetic loss. Further characterization of Fe and Ag EDS elemental mappings confirms that the upper layer was the VMQ/Fe3O4@MWCNT foam and the bottom layer was Ag@NWF (Fig. 4d and e). As shown in Fig. 4d, the porous VMQ/Fe3O4@MWCNT foam on the upper layer makes a great contribution to lighten the weight of the overall composite foam. A composite foam with a density as low as 0.18 g cm−3 can be obtained. Meanwhile, plenty of silver particles gathered on the bottom layer of the composite foam. The effective overlap of these silver particles on the surface of NWF (Fig. 3b and c) could endow the composite foams with excellent conductivity and outstanding EMI SE owing to the special braided structure of NWF and the ultra-high conductivity of silver.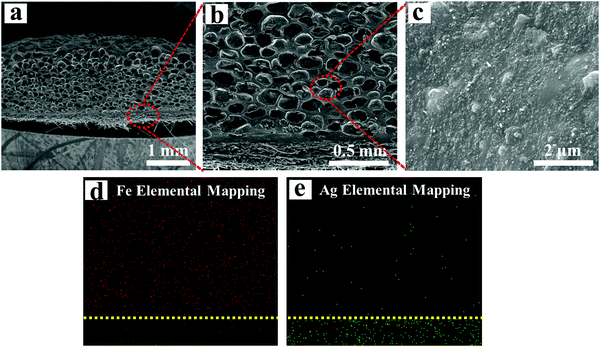 | ||
| Fig. 4 (a–c) SEM images, (d) Fe and (e) Ag EDS elemental mapping of VMQ/Fe3O4@MWCNT/Ag@NWF composite foams at a thickness of 2.0 mm. | ||
3.3 Electric properties of composite foams
It is well acknowledged that there is a close relationship between conductivity and EMI shielding performance. An excellent conductivity is the prerequisite for materials to obtain ideal EMI SE. Fig. 5 displays the conductivity of the upper and bottom surfaces of the VMQ/Fe3O4@MWCNT/Ag@NWF foam at a thickness of 2.0 mm. It can be seen that the bottom surface exhibits an outstanding conductivity of 9.01 × 10⁴ S m−1, which is 8 orders of magnitude higher than the conductivity of the upper surface. The composite foam can even be used as a conductor to light up the bulb because of its super high electrical conductivity (Fig. S2a, ESI†). This result can be explained by the structure observed by SEM, which is due to the excellent conductivity and efficient lapping of silver particles. The bottom surface of the high conductivity Ag@NWF ensures efficient EMI SE of the composite foams while the upper surface shows a conductivity of only 7.79 × 10⁻⁴ S m−1, which results in a smaller impedance mismatch between the foam and the air thus reducing the reflection of the EM waves. This layered conductive structure is favourable to obtain an outstanding EMI shielding performance.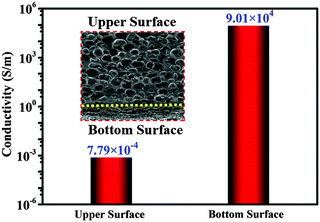 | ||
| Fig. 5 Comparison of electrical conductivity between the upper and bottom surfaces of VMQ/Fe3O4@MWCNT/Ag@NWF foams. | ||
3.4 EMI shielding performance of the composite foams
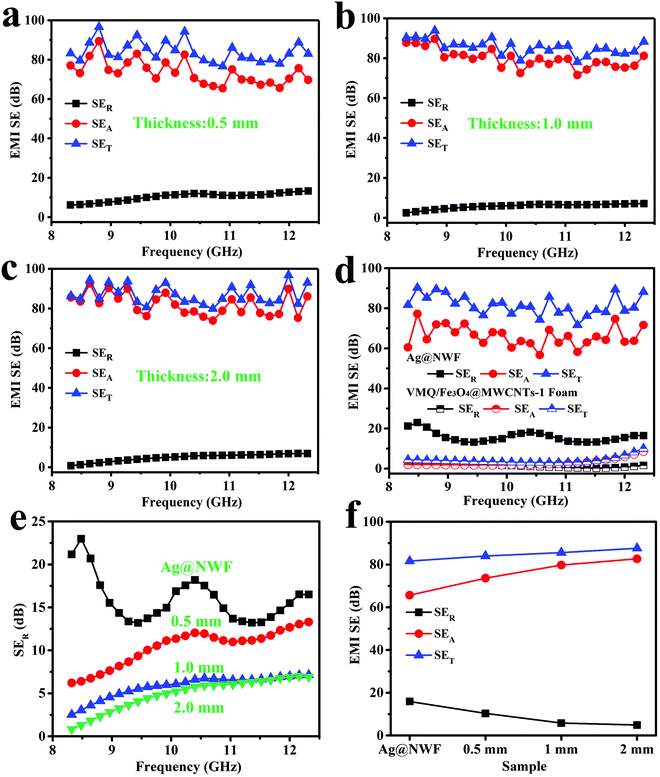
The EMI SE of the VMQ/Fe3O4@MWCNT/Ag@NWF composite foams in the X-band is exhibited in Fig. 6. Apparently, the composite foams display excellent EMI shielding performance with various thicknesses. The SET of all the composite foams can exceed 80 dB, which means that more than 99.999999% EM waves are shielded. This shielding value far exceeds the requirements for commercial applications (20 dB). Moreover, the specific EMI SE of the foam can be up to 483.3 dB cm3 g−1. The contribution of the SEA of all samples is much higher than that of the SER in the X-band (Fig. 6a and c). Meanwhile, the SET of the VMQ/Fe3O4@MWCNT foam is far less than that of the pure Ag@NWF (Fig. 6d), indicating that the SET of the VMQ/Fe3O4@MWCNT/Ag@NWF foam is mainly provided by Ag@NWF. As shown in Fig. 6e and f, although the VMQ/Fe3O4@MWCNT foam has little contribution to SET, the SER of the composite foam obviously reduced with the increase of VMQ/Fe3O4@MWCNT foam's thickness. The proportion of SEA in SET increased to 94.4% at a thickness of 2.0 mm. The above results show that Ag@NWF can show favorable EMI SE (Fig. 5), while VMQ/Fe3O4@MWCNT foam can effectively increase the SEA and reduce the SER. This result is mainly attributed to the effective lapping of Ag particles on the surface of NWF, which enhanced the conductive path and improved the efficiency of charge transport. In this way, the conduction loss is increased and a great EMI SE can be achieved. In addition, the polarization relaxation formed by the defect dipoles and functional groups of Fe3O4@MWCNTs can transform the EM energy into heat energy in an alternate EM field, resulting in huge polarization loss, thus attenuating the EM waves and enhancing the SEA of the composite foam.47,48In order to fully explore the effect of thickness on the reflective properties of the composite foam, Fig. 7a and b display the SER of the VMQ/Fe3O4@MWCNT/Ag@NWF foams with different thicknesses over the frequency range of 2–18 GHz. The SER of the composite foams significantly reduced with the increase of foam thickness in the whole band. Moreover, the SER presents a minimum peak value with various foam thicknesses. The frequency of the EM wave corresponding to the minimum reflection peak of the composite foam can be called the characteristic frequency. The peak position varies with the thickness of the foam, and the characteristic frequency shifted to high frequency with the increase of foam thickness. The minimum SER value of VMQ/Fe3O4@MWCNTs-2/Ag@NWF foams (Foam-2) is smaller than that of VMQ/Fe3O4@MWCNTs-1/Ag@NWF (Foam-1) at the characteristic frequency (Fig. 7c), which is due to the higher content of Fe3O4 in the matrix, and thus shows more magnetic loss and enhances the absorption of EM waves. It is worth noting that the Foam-2 exhibits an average EMI SE of 85.4 dB and a low SER of 3.7 dB with a thickness of 2 mm (Fig. 7d). More importantly, the SER of the Foam-2 is only 0.1 dB at 8.00 GHz. This EMI SE exceeds that of most of the EMI shielding materials, while the SER values are much lower than theirs. The above results illustrate an outstanding EMI SE and a low reflection of the VMQ/Fe3O4@MWCNT/Ag@NWF foams, which indicates that the composite foam has great application prospects in areas requiring both high EMI SE and low reflectivity.
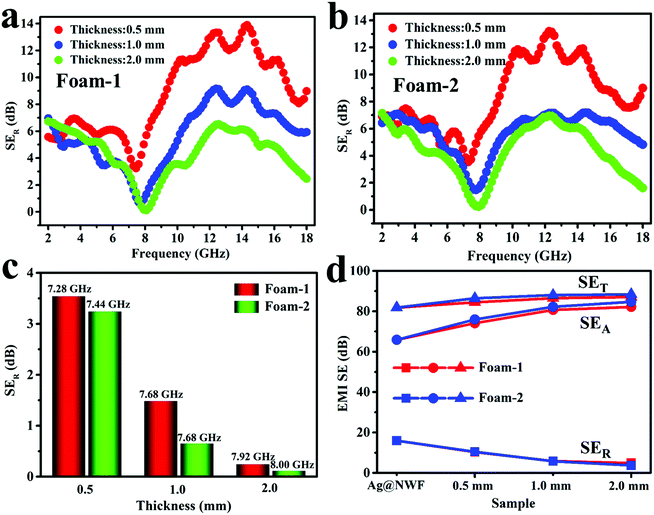 | ||
| Fig. 7 SER against the 2–18 GHz range for (a) Foam-1 and (b) Foam-2. (c) Minimum reflection peak and (d) average SER, SEA and SET of the VMQ/Fe3O4@MWCNT/Ag@NWF foams and Ag@NWF. | ||
By calculating the S parameters, the R, A and T values of the composite foams were obtained, which can represent the ratio of reflection, absorption and transmission of EM waves. Fig. 8 exhibits the R, A and T values of the composite foams and Ag@NWF in the X-band and at 2–18 GHz. The thickness of Ag@NWF in the composite foam is the same. Compared with pure Ag@NWF, the R values of the foam decreased significantly in the X-band because of the increasing thickness of the VMQ/Fe3O4@MWCNT foam (Fig. 8a and c). For example, the average R value of pure Ag@NWF was 0.971 in the X-band, indicating that 97.1% of EM waves were reflected after EM waves encounter Ag@NWF, which results in a large number of secondary EM wave pollution. However, the average R value of Foam-2 is 0.541 at a thickness of 2.0 mm, indicating that only 54.1% of the EM waves were reflected. The reflected EM waves of the composite foam decreased by 43% compared with those of the pure Ag@NWF. The VMQ/Fe3O4@MWCNT/Ag@NWF foam exhibits an EMI SE of over 80 dB, while still maintaining such low reflection efficiency. As shown in Fig. 8b and d, similar results can also be observed in the 2–18 GHz range. The R value of the foam decreases significantly with the increase of thickness (Fig. 8f). The VMQ/Fe3O4@MWCNT foam plays an important role in reducing the reflected EM waves of the composite foams. This result can be attributed to the following two reasons. First, the impedance mismatch between the VMQ/Fe3O4@MWCNT foam and air is much smaller than that of high conductivity Ag@NWF and air, because of its low electrical conductivity (Fig. 5). Consequently, a great quantity of EM waves can enter the interior of the foams and are dissipated, and relatively small amounts of EM waves were reflected when EM waves propagate to the samples. On the other hand, EM waves can be consumed by magnetic Fe3O4@MWCNT nanoparticles and transformed into heat energy through eddy current loss, hysteresis loss and residual loss. Once the thickness of the composite foam increases, the transmission distance of the EM waves is gradually extended, and more EM waves can be absorbed. In this way, reflected EM waves were greatly reduced.
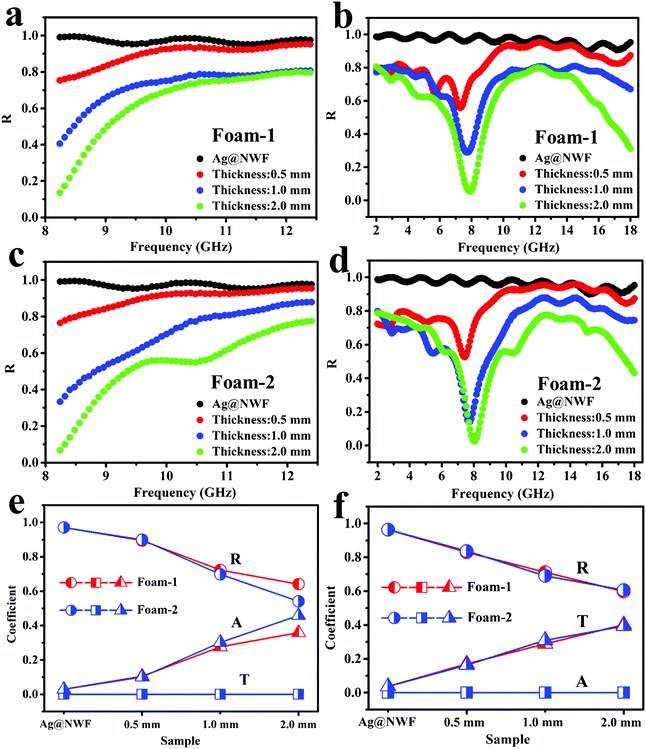 | ||
| Fig. 8 R value of (a and b) Foam-1 and (c and d) Foam-2 in the X-band at 2–18 GHz. Comparison of R, A and T values for VMQ/Fe3O4@MWCNT/Ag@NWF foams and Ag@NWF in the (e) X-band (f) and 2–18 GHz. | ||
In addition, a minimum peak value of the R value can be found in 2–18 GHz, which varies with the thickness of the composite foam. As can be seen from Fig. 8d, the R value of Foam-2 is 0.026 when the frequency of the EM wave is 8.00 GHz, and R + A + T = 1 (eqn (S3) of the ESI†). Therefore, the composite foam exhibits a reflection ratio of only 2.6%, while the absorption and transmission ratios are 97.4% and 6.26 × 10⁻⁷% respectively at 8.00 GHz. This result may be due to the destructive interference induced by the incident and reflected EM waves, which significantly consumes the energy of the reflected EM waves at the interface between Ag@NWF and the VMQ/Fe3O4@MWCNT foam (Fig. 10). Once the thickness of the VMQ/Fe3O4@MWCNT foam changed, the distance between the incident EM waves and Ag@NWF changes. Thus, the wavelength corresponding to the interference of these two EM waves is changed, resulting in a change of the characteristic frequency.
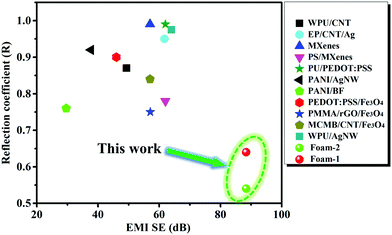
Fig. 9 exhibits the EMI SE and the R value of this work and other EMI shielding materials reported in the recent literature.14,16,17,31,42,49–54 For traditional EMI shielding materials, outstanding conductivity is the prerequisite for achieving excellent EMI SE. However, this will inevitably lead to a huge impedance mismatch between materials and air, and give rise to a lot of reflected EM waves. Generally, the R values of materials are often greater than 0.9 when their EMI SE is higher than 60 dB, which means that the reflection of these materials to EM waves exceeds 90%. In this work, the VMQ/Fe3O4@MWCNT/Ag@NWF composite foams with a layered structure not only achieve the goal of high EMI SE, but also realize the requirement of low reflection. The average EMI SE of the composite foam is as high as ∼90 dB with a density of 0.38 g cm−3 at a thickness of 2.0 mm. The average R value of the composite foam is only 0.54 in the X-band. Furthermore, the R value of the foam is extremely low (0.026) at 8.00 GHz. This high EMI SE and low reflection performance are mainly attributed to the layered structure design which combines the absorbing layer of the VMQ/Fe3O4@MWCNT foam and the highly conductive layer of Ag@NWF. This study provides a new strategy for the preparation of lightweight EMI shielding composites with low reflection and ultra-high EMI SE.
Fig. 10 illustrates the mechanism of EM wave dissipation in the composite foams. It can be seen from the diagram that there are a large number of pores and magnetic Fe3O4@MWCNT nanoparticles in the VMQ matrix, and the VMQ/Fe3O4@MWCNT foam shows a lower electrical conductivity because of the poor electrical properties of magnetic nanoparticles (Fig. 5). Thus, the huge impedance mismatch between the composite foams and air will be avoided. In this way, the incident EM waves are easier to enter the foam and the reflected EM waves on the foam surface will be significantly reduced. Then, the EM waves will be absorbed and converted into heat through the dipole polarization and interface polarization caused by Fe3O4@MWCNT nanoparticles. In addition, multiple reflection of EM waves on the bubble walls will further enhance the absorption of EM waves. As the EM waves continue to propagate, they will be reflected by the highly conductive silver layer, which shows strong conduction loss due to the extremely high conductivity and fine electronic transmission. Only a very small amount of EM waves can penetrate the composite foams.55 Finally, the reflected EM waves pass through the VMQ/Fe3O4@MWCNT foam again and are consumed, and the remaining EM waves return to the air. In the whole process, the EM waves undergo the procedure of “absorption–reflection–reabsorption” in the composite foam, which effectively enhances the absorption of the EM waves. Moreover, the destructive interference of the incident and reflected EM waves will consume the energy of the reflected EM waves at the interface, thus further reducing the final reflected EM waves and creating a low reflection peak.56 Not only excellent EMI SE can be achieved, but also secondary EM wave pollution can be effectively weakened through this layered structure composed of an absorbing layer and a highly conductive layer.
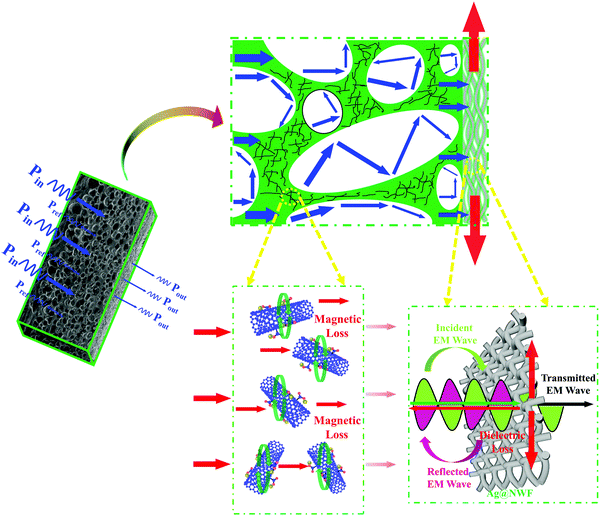 | ||
| Fig. 10 A schematic illustration of microwave dissipation in the VMQ/Fe3O4@MWCNT/Ag@NWF composite foams. | ||
4. Conclusions
In summary, lightweight and flexible VMQ/Fe3O4@MWCNT/Ag@NWF composite foams with ultra-high EMI SE and adjustable low reflection characteristics were first produced. The upper layer of the VMQ/Fe3O4@MWCNT foam shows outstanding EM wave absorption performance owing to the magnetic loss of Fe3O4@MWCNT nanoparticles and the internal multiple absorption of the porous structure, while excellent EMI SE can be achieved by the bottom high conductivity Ag@NWF due to its strong dielectric loss. The composite foam exhibits an outstanding EMI SE of 88.4 dB and an R value of only 0.54 at a thickness of 2.0 mm. Meanwhile, the R value can be as low as 0.026 at 8.00 GHz. This layered structure design, which combines an absorbing layer and a reflecting layer, provides a significant idea for designing lightweight, high efficiency and low reflection EM shielding materials.List of acronyms
| NWF | Non-woven fabric |
| Ag@NWF | Silver-coated non-woven fabric |
| VMQ | Methyl vinyl silicon rubber |
| Fe3O4@MWCNTs | Ferriferrous oxide@multi-walled carbon nanotubes |
| Fe3O4@MWCNT-1 | The ratio of MWCNTs to Fe3O4 is about 2![[thin space (1/6-em)]](https://www.rsc.org/images/entities/char_2009.gif) : :![[thin space (1/6-em)]](https://www.rsc.org/images/entities/char_2009.gif) 1 1 |
| Fe3O4@MWCNT-2 | The ratio of MWCNTs to Fe3O4 is about 2![[thin space (1/6-em)]](https://www.rsc.org/images/entities/char_2009.gif) : :![[thin space (1/6-em)]](https://www.rsc.org/images/entities/char_2009.gif) 5 5 |
| Foam-1 | VMQ/Fe3O4@MWCNTs-1/Ag@NWF |
| Foam-2 | VMQ/Fe3O4@MWCNTs-2/Ag@NWF |
Conflicts of interest
There are no conflicts to declare.Acknowledgements
The authors gratefully acknowledge the financial support from the National Natural Science Foundation of China (No. 51773138) and the Fundamental Research Funds for the Central Universities.References
- H. B. Zhang, W. G. Zheng, Q. Yan, Z. G. Jiang and Z. Z. Yu, Carbon, 2012, 50, 5117–5125 CrossRef CAS.
- M. S. Cao, J. Yang, W. L. Song, D. Q. Zhang, B. Wen, H. B. Jin, Z. L. Hou and J. Yuan, ACS Appl. Mater. Interfaces, 2012, 4, 6948–6955 Search PubMed.
- Y. Chen, H. B. Zhang, Y. Yang, M. Wang, A. Cao and Z. Z. Yu, Adv. Funct. Mater., 2016, 26, 447–455 CrossRef CAS.
- X. H. Li, X. Li, K. N. Liao, P. Min, T. Liu, A. Dasari and Z. Z. Yu, ACS Appl. Mater. Interfaces, 2016, 8, 33230–33239 CrossRef CAS.
- D. X. Yan, H. Pang, B. Li, R. Vajtai, L. Xu, P. G. Ren, J. H. Wang and Z. M. Li, Adv. Funct. Mater., 2015, 25, 559–566 CrossRef CAS.
- C. B. Liang, H. Qiu, Y. Y. Han, H. B. Gu, P. Song, L. Wang, J. Kong, D. P. Cao and J. W. Gu, J. Mater. Chem. C, 2019, 7, 2725–2733 RSC.
- B. Shen, W. T. Zhai and W. G. Zheng, Adv. Funct. Mater., 2014, 24, 4542–4548 CrossRef CAS.
- B. Wen, M. S. Cao, M. M. Lu, W. Q. Cao, H. L. Shi, J. Liu, X. X. Wang and J. Yuan, Adv. Mater., 2014, 26, 3484–3489 CrossRef CAS.
- C. Hu, Z. Y. Li, Y. L. Wang, J. C. Gao, K. Dai, G. Q. Zheng, C. T. Liu, C. Y. Shen, H. X. Song and Z. H. Guo, J. Mater. Chem. C, 2017, 5, 2318–2328 RSC.
- J. Ling, W. T. Zhai, W. W. Feng, B. Shen, J. F. Zhang and W. G. Zheng, ACS Appl. Mater. Interfaces, 2013, 5, 2677–2684 CrossRef CAS.
- M. Arjmand, T. Apperley, M. Okoniewski and U. Sundararaj, Carbon, 2012, 50, 5126–5134 CrossRef CAS.
- B. Shen, W. T. Zhai, M. M. Tao, J. Q. Ling and W. G. Zheng, ACS Appl. Mater. Interfaces, 2013, 5, 11383–11391 CrossRef CAS.
- H. B. Zhang, Q. Yan, W. G. Zheng, Z. X. He and Z. Z. Yu, ACS Appl. Mater. Interfaces, 2011, 3, 918–924 CrossRef CAS.
- Z. H. Zeng, M. J. Chen, H. Jin, W. W. Li, X. Xue, L. C. Zhou, Y. M. Pei, H. Zhang and Z. Zhang, Carbon, 2016, 96, 768–777 CrossRef CAS.
- J. Liu, H. B. Zhang, R. Sun, Y. Liu, Z. Liu, A. Zhou and Z. Z. Yu, Adv. Mater., 2017, 29, 1702367 CrossRef PubMed.
- R. Sun, H. B. Zhang, J. Liu, X. Xie, R. Yang, Y. Li, S. Hong and Z. Z. Yu, Adv. Funct. Mater., 2017, 27, 1702807 CrossRef.
- F. Shahzad, M. Alhabeb, C. B. Hatter, B. Anasori, S. M. Hong, C. M. Koo and Y. Gogotsi, Science, 2016, 353, 1137–1140 CrossRef CAS.
- J. M. Yang, X. Liao, J. S. Li, G. J. He, Y. Zhang, W. Y. Tang, G. Wang and G. X. Li, Compos. Sci. Technol., 2019, 181, 107670 CrossRef CAS.
- E. B. Huang, X. Liao, C. X. Zhao, C. B. Park, Q. Yang and G. X. Li, ACS Sustainable Chem. Eng., 2016, 4, 1810–1818 CrossRef CAS.
- J. Chen, X. Liao, W. Xiao, J. M. Yang, Q. Y. Jiang and G. X. Li, ACS Sustainable Chem. Eng., 2019, 7, 9904–9915 CrossRef CAS.
- Q. Y. Jiang, X. Liao, J. S. Li, J. Chen, G. Wang, J. Yi, Q. Yang and G. X. Li, Composites, Part A, 2019, 123, 310–319 CrossRef CAS.
- J. S. Li, X. Liao, Q. Yang and G. X. Li, Ind. Eng. Chem. Res., 2017, 56, 11111–11124 CrossRef CAS.
- E. B. Huang, X. Liao, Y. C. He, B. He, Q. Yang and G. X. Li, Polymer, 2017, 118, 163–172 CrossRef CAS.
- Y. Yang, M. C. Gupta, K. L. Dudley and R. W. Lawrence, Nano Lett., 2005, 5, 2131–2134 CrossRef CAS PubMed.
- D. X. Yan, P. G. Ren, H. Pang, Q. Fu, M. B. Yang and Z. M. Li, J. Mater. Chem., 2012, 22, 18772–18774 RSC.
- C. H. Cui, D. X. Yan, H. Pang, L. C. Jia, X. Xu, S. Yang, J. Z. Xu and Z. M. Li, Chem. Eng. J., 2017, 323, 29–36 CrossRef CAS.
- Z. Chen, C. Xu, C. Ma, W. Ren and H. M. Cheng, Adv. Mater., 2013, 25, 1296–1300 CrossRef CAS.
- A. Ameli, M. Nofar, S. Wang and C. B. Park, ACS Appl. Mater. Interfaces, 2014, 6, 11091–11100 CrossRef CAS.
- S. Kashi, R. K. Gupta, T. Baum, N. Kao and S. N. Bhattacharya, Mater. Des., 2016, 95, 119–126 CrossRef CAS.
- Y. Xu, Y. Li, W. Hua, A. M. Zhang and J. J. Bao, ACS Appl. Mater. Interfaces, 2016, 8, 24131–24142 CrossRef CAS.
- X. Li, Y. Li, T. T. Guan, F. C. Xu and J. Q. Sun, ACS Appl. Mater. Interfaces, 2018, 10, 12042–12050 CrossRef CAS.
- W. Y. Tang, X. Liao, Y. Zhang, J. S. Li, G. Wang and G. X. Li, J. Phys. Chem. C, 2019, 123, 26947–26956 CrossRef CAS.
- W. Y. Tang, J. W. Bai, X. Liao, W. Xiao, Y. Luo, Q. Yang and G. X. Li, J. Supercrit. Fluids, 2018, 141, 78–87 CrossRef CAS.
- J. W. Bai, X. Liao, E. B. Huang, Y. Luo, Q. Yang and G. X. Li, Mater. Des., 2017, 133, 288–298 CrossRef CAS.
- X. Liao, H. Xu, S. J. Li, C. J. Zhou, G. X. Li and C. B. Park, RSC Adv., 2015, 5, 106981 RSC.
- O. Balci, E. O. Polat, N. Kakenov and C. Kocabas, Nat. Commun., 2015, 6, 6628 CrossRef CAS.
- M. S. Cao, W. L. Song, Z. L. Hou, B. Wen and J. Yuan, Carbon, 2010, 48, 788–796 CrossRef CAS.
- Y. D. Xu, Y. Q. Yang, D. Y. Yan, H. J. Duan, G. Z. Zhao and Y. Q. Liu, ACS Appl. Mater. Interfaces, 2018, 10, 19143–19152 CrossRef CAS.
- H. M. Zhang, G. C. Zhang, J. T. Li, X. Fan, Z. X. Jing and X. T. Shi, Composites, Part A, 2017, 100, 128–138 CrossRef CAS.
- H. X. Zhu, Y. Q. Yang, A. Sheng, H. J. Duan, G. Z. Zhao and Y. Q. Liu, Appl. Surf. Sci., 2018, 469, 1–9 CrossRef.
- T. W. Lee, S. E. Lee and Y. G. Jeong, ACS Appl. Mater. Interfaces, 2016, 8, 13123–13132 CrossRef CAS.
- F. Fang, Y. Q. Li, H. M. Xiao, N. Hu and S. Y. Fu, J. Mater. Chem. C, 2016, 4, 4193–4203 RSC.
- Z. H. Zeng, M. J. Chen, Y. M. Pei, S. I. Seyed Shahabadi, B. Y. Che, P. Y. Wang and X. H. Lu, ACS Appl. Mater. Interfaces, 2019, 9, 32211–32219 CrossRef PubMed.
- H. Liu, M. Y. Dong, W. J. Huang, J. C. Gao, K. Dai, J. Guo, G. Q. Zheng, C. T. Liu, C. Y. Shen and Z. H. Guo, J. Mater. Chem. C, 2017, 5, 73–83 RSC.
- M. S. Cao, C. Han, X. X. Wang, M. Zhang, Y. L. Zhang, J. C. Shu, H. J. Yang, X. Y. Fang and J. Yuan, J. Mater. Chem. C, 2018, 6, 4586–4602 RSC.
- J. M. Yang, Y. Q. Yang, H. J. Duan, G. Z. Zhao and Y. Q. Liu, J. Mater. Sci.: Mater. Electron., 2017, 28, 5925–5930 CrossRef CAS.
- M. S. Cao, X. X. Wang, W. Q. Cao, X. Y. Fang, B. Wen and J. Yuan, Small, 2018, 14, 1800987 CrossRef.
- W. L. Song, M. S. Cao, Z. L. Hou, X. Y. Fang, X. L. Shi and J. Yuan, Appl. Phys. Lett., 2009, 94, 233110 CrossRef.
- Z. H. Zeng, H. Jin, M. J. Chen, W. W. Li, L. C. Zhou and Z. Zhang, Adv. Funct. Mater., 2016, 26, 303–310 CrossRef CAS.
- P. Li, D. Du, L. Guo, Y. Guo and J. Ouyang, J. Mater. Chem. C, 2016, 4, 6525–6532 RSC.
- Y. Zhang, M. Qiu, Y. Yu, B. Wen and L. Cheng, ACS Appl. Mater. Interfaces, 2017, 9, 809–818 CrossRef CAS.
- Y. Xia, J. Fang, P. Li, B. Zhang, H. Yao, J. Chen, J. Ding and J. Ouyang, ACS Appl. Mater. Interfaces, 2017, 9, 19001–19010 CrossRef CAS.
- F. Sharif, M. Arjmand, A. A. Moud, S. Sundararaj and E. P. L. Roberts, ACS Appl. Mater. Interfaces, 2017, 9, 14171–14179 CrossRef CAS.
- A. Chaudhary, R. Kumar, S. Teotia, S. K. Dhawan, S. R. Dhakate and S. Kumari, J. Mater. Chem. C, 2017, 5, 322–332 RSC.
- P. He, M. S. Cao, J. C. Shu, Y. Z. Cai, X. X. Wang, Q. L. Zhao and J. Yuan, ACS Appl. Mater. Interfaces, 2019, 11, 12535–12543 CrossRef CAS.
- W. L. Song, C. Gong, H. Li, X. D. Cheng, M. Chen, X. Yuan, H. Chen, Y. Yang and D. Fang, ACS Appl. Mater. Interfaces, 2017, 9, 36119–36129 CrossRef CAS PubMed.
Footnote |
| † Electronic supplementary information (ESI) available. See DOI: 10.1039/c9tc05152j |
| This journal is © The Royal Society of Chemistry 2020 |

