Effect of nanoporosity on the electromagnetic wave absorption performance in a biomass-templated Fe3O4/C composite: a small-angle neutron scattering study†
Yuan
Fang
 a,
Weidong
Xue
 *a,
Rui
Zhao
*a,
Shengxiang
Bao
a,
Wenjian
Wang
a,
Liangwei
Sun
b,
Liang
Chen
b,
Guangai
Sun
b and
Bo
Chen
b
*a,
Rui
Zhao
*a,
Shengxiang
Bao
a,
Wenjian
Wang
a,
Liangwei
Sun
b,
Liang
Chen
b,
Guangai
Sun
b and
Bo
Chen
b
aSchool of Materials and Energy, University of Electronic Science and Technology of China, No. 4, Section 2, North Jianshe Road, Chengdu, 610054, P. R. China. E-mail: xuewd@uestc.edu.cn; ruizhao@uestc.edu.cn
bKey Laboratory of Neutron Physics and Institute of Nuclear Physics and Chemistry (INPC), China Academy of Engineering Physics (CAEP), No. 64, Mianshan Road, Mianyang, 621999, P. R. China
First published on 18th November 2019
Abstract
A hierarchically porous Fe3O4/C composite was synthesized with a biomass-templated carbothermal strategy and tested as an electromagnetic (EM) wave absorber. The hollow fibrous structure of the cotton template was well retained in the product. The sample synthesized at 600 °C exhibited a wide effective absorption bandwidth of 4.4 GHz at a small thickness of 2.0 mm. Nitrogen sorption and small-angle neutron scattering revealed the evolution of a nanoporous structure as the synthesis temperature increased, based on which a correlation between nanoporosity and EM wave absorption performance was established. This study illustrated that porosity should be kept at a moderate level for highly efficient EM wave absorption.
1. Introduction
The wide use of electromagnetic (EM) waves in communication, industry and daily life is causing serious problems such as interference between electronic devices and harm to human health. EM wave absorption materials provide an efficient way to address this issue. Carbonaceous materials have been utilized as dielectric absorbers, while the magnetic loss mechanism can be found in magnetic metals and ferrites.1–5 Magnetite (Fe3O4) is a ferrite with a spinel structure, which is of great interest for EM wave absorption applications because of its ferrimagnetic nature, low toxicity, and earth abundance. Nanocomposites of Fe3O4 and carbon with a variety of structures have shown a synergetic effect on the two components, which promotes EM wave absorption. The conventional synthesis strategy for Fe3O4/C composites is a hydrothermal or solvothermal method, with different forms of carbon added, including reduced graphene oxide, carbon nanotubes, carbon fibers, as well as pyrolyzed resorcinol–formaldehyde resin.6–11 However, these methods involve multiple complicated steps and use environmentally unfriendly chemicals, such as ethylene glycol during solvothermal synthesis, and acids in Hummers’ method.The electromagnetic wave absorbing performance is highly dependent on the microscopic structures and morphologies of materials. Growing attention has been paid to porous materials recently, since porosity not only reduces the absorber density, but also allows multiple reflections of EM waves within the absorber.12,13 Porosity has been introduced into EM wave absorbers by various means, such as pyrolysis of a metal–organic framework, aerogel synthesis using supercritical drying, solvothermal methods and acid etching.14–18 Benefiting from its hierarchical porosity and low cost, biomass is widely used as the template to synthesize porous materials. Ferrite absorbers including Li0.35Zn0.3Fe2.35O4 and BaFe12O19/CeFe2O4 have been prepared by infiltrating the cotton template with a precursor followed by calcination in air, which inherit the hollow fibrous structure of the template.19,20 Recently, carbothermal reduction has been combined with biomass templating, which is capable of producing a porous nanocomposite of carbon and a magnetic phase in one simple pyrolysis step.21–23
Though much work has been done to create porosity in EM wave absorbers, there is still a deficiency of understanding about how such nanopores affect EM wave absorption performance. In this work, a nanocomposite of Fe3O4 and carbon was synthesized via a cotton-templated carbothermal approach and used to investigate the role which nanoporosity played in EM wave absorption. The synthesis was simple and environmentally friendly, which avoids the use of organic reagents and activation with corrosive KOH. The effect of synthesis temperature on the nanoporous structure was probed by nitrogen sorption analysis and further confirmed with small-angle neutron scattering (SANS), which is a powerful tool to obtain the structural information of nanoporous systems.24–26 Compared with small-angle X-ray scattering (SAXS), SANS data originate from nuclei rather than electrons, showing superior contrast for material systems with light elements and delocalized electrons, namely, carbon.27 Combining conventional nitrogen sorption analysis with SANS, information about the surface area, micropore volume, and pore size distribution of the cotton-templated Fe3O4/C composite was acquired, while the effect of porosity on the EM wave absorption performance was discussed.
2. Experimental
2.1. Materials
Ferric nitrate nonahydrate (Fe(NO3)3·9H2O) was purchased from Chron Chemicals. Medical degreased cotton was obtained from Mishawa medical supplies. All materials were used without further purification.2.2. Synthesis of a cotton-templated Fe3O4/C nanocomposite
The precursor solution was made by dissolving 20 g of Fe(NO3)3·9H2O in 80 mL of deionized (DI) water. 8 g of medical degreased cotton was then infiltrated with the solution above for 1 h and dried at 80 °C in the atmosphere overnight. The infiltrated cotton was then pyrolyzed in argon at a certain temperature for 5 h with a ramp rate of 2 °C min−1. The product was denoted as FC-XXX, in which F represents Fe3O4, C represents cotton, and XXX is the pyrolysis temperature (°C). For comparison, a sample containing no Fe3O4 was produced by pyrolyzing cotton solely at 600 °C, and denoted as C-600.2.3. Characterization
Powder X-ray diffraction (XRD) data were collected within a 2θ range of 5–80° using a Rigaku RINT 2400 with Cu Kα radiation. The microscopic morphology of samples was imaged on a JSM 6490LV scanning electron microscope (SEM). Thermogravimetric analysis (TGA) data were obtained on a METTLER LF/1100 with a ramp rate of 10 °C min−1 to 800 °C in air. Raman spectra were measured using a Renishaw inVia confocal Raman microscope with a laser wavelength of 532 nm. The magnetic hysteresis loops were measured with a BHL-525 vibrating sample magnetometer (VSM). The conductivities were measured with a CN61M/KDY-4 four-probe resistivity meter. Samples were mixed with poly(vinylidene fluoride) in a weight ratio of 90![[thin space (1/6-em)]](https://www.rsc.org/images/entities/char_2009.gif) :
:![[thin space (1/6-em)]](https://www.rsc.org/images/entities/char_2009.gif) 10 and cast onto a glass substrate. Nitrogen adsorption–desorption isotherms were collected with a Quantachrome Autosorb-iQ instrument. The specific surface area was calculated using Brunauer–Emmett–Teller (BET) theory, while the micropore volume was acquired through the t-plot method, and the pore size distribution was obtained using the Non-Local Density Functional Theory (NLDFT) calculation model of N2 at 77 K on carbon (slit pore, equilibrium model). Small-angle neutron scattering (SANS) was conducted in the China Mianyang Research Reactor (CMRR), on a SANS-Suanni spectrometer.28,29 Three different setups with sample-to-detector distances (L2) of 1.1 m, 4.25 m and 10.5 m for a wavelength (λ) of 0.53 nm were used, resulting in a q range of 0.05–3.0 nm−1, in which q is the magnitude of the scattering vector defined by q = (4π/λ)sin(θ/2), where θ is the scattering angle. The current wavelength spread (Δλ/λ) is about 18%. The obtained two-dimensional (2D) scattering data were reduced to one-dimensional (1D) absolute intensity profiles in the BerSANS environment.30
10 and cast onto a glass substrate. Nitrogen adsorption–desorption isotherms were collected with a Quantachrome Autosorb-iQ instrument. The specific surface area was calculated using Brunauer–Emmett–Teller (BET) theory, while the micropore volume was acquired through the t-plot method, and the pore size distribution was obtained using the Non-Local Density Functional Theory (NLDFT) calculation model of N2 at 77 K on carbon (slit pore, equilibrium model). Small-angle neutron scattering (SANS) was conducted in the China Mianyang Research Reactor (CMRR), on a SANS-Suanni spectrometer.28,29 Three different setups with sample-to-detector distances (L2) of 1.1 m, 4.25 m and 10.5 m for a wavelength (λ) of 0.53 nm were used, resulting in a q range of 0.05–3.0 nm−1, in which q is the magnitude of the scattering vector defined by q = (4π/λ)sin(θ/2), where θ is the scattering angle. The current wavelength spread (Δλ/λ) is about 18%. The obtained two-dimensional (2D) scattering data were reduced to one-dimensional (1D) absolute intensity profiles in the BerSANS environment.30
2.4. Wave absorption tests
The samples were blended with paraffin wax with a mass content of 50% at 90 °C and pressed into a toroid with an inner diameter of 3.04 mm and an outer diameter of 7 mm. The relative complex permittivity (εr = ε′ − jε′′) and permeability (μr = μ′ − jμ′′) were measured using an Agilent E5063 vector network analyzer in the frequency range of 1–18 GHz. The reflection loss (RL) values were calculated according to the following equations.8where Z0 is the impedance of free space, Zin is the input characteristic impedance, d represents the thickness of the absorber, c stands for the speed of light in a vacuum, and f is the frequency of the EM wave.
3. Results and discussion
3.1. Structure, morphology, and composition
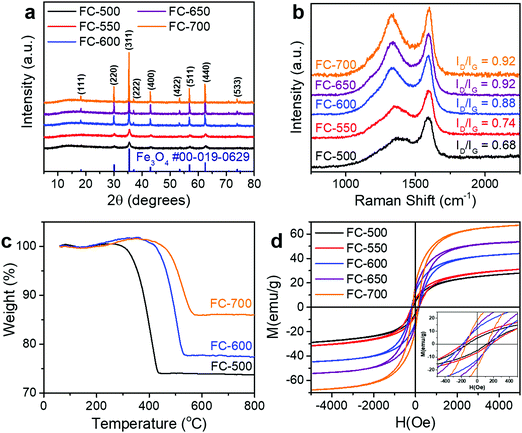
During the synthesis, the iron precursor solution was first adsorbed onto the cellulose fibers of cotton, followed by drying and pyrolysis. As the sample was heated, the cellulose fibers underwent carbonization, while the iron precursor was carbothermally reduced to magnetite (Fe3O4). For the whole synthesis temperature range investigated (500–700 °C), the only crystalline phase in the products was magnetite, while no metallic iron or other iron oxides (FeO and Fe2O3) was detected, as evidenced by XRD patterns (Fig. 1a). Peaks appearing at ca. 18.3°, 30.1°, 35.4°, 37.1°, 43.1°, 53.4°, 56.9°, 62.5°, and 74.0° correspond to the (111), (220), (311), (222), (400), (422), (511), (440), and (533) diffraction of spinel Fe3O4 (PDF #00-019-0629). It is worth noting that as the synthesis temperature increased, the width of diffraction peaks decreased, suggesting grain growth at higher temperatures. The peak of graphite was not observed, indicating that carbon in the samples has poor crystallinity.The Raman spectra of these samples (Fig. 1b) displayed two peaks, namely, the D band centered at ca. 1350 cm−1 and the G band at ca. 1590 cm−1. As the synthesis temperature increased, the intensity ratio of these two bands (ID/IG) increased. According to the three-stage model proposed by Ferrari and Robertson, such an increase of the ID/IG value indicated the conversion from amorphous carbon to nanocrystalline graphite.31 The rising graphitization degree was further confirmed with higher conductivity (Table 1). Although the conductivities of FC-500 and FC-550 were below the range of the instrument, for the other three samples, the conductivity increased monotonically with the pyrolysis temperature.
| Sample | Conductivity (S cm−1) | Saturation magnetization (emu g−1) | Coercivity (Oe) | BET surface area (m2 g−1) | Micropore volume (cm3 g−1) |
|---|---|---|---|---|---|
| a The conductivities of FC-500 and FC-550 were below the range of the instrument. | |||||
| FC-500 | N/Aa | 28.3 | 121 | 193.7 | 0.050 |
| FC-550 | N/Aa | 31.3 | 169 | ||
| FC-600 | 1.1 × 10⁻³ | 44.3 | 179 | 173.8 | 0.045 |
| FC-650 | 6.6 × 10⁻³ | 54.0 | 152 | ||
| FC-700 | 1.1 × 10⁻² | 67.4 | 132 | 159.7 | 0.036 |
To determine the composition of samples, TGA was conducted in air (Fig. 1c). A slight increase of weight below 400 °C was ascribed to the oxidation of Fe3O4 to Fe2O3, while the combustion of carbon, which contributed to the major weight loss, occurred at different temperatures for various samples. The mass content of Fe3O4 in the composite can be calculated by
The magnetic hysteresis loops of FC-XXX samples (Fig. 1d) were typical for soft magnetic materials, and the results are summarized in Table 1. The saturation magnetization (Ms) increased from FC-500 to FC-700, as a result of the increasing Fe3O4 content as determined by TGA. It is worth noting that the coercivity (Hc) showed a maximum value at FC-600, which is attributed to the nanosize effect of Fe3O4 particles. As evidenced previously by XRD and SEM results, grain growth of Fe3O4 occurred as the synthesis temperature increased, which first made it difficult for thermal energy to rotate the spins, and further enabled the motion of domain walls.32,33
Fig. 2 shows the microscopic morphology of FC-XXX samples. Cotton has a hollow fibrous structure with a diameter of ca. 10 μm, which was well retained at relatively low pyrolysis temperatures (500–600 °C) (Fig. 2a and b). Small particles of Fe3O4 ranging from tens to a few hundreds of nanometers were found embedded on the fiber walls at a higher magnification (Fig. 2c). As the pyrolysis temperature reached 700 °C, Fe3O4 tended to grow and aggregate into micron-sized particles, while the fiber walls partially fractured with the formation of pits (Fig. 2d). Such grain growth was in consistence with the line sharpening of XRD patterns.
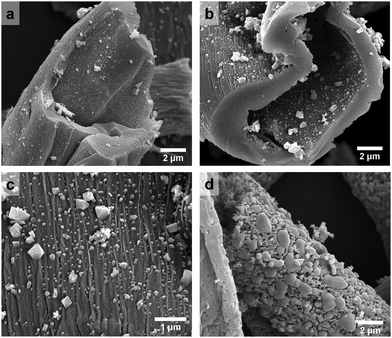 | ||
| Fig. 2 SEM images of (a) FC-500, (b) FC-600, and (c) FC-600 at a higher magnification, and (d) FC-700. | ||
3.2. Pore size distribution
As shown in Fig. 3a, FC-XXX samples exhibited type IV isotherms and type H4 hysteresis loops in nitrogen sorption tests, which is typical for micro–mesoporous carbon.34 A previous report showed that the carbonization process of cotton cellulose produces mainly micropores, while mesopores are generated when carbon is partially oxidized.35 In the current study, such partial oxidation was accomplished with ferric nitrate. The BET surface areas as well as micropore volumes of FC-XXX samples were negatively correlated with the pyrolysis temperature (Table 1), which indicated the shrinkage and collapse of nanopores as the synthesis temperature increased and the organic matter further carbonized. The pore size distribution function, f(W), was obtained by fitting the experimental isotherm, N(P/P0), with the following equation:34in which N(P/P0, W) is the isotherm for a single pore of width W calculated with NLDFT.
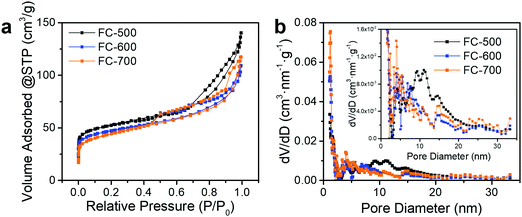 | ||
| Fig. 3 (a) Nitrogen adsorption and desorption isotherms and (b) pore size distribution obtained with the DFT method of FC-XXX samples. The inset is the magnified pore size distribution. | ||
The pore size distribution (Fig. 3b) for FC-500 showed a broad peak centered at ca. 10 nm, which became insignificant for FC-600 and FC-700, indicating the degradation of relatively large pores upon heating to 600 °C and above.
Fig. 4a shows the SANS patterns of FC-XXX samples. The micron-sized pores in the center of the fiber, as observed in the SEM images before, were beyond the q-range of this SANS measurement. The background intensity in the high-q zone increased as the pyrolysis temperature decreased, which arose from the higher hydrogen content in the samples with a lower graphitization degree, since protium has a large incoherent scattering length. A hump was observed within the q-range of 0.1–1 nm−1 for FC-500, which was not significant for the other two samples, suggesting the scattering from the nanopores at the corresponding scale. The Polydisperse Sphere (PDSP) model was used to fit the data over the measured q range.25 The scattering intensity per unit volume I(q) is given by the following equation:36
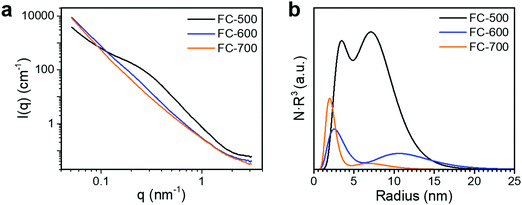 | ||
| Fig. 4 (a) SANS patterns and (b) pore size distribution calculated from the SANS patterns of FC-XXX samples. | ||
The average pore volume is given by:
The form factor for a sphere is:
A bimodal size distribution of pores was obtained (Fig. 4b). The relative volume ratio of larger (>5 nm) to smaller (<5 nm) pores decreased substantially as the synthesis temperature increased. Such a trend agreed well with nitrogen sorption results, confirming the decrease of larger pores at higher synthesis temperatures.
3.3. EM wave absorption
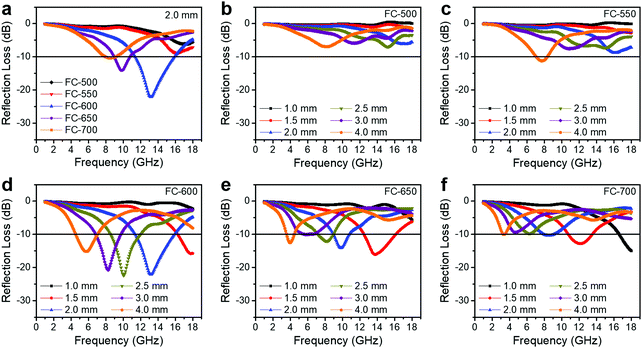
An ideal EM wave absorber should meet the criteria of small thickness, light weight, broadband and strong absorption. The RL values of the FC-XXX series are shown in Fig. 5. The effective absorption bandwidth (EAB) is defined as the width of the frequency range where more than 90% of the incident EM energy is absorbed, corresponding to RL < −10 dB. Generally, FC-600 exhibited the best EM wave absorbing performance, with a maximum loss (RLmax) of −22.1 dB and an EAB of 4.4 GHz (11.4–15.8 GHz) at a thickness of 2.0 mm. Table 2 shows that the EM wave absorption performance of our material is on par with the recently published Fe3O4/carbon composite absorbers, considering the thickness, maximum loss and effective absorption bandwidth comprehensively. For FC-650, the best performance appeared at an even smaller thickness of 1.5 mm with an EAB of 3.6 GHz (12.5–16.1 GHz). However, as the synthesis temperature increased or decreased further, the EM wave absorption performance degraded significantly.| Absorber | Thickness (mm) | RLmax (dB) | Bandwidtha (GHz) | Ref. |
|---|---|---|---|---|
| a Bandwidth is defined as the width of the frequency range of effective (<−10 dB) absorption at one single absorber thickness, rather than integrated thickness. | ||||
| Fe3O4/graphene | 3.5 | −45 | 3.2 | 37 |
| rGO/MCNTs/Fe3O4 hydrogels | 2.0 | −36 | 3.6 | 38 |
| SA-Ni-(Fe3O4/CNTs)-X | 2.0 | −32 | 3.2 | 39 |
| Dopamine-derived cavities/Fe3O4/SA-derived carbon | 1.5 | −50.8 | 3.5 | 40 |
| Fe3O4/reduced graphene oxide | 3.0 | −22.7 | 3.13 | 41 |
| Fe3O4/carbon micro-flowers | 5.0 | −37.6 | 4.16 | 42 |
| Nanoporous Fe3O4@carbon | 3.0 | −65.5 | 4.5 | 43 |
| Porous carbon/Fe3O4@Fe | 2.0 | −49.6 | 5.0 | 23 |
| Fe3O4/carbon foams | 2.2 | −47.3 | 5.68 | 44 |
| Biomass-templated Fe3O4/C | 2.0 | −22.1 | 4.4 | This work |
The EM wave absorption performance of materials is determined by the EM parameters (ε′, ε′′, μ′, μ′′). The real parts of permittivity (ε′) and permeability (μ′) stand for the storage of electric and magnetic energy, while on the other hand, the imaginary parts (ε′′ and μ′′) represent energy attenuation. The dielectric and magnetic tangent loss factors (tan![[thin space (1/6-em)]](https://www.rsc.org/images/entities/char_2009.gif) δε and tan
δε and tan![[thin space (1/6-em)]](https://www.rsc.org/images/entities/char_2009.gif) δμ) are defined as follows:
δμ) are defined as follows:
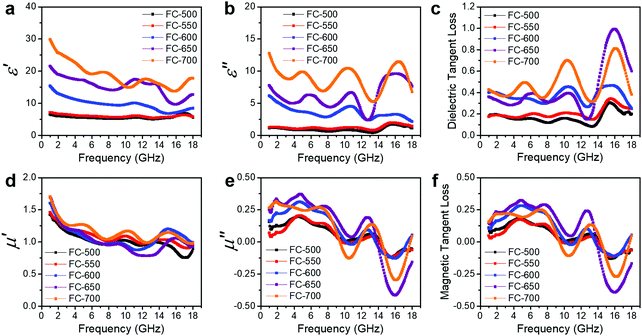
Generally, higher synthesis temperatures led to larger real and imaginary dielectric constants (Fig. 6a–c). According to Debye theory, a dipolar relaxation can be expressed as
These equations indicate that in an ideal case, the real and imaginary parts of permittivity should be plotted as semicircles, known as Cole–Cole plots.45 For samples synthesized at 500 °C or 550 °C (Fig. S2a and b, ESI†), the Cole–Cole plots had irregular shapes, suggesting that Debye polarization was not obvious in these samples. At 600 °C or higher (Fig. S2c–e, ESI†), although still highly distorted, some semicircles appeared, each of which represents one Debye relaxation process. Such an enhancement of dielectric properties at higher synthesis temperatures resulted from a higher graphitization degree and conductivity, as well as the shrinkage and collapse of pores, which will be discussed later. The distorted shape of these semicircles indicated that some other dielectric polarization mechanisms existed in our samples, such as the Maxwell–Wagner–Sillars effect, which occurs at the interfaces of different phases.13
Unlike dielectric properties, the synthesis temperature did not have a significant influence on the permeability and magnetic loss factor (Fig. 6d–f). All samples had a μ′ value of ca. 1.5 at 1 GHz, which reduced to ca. 1 at 18 GHz. It is worth noting that the μ′′ values became negative at ca. 14–18 GHz, while ε′′ values exhibited peaks in the same frequency range. These values originated from the good conductivities of samples. The induced eddy current shielded the material from EM wave penetration, and magnetic energy was radiated out.46–50 As evidence, the negative imaginary permeability values were more significant in the samples with higher conductivities (FC-650 and FC-700).
Among the possible magnetic loss mechanisms, hysteresis loss is negligible at a weak field, while domain wall resonance usually appears in the MHz range.51 The eddy current loss was evaluated by the following equation
It is necessary to understand which structural factors and mechanisms contribute to the outstanding EM absorption performance of the cotton-templated Fe3O4/C composite. First, it is reported that nanoporosity with a high surface area can trap microwave.16 However, our study showed that such porosity has a double-edged effect on EM absorption performance. According to the Maxwell–Garnett equation, the effective permittivity (εeff) of a porous material can be expressed as:
Secondly, conductivity also has a significant effect on EM wave absorption. Higher conductivity generally leads to larger permittivity.16 In our case, the conductivity was positively correlated with pyrolysis temperature. Thus, a moderate temperature (600 °C) gave the optimal permittivity for EM wave absorption applications.
To have a better knowledge of the role Fe3O4 played in our material, cotton was directly carbonized at 600 °C as a reference (denoted as C-600). C-600 had a hollow fibrous structure similar to FC-600, but without the presence of Fe3O4 particles (Fig. S1f, ESI†). Compared with FC-600, C-600 exhibited significantly lower ε′ and ε′′ values (Fig. S3a, ESI†) and poorer EM wave absorption performance (Fig. S3b, ESI†). The higher dielectric constant for Fe3O4 incorporated samples could be attributed to the electron exchange between Fe2+ and Fe3+ in Fe3O4 as well as the presence of Fe3O4/C interfaces where polarization could occur. Magnetite also introduced a magnetic loss mechanism to the composite and improved impedance matching.
Besides, the geometrical effect also contributed to EM wave absorption in our sample. When the absorber thickness satisfied the quarter-wavelength condition, the EM waves reflected at the absorber/air and absorber/backing interfaces are out of phase by π and cancel with each other:
in which μr and εr are the moduli of complex relative permeability and permittivity respectively. Finally, in the free space, the wavelength is given by:
| λ0 = c/f |
In the equation above, c is the speed of light in a vacuum, and f is the frequency. Putting these three equations together gives:
Taking n as 1, the corresponding absorber thickness for the FC-600 sample was plotted against frequency in Fig. S4 (ESI†). According to the calculation based on the geometrical effect above, the maximum loss frequencies at thicknesses of 2.0, 2.5, 3.0, and 4.0 mm were 12.7, 9.5, 7.9, and 5.4 GHz, which agreed well with the corresponding frequencies where RLmax occurred in Fig. 5d for FC-600 (13.2, 10.1, 8.2, and 5.7 GHz). A clear trend was found that the maximum loss peak shifted to lower frequencies with the increasing thickness. The slight difference in frequency might be the result of other EM wave attenuation mechanisms.
4. Conclusions
A lightweight EM wave absorbing composite of magnetite and carbon with hierarchical porosity was synthesized. The shrinkage of nanopores as the increase of synthesis temperature was revealed with SANS and nitrogen sorption. Surplus pore volume made the composite transparent to microwave, and deficiency of pores led to poor impedance matching, while on the other hand, moderate porosity contributed to the outstanding EM wave absorption performance of our Fe3O4/C composite. This paper establishes such a relationship between porosity and EM wave absorption, which will serve as a helpful reference in designing porous EM wave absorbers.Conflicts of interest
There are no conflicts to declare.Acknowledgements
This work was financially supported by the Sichuan Science and Technology Program (Grant No. 2018G20130 and 2018GZ0543).References
- Z. Fan, G. Luo, Z. Zhang, L. Zhou and F. Wei, Mater. Sci. Eng., B, 2006, 132, 85–89 CrossRef CAS.
- Y. Zhang, Y. Huang, T. Zhang, H. Chang, P. Xiao, H. Chen, Z. Huang and Y. Chen, Adv. Mater., 2015, 27, 2049–2053 CrossRef CAS.
- G. Sun, B. Dong, M. Cao, B. Wei and C. Hu, Chem. Mater., 2011, 23, 1587–1593 CrossRef CAS.
- C. Dong, X. Wang, P. Zhou, T. Liu, J. Xie and L. Deng, J. Magn. Magn. Mater., 2014, 354, 340–344 CrossRef CAS.
- R.-B. Yang and W.-F. Liang, J. Appl. Phys., 2011, 109, 07A311 CrossRef.
- D. Sun, Q. Zou, G. Qian, C. Sun, W. Jiang and F. Li, Acta Mater., 2013, 61, 5829–5834 CrossRef CAS.
- J. Qiu and T. Qiu, Carbon, 2015, 81, 20–28 CrossRef CAS.
- Y. Du, W. Liu, R. Qiang, Y. Wang, X. Han, J. Ma and P. Xu, ACS Appl. Mater. Interfaces, 2014, 6, 12997–13006 CrossRef CAS PubMed.
- E. Ma, J. Li, N. Zhao, E. Liu, C. He and C. Shi, Mater. Lett., 2013, 91, 209–212 CrossRef CAS.
- N. Li, G.-W. Huang, Y.-Q. Li, H.-M. Xiao, Q.-P. Feng, N. Hu and S.-Y. Fu, ACS Appl. Mater. Interfaces, 2017, 9, 2973–2983 CrossRef CAS PubMed.
- C. Zou, Y. Yao, N. Wei, Y. Gong, W. Fu, M. Wang, L. Jiang, X. Liao, G. Yin, Z. Huang and X. Chen, Composites, Part B, 2015, 77, 209–214 CrossRef CAS.
- B. Zhao, B. Fan, Y. Xu, G. Shao, X. Wang, W. Zhao and R. Zhang, ACS Appl. Mater. Interfaces, 2015, 7, 26217–26225 CrossRef CAS.
- B. Quan, X. Liang, G. Ji, Y. Zhang, G. Xu and Y. Du, ACS Appl. Mater. Interfaces, 2017, 9, 38814–38823 CrossRef CAS PubMed.
- Y. Lü, Y. Wang, H. Li, Y. Lin, Z. Jiang, Z. Xie, Q. Kuang and L. Zheng, ACS Appl. Mater. Interfaces, 2015, 7, 13604–13611 CrossRef.
- H.-B. Zhao, J.-B. Cheng and Y.-Z. Wang, J. Alloys Compd., 2018, 736, 71–79 CrossRef CAS.
- H.-B. Zhao, Z.-B. Fu, H.-B. Chen, M.-L. Zhong and C.-Y. Wang, ACS Appl. Mater. Interfaces, 2016, 8, 1468–1477 CrossRef CAS.
- X. Li, D. Du, C. Wang, H. Wang and Z. Xu, J. Mater. Chem. C, 2018, 6, 558–567 RSC.
- A. Wang, W. Wang, C. Long, W. Li, J. Guan, H. Gu and G. Xu, J. Mater. Chem. C, 2014, 2, 3769–3776 RSC.
- B.-F. Zhao, P. Ma, J.-M. Zhao, D.-A. Li and X. Yang, Ceram. Int., 2013, 39, 2317–2322 CrossRef CAS.
- X. Huang, J. Zhang, Z. Liu, T. Sang, B. Song, H. Zhu and C. Wong, J. Alloys Compd., 2015, 648, 1072–1075 CrossRef CAS.
- Y. Wei, H. Liu, S. Liu, M. Zhang, Y. Shi, J. Zhang, L. Zhang and C. Gong, Compos. Commun., 2018, 9, 70–75 CrossRef.
- H. Zhao, Y. Cheng, H. Lv, G. Ji and Y. Du, Carbon, 2019, 142, 245–253 CrossRef CAS.
- H. Wang, F. Meng, J. Li, T. Li, Z. Chen, H. Luo and Z. Zhou, ACS Sustainable Chem. Eng., 2018, 6, 11801–11810 CrossRef CAS.
- L. He, S. M. Chathoth, Y. B. Melnichenko, V. Presser, J. McDonough and Y. Gogotsi, Microporous Mesoporous Mater., 2012, 149, 46–54 CrossRef CAS.
- M. Sun, B. Yu, Q. Hu, Y. Zhang, B. Li, R. Yang, Y. B. Melnichenko and G. Cheng, Int. J. Coal Geol., 2017, 171, 61–68 CrossRef CAS.
- W.-S. Chiang, E. Fratini, P. Baglioni, D. Georgi, J.-H. Chen and Y. Liu, J. Phys. Chem. C, 2016, 120, 4354–4363 CrossRef CAS.
- J. M. Calo and P. J. Hall, Carbon, 2004, 42, 1299–1304 CrossRef CAS.
- M. Peng, L. Sun, L. Chen, G. Sun, B. Chen, C. Xie, Q. Xia, G. Yan, Q. Tian, C. Huang, B. Pang, Y. Zhang, Y. Wang, Y. Liu, W. Kang and J. Gong, Nucl. Instrum. Methods Phys. Res., Sect. A, 2016, 810, 63–67 CrossRef CAS.
- L. Chen, L. Sun, Y. Wang, Y. Wang, L. Zou, G. Yan, J. Chen, Q. Tian, M. Peng, J. Gong, B. Chen, G. Sun and D. Liu, J. Appl. Crystallogr., 2016, 49, 1388–1393 CrossRef CAS.
- U. Keiderling, Appl. Phys. A: Mater. Sci. Process., 2002, 74, s1455–s1457 CrossRef CAS.
- A. C. Ferrari and J. Robertson, Phys. Rev. B: Condens. Matter Mater. Phys., 2000, 61, 14095–14107 CrossRef CAS.
- D. L. Leslie-Pelecky and R. D. Rieke, Chem. Mater., 1996, 8, 1770–1783 CrossRef CAS.
- J. Ge, Y. Hu, M. Biasini, W. P. Beyermann and Y. Yin, Angew. Chem., Int. Ed., 2007, 46, 4342–4345 CrossRef CAS.
- M. Thommes, K. Kaneko, V. Neimark Alexander, P. Olivier James, F. Rodriguez-Reinoso, J. Rouquerol and S. W. Sing Kenneth, Pure Appl. Chem., 2015, 87, 1051–1069 CAS.
- L. Chen, T. Ji, L. Mu and J. Zhu, Carbon, 2017, 111, 839–848 CrossRef CAS.
- A. P. Radlinski, M. Mastalerz, A. L. Hinde, M. Hainbuchner, H. Rauch, M. Baron, J. S. Lin, L. Fan and P. Thiyagarajan, Int. J. Coal Geol., 2004, 59, 245–271 CrossRef CAS.
- L. Zhu, X. Zeng, X. Li, B. Yang and R. Yu, J. Magn. Magn. Mater., 2017, 426, 114–120 CrossRef CAS.
- H. Zhang, M. Hong, P. Chen, A. Xie and Y. Shen, J. Alloys Compd., 2016, 665, 381–387 CrossRef CAS.
- N. Zhou, Q. An, Z. Xiao, S. Zhai and Z. Shi, ACS Sustainable Chem. Eng., 2017, 5, 5394–5407 CrossRef CAS.
- L. Guo, S.-S. Gao, Q.-D. An, Z.-Y. Xiao, S.-R. Zhai, D.-J. Yang and L. Cui, RSC Adv., 2019, 9, 766–780 RSC.
- J. Wu, Z. Ye, W. Liu, Z. Liu and J. Chen, Ceram. Int., 2017, 43, 13146–13153 CrossRef CAS.
- C. Li, Y. Ge, X. Jiang, J. Sui, Z. Zhang and L. Yu, J. Alloys Compd., 2019, 798, 414–423 CrossRef CAS.
- Z. Xiang, Y. Song, J. Xiong, Z. Pan, X. Wang, L. Liu, R. Liu, H. Yang and W. Lu, Carbon, 2019, 142, 20–31 CrossRef CAS.
- X. Zhou, C. Zhang, M. Zhang, A. Feng, S. Qu, Y. Zhang, X. Liu, Z. Jia and G. Wu, Composites, Part A, 2019, 127, 105627 CrossRef CAS.
- B. Quan, X. Liang, G. Ji, Y. Cheng, W. Liu, J. Ma, Y. Zhang, D. Li and G. Xu, J. Alloys Compd., 2017, 728, 1065–1075 CrossRef CAS.
- M. Zhang, Z. Jiang, X. Lv, X. Zhang, Y. Zhang, J. Zhang, L. Zhang and C. Gong, J. Phys. D: Appl. Phys., 2020, 53, 02LT01 CrossRef.
- M. Zhang, J. Zhang, X. Lv, L. Zhang, Y. Wei, S. Liu, Y. Shi and C. Gong, J. Mater. Sci.: Mater. Electron., 2018, 29, 5496–5500 CrossRef CAS.
- S. Guo, L. Wang and H. Wu, Adv. Powder Technol., 2015, 26, 1250–1255 CrossRef CAS.
- L. Deng and M. Han, Appl. Phys. Lett., 2007, 91, 023119 CrossRef.
- X.-L. Shi, M.-S. Cao, J. Yuan and X.-Y. Fang, Appl. Phys. Lett., 2009, 95, 163108 CrossRef.
- M. Wu, Y. D. Zhang, S. Hui, T. D. Xiao, S. Ge, W. A. Hines, J. I. Budnick and G. W. Taylor, Appl. Phys. Lett., 2002, 80, 4404–4406 CrossRef CAS.
- J. Zhu, S. Wei, N. Haldolaarachchige, D. P. Young and Z. Guo, J. Phys. Chem. C, 2011, 115, 15304–15310 CrossRef CAS.
- B. Lu, X. L. Dong, H. Huang, X. F. Zhang, X. G. Zhu, J. P. Lei and J. P. Sun, J. Magn. Magn. Mater., 2008, 320, 1106–1111 CrossRef CAS.
- G. Viau, F. Fiévet-Vincent, F. Fiévet, P. Toneguzzo, F. Ravel and O. Acher, J. Appl. Phys., 1997, 81, 2749–2754 CrossRef CAS.
- A. Aharoni, J. Appl. Phys., 1991, 69, 7762–7764 CrossRef.
- L. Olmedo, G. Chateau, C. Deleuze and J. L. Forveille, J. Appl. Phys., 1993, 73, 6992–6994 CrossRef CAS.
Footnote |
| † Electronic supplementary information (ESI) available: SEM images of FC-XXX at different synthesis temperatures and C-600. Cole–Cole plots and C0 values of FC-XXX samples. Real and imaginary parts of the dielectric constant and reflection loss at various thicknesses of C-600. The corresponding absorber thicknesses for FC-600 at different frequencies when EM wave is attenuated by the geometrical effect. See DOI: 10.1039/c9tc04569d |
| This journal is © The Royal Society of Chemistry 2020 |


