
Innate immune activation by conditioned medium of cancer cells following combined phototherapy with photosensitizer-loaded gold nanorods†
Malvin Wei Cherng
Kang
a,
Haiyan
Liu
abc and
James Chen Yong
Kah
 *ad
*ad
aNUS Graduate School for Integrative Sciences and Engineering, National University of Singapore, University Hall, Tan Chin Tuan Wing, Level 04, #04-02, 21 Lower Kent Ridge, Singapore 119077, Singapore. E-mail: biekahj@nus.edu.sg
bDeparment of Microbiology & Immunology, Yong Loo Lin School of Medicine, National University of Singapore, 5 Science Drive 2, Block MD4 Level 3, Singapore 117545, Singapore
cLife Sciences Institute Immunology Programme, National University of Singapore, 28 Medical Drive, Centre for Life Sciences, Level 3, Singapore 117456, Singapore
dDepartment of Biomedical Engineering, National University of Singapore, 4 Engineering Drive 3, Block E4, #04-08, Singapore 117583, Singapore
First published on 22nd October 2020
Abstract
Nanoparticle-based phototherapy has evolved to include immunotherapy as an effective treatment combination for cancers through inducing anti-cancer immune activation leading to downstream adaptive responses and immune protection. However, most cancer phototherapy studies that claimed anti-cancer immunogenic effects often included exogenous immunostimulants to potentiate immune responses and did not clearly establish their effects on immune cells. In this study, we showed that combined photodynamic (PDT) and photothermal therapy (PTT) using gold nanorods (NRs) loaded with the photosensitizer chlorin e6 (Ce6) on endogenously formed mouse serum (MS) protein coronas (i.e., NR-MS-Ce6) on EMT6 murine mammary carcinoma cells could potentiate the activation of both J774A.1 macrophages and DC2.4 dendritic cells. The activation of these innate immune cells by the conditioned media from cancer cells treated with combined PDT + PTT was cell-type and number dependent. While treated B16-OVA murine melanoma cells induced lower activation levels for both immune cell types compared to EMT6, they caused higher pro-inflammatory cytokine secretion levels. Our study suggests the importance of immunological investigations to complement any nanoparticle-based therapeutic interventions to better evaluate their efficacy. This could be achieved through a simple approach to screen for the first line of immune responses arising from these therapies prior to in vivo studies.
Introduction
The post-therapeutic effects of cancer phototherapy on the immune system leading to anti-tumor immunity is an emerging area of interest. Given that cancer treatment with either photodynamic therapy (PDT) or photothermal therapy (PTT) results in necrotic or apoptotic cell death,1–5 the release of tumor antigens and endogenous adjuvants such as damage-associated molecular patterns (DAMPs) and heat shock proteins (HSPs) could induce immunogenic cell death (ICD)4,6,7 to mount anti-cancer immune responses that enhance the phototherapeutic effect of PDT and PTT. The release of tumor antigens and endogenous adjuvants is recognized by innate immune cells such as macrophages and dendritic cells via pattern recognition receptors (PRRs) like toll-like receptors (TLRs) and scavenger receptors, leading to the direct activation of innate immune cells via the expression of MHC-antigen complexes, co-stimulatory molecules and secretion of cytokines.8 These events lead to ligand–receptor interactions with CD4+ and CD8+ T cells, which get activated and exert their cytotoxic effects towards tumor, depending on the proteome of the treated cancer cells.9,10The concept of PDT-induced anti-tumor immunity was first proposed by Nowis et al. and supported by others,2,9,11–14 where tumor ablation by reactive oxygen species (ROS) generated during PDT resulted in the generation of stress proteins and antigens that induced an acute inflammatory response. The inflammation attracted and activated leukocytes such as dendritic cells (DCs) and macrophages to subsequently activate downstream adaptive immunity for an enhanced anti-tumor immune response and immune memory generation.15–19
Early studies involving PDT-induced immune responses utilized small molecule photosensitizers (PSs), such as chlorin e6 (Ce6) and benzoporphyrin derivative (BPD), wherein systemic anti-tumor immune responses were demonstrated in vivo via the slowdown of contralateral tumor growth in two-tumor models or tumor re-challenge where tumor growth was rejected.20,21 However, such observations are often cancer cell and mouse-type dependent, and could be specific to the type and dose of PS used as well.12,22
Nanoparticles (NPs) have been incorporated into PDT regimens to promote the delivery of PSs to tumors, thereby improving PDT efficacy under lower dosage conditions.23–32 PDT-induced immunogenicity by NPs has been demonstrated in vivo by Yu et al., where PDT with photosensitizer-loaded graphene NPs on the primary tumor promoted tumor retardation in the distal flank through inducing maturation of DCs and elevation of serum IFN-γ levels.32 They also showed that PDT-treated 4T1 cells in vitro could serve as a material for a prophylactic vaccine to retard the growth of 4T1 tumors in immunocompetent mice in vivo. However, their study selected only necrotic 4T1 cells after PDT, which might not adequately capture the full spectrum of immunogenicity associated with PDT since other forms of cell death with immunogenic potential such as apoptosis could also occur1,2,4,5,33 but were not examined.
PTT could also induce immunogenicity through ablative necrosis of cancer cells.34–36 Sweeney et al. found an optimal temperature window of 63.3 to 66.4 °C to be important for increasing intracellular DAMP expressions such as HMGB1 and ATP to trigger ICD with Prussian blue NPs in vivo.37 Li et al. also demonstrated ICD with cancer cell membrane-coated natural melanin NPs36 based on the expression of calreticulin (a DAMP) in vivo as a marker of cancer ICD,36 although its ability to stimulate downstream innate and adaptive responses was not demonstrated. Apart from calreticulin, many other DAMPs could also contribute to immune responses.
The existing PDT or PTT studies are also often supplemented by immunostimulants, e.g., checkpoint blockade inhibitors and the toll-like receptor (TLR) agonist to elicit downstream innate and adaptive responses.30,38 These supplements suffer from pharmacokinetic drawbacks, such as potential off-target and non-specific inflammatory side effects.39,40 Checkpoint blockade therapy is also plagued by resistance mechanisms and immune-related adverse events that limit its applicability alongside phototherapy.39
While the ability of PDT and PTT to trigger anti-cancer immunogenicity has been widely demonstrated, many studies still lack clarity on how phototherapy-induced cell death activates the immune cells, particularly that of innate immunity, which serves as an important ‘bridge’ to generate adaptive responses. This is especially true for combined PDT and PTT (PDT + PTT), which offers greater phototherapeutic efficacy.30,38–40 It is not known if the greater cell killing efficacy with a lower drug dose afforded by the synergistic combination of PDT + PTT could potentiate a higher degree of innate immune activation in the absence of immunostimulants.
We have previously loaded the photosensitizer Ce6 on the endogenously formed protein coronas from mouse serum (MS) proteins around gold nanorods (NRs) to form NR-MS-Ce6 that enabled combined PDT + PTT by Ce6 and NRs, respectively, to completely ablate primary tumors in a nude mice model in vivo.31 We observed edema and acute inflammation one day post PDT + PTT, accompanied by rapid and complete tumor regression with good wound healing and no tumor regrowth up to 31 days post-treatment. Given the lack of adaptive immunity in nude mice, we therefore hypothesize that the combined PDT + PTT with NR-MS-Ce6 could induce immunogenic and inflammatory responses with a sufficient antigen loading to activate cells of innate immunity including macrophages and DCs to inhibit tumor re-growth through sufficient removal of tumor debris.
Therefore, we extend our previously published study to examine the level of innate immune activation of murine J774A.1 macrophages and DC2.4 DCs induced by the conditioned medium of murine mammary EMT6 cells following combined PDT + PTT with NR-MS-Ce6 in vitro in the absence of any adjuvant and immunostimulant (Fig. 1). We showed PDT and PTT-induced cell death leading to cancer cell-specific innate immune activation. Our study provided new insights on the exploitation of combined PDT + PTT to directly activate cells of innate immunity that could further mount a downstream immunological response without the need of any exogenous immunostimulants or adjuvants.
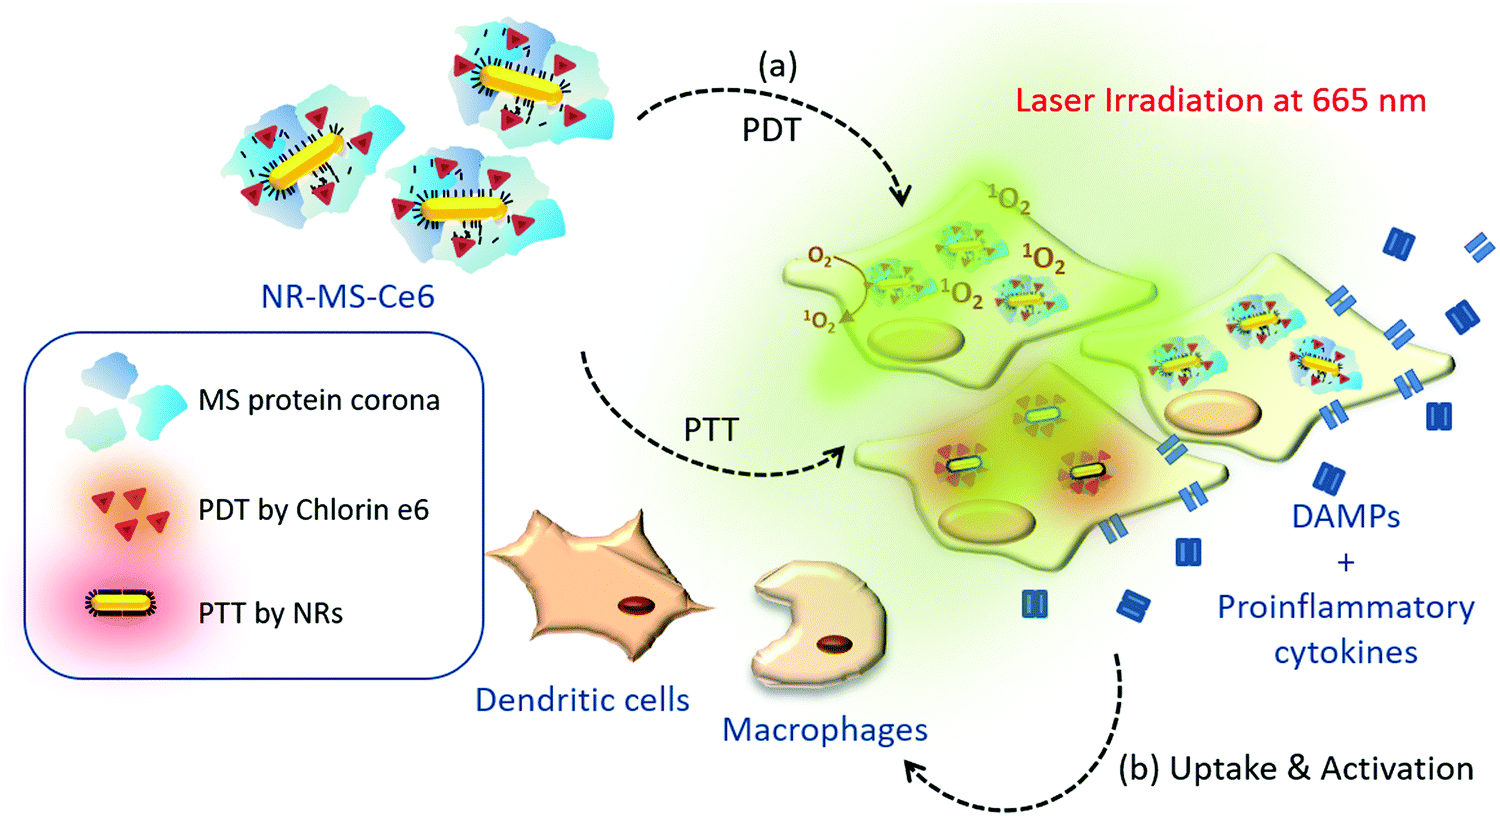 | ||
| Fig. 1 Schematic summary of our study aiming to examine the post-therapeutic immune activation of cells of innate immunity, including murine J774A.1 macrophages and DC2.4 dendritic cells following combined PDT + PTT with NR-MS-Ce6 on EMT6 murine mammary carcinoma cells and B16-OVA murine melanoma cells expressing ovalbumin. | ||
Material and methods
Materials
All chemicals used were purchased from Sigma-Aldrich Chemical Inc. unless mentioned specifically. Ultra-pure water (UP water) with a resistivity of 18.2 MΩ at 25 °C was used for all experiments.Synthesis of NR-CTAB
The synthesis of NRs passivated with a hexadecyltrimethylammonium bromide (CTAB) ligand (NR-CTAB) was based on our previously published protocol,31,41,42 which consisted of two phases: (1) preparation of the seed solution, followed by (2) NR growth in solution. In preparing the seed solution, 250 μL of 10 mM gold(III) chloride trihydrate (HAuCl4) was added to 9.75 mL of 100 mM CTAB, followed by the addition of 600 μL of ice-cold sodium borohydride. The mixture was stirred at 27 °C for 1 h to obtain a yellowish-brown seed solution of gold nanospheres. We subsequently grew the NRs from the gold nanosphere seed solution by adding 250 μL of 10 mM HAuCl4, 50 μL of 10 mM silver nitrate (AgNO3), 30 μL of 100 mM ascorbic acid (C6H8O6) and 6 μL of seed solution in sequence to 4.75 mL of 100 mM CTAB, with a single swirl performed at each addition step to ensure thorough mixing. The final solution was then left in the dark at 27 °C for 4 h to form NR-CTAB. Repeated centrifugal washing in UP water was performed twice in 1 mL tubes at ×4700g for 15 min to remove excess unreacted reagents before the NR-CTAB was stored at room temperature for further experiments.Loading of chlorin e6 (Ce6) in MS protein coronas formed on NRs
We dissolved the hydrophobic Ce6 photosensitizer (Frontier Scientific, U.S.) in a MS protein solution to form a clear dark green 2 mM Ce6 solution, which was further diluted in sodium phosphate buffer (10 mM PhB, pH 7.0) to a 1 mM Ce6 solution in MS (MS-Ce6). The spontaneous formation of MS protein coronas on NRs and simultaneous Ce6 loading on the MS coronas were achieved by adding 1 mL of 1 mM MS-Ce6 to a soft pellet obtained by centrifuging 0.5 nM NR-CTAB at ×4700g for 15 min according to our previously published protocol.31 The mixture was incubated for 20 h at 37 °C before the resulting NR-MS-Ce6 was purified by repeated centrifugation thrice at ×3600g for 15 min to remove excess MS and Ce6, before re-dispersion in 5 mM PhB buffer for subsequent experiments.Characterization of NR-MS-Ce6
The optical properties of NR-CTAB and NR-MS-Ce6 were characterized using UV-vis spectroscopy (MultiSkan™ GO, Thermo Scientific, USA). Their zeta potential (ζ) and hydrodynamic diameter (DH) were acquired using a Zetasizer (Nano ZS, Malvern, UK) at 25 °C, while their morphology was examined using transmission electron microscopy (TEM) (JEM-1220, JEOL Ltd, Japan). The concentration of NRs was determined from their UV-vis spectrum and known extinction coefficients.43The amount of Ce6 in NR-MS-Ce6 was determined by directly measuring the Ce6 fluorescence (λex/λem = 405/665 nm) in NR-MS-Ce6 and comparing it to calibrating standards of different Ce6 concentrations in a fixed concentration of 0.5 nM NR-CTAB (see the ESI,† Fig. S1). To account for the quenching of Ce6 by NRs, a separate Ce6 concentration calibration curve in the absence of NRs was obtained by diluting 1 mM Ce6 in MS with 5 mM PhB (Fig. S1, ESI†). From both Ce6 concentration calibration curves in the presence and absence of NRs, we determined the percentage of fluorescence quenching as shown in the formula below, which was used subsequently as a correction factor to quantify the Ce6 loading based on its fluorescence.

Cell culture
B16-OVA, EMT6 and DC2.4 cells (ATCC, USA) were cultured in RPMI-1640 medium (Gibco, U.S.) supplemented with 10% fetal bovine serum (FBS) (GE Healthcare, UK), 1% sodium pyruvate (Gibco, U.S.), 1% 1 M HEPES buffer (Gibco, USA), 1% MEM non-essential amino acids (Gibco, USA) and 100 U mL−1 penicillin–streptomycin (Gibco, USA) at 37 °C, 5% CO2 and 95% humidity. J774A.1 cells were cultured in 1× DMEM medium (Gibco, U.S.) with the same constituents as RPMI-1640 at 37 °C, 5% CO2 and 95% humidity.Cell uptake of NR-MS-Ce6
The cell uptake of NR-MS-Ce6 was examined using fluorescence and dark field microscopy, where EMT6 and B16-OVA cells were seeded at a density of ∼1 × 10⁵ cells per well on a clean circular coverslip placed in a 24-well plate and left for 24 h at 37 °C to allow for cell adhesion. The cells were then dosed with 0.5 nM NR-MS-Ce6 in serum-free medium for 6 h, and rinsed twice with PBS (Gibco, US) to remove excess NR-MS-Ce6 not taken up by the cells. The EMT6 and B16-OVA cells on coverslips were then fixed with 3.7% formaldehyde in PBS for 15 min, and rinsed twice with PBS before their nuclei were stained with 4′,6-diamidino-2-phenylindole dihydrochloride (DAPI) (Invitrogen, USA) for 15 min. The cells were then rinsed twice with PBS again before being mounted on glass slides with VECTASHIELD® Mounting Medium (Vector Laboratories, USA). Fluorescence and dark field images were acquired using a Nikon Ci-L fluorescence upright microscope (Nikon Instruments, Japan) equipped with a CytoViva 150 Condenser (CytoViva, USA) for dark field imaging, an SCMOS camera (PcoEdge, EINST Technology Pte. Ltd., Singapore), a 60× oil-immersion objective (N.A. = 1.25) and appropriate filters to image the DAPI staining. ImageJ was used to process the DAPI staining (for nuclei), red Ce6 fluorescence images and dark field images (for NR-MS-Ce6). The images were superimposed to form a composite image that allowed us to examine the localization of NR-MS-Ce6 in B16-OVA and EMT6 cells.Combined PDT + PTT with NR-MS-Ce6 in vitro
B16-OVA or EMT6 cells were seeded in a 48-well plate at a density of between 3.0 × 10⁴ and 1.2 × 10⁵ cells per well and left to incubate overnight at 37 °C, 5% CO2 in a humidified atmosphere to allow cell adhesion. The cells were then rinsed twice with 200 μL of 1× phosphate buffered saline (PBS) following the overnight incubation before being dosed with 200 μL of NR-MS-Ce6, NR-MS and free Ce6 dissolved in MS (MS-Ce6) in serum-free medium for 6 h at varying concentrations of 0.2, 0.4 and 0.6 nM NRs, or an equivalent of 20, 40 and 60 nM MS-Ce6 based on the amount of Ce6 loaded onto NR-MS.Prior to irradiation, the cells were rinsed twice with 200 μL of 1× PBS and placed in 200 μL of fresh serum-free media. Laser irradiation was performed using a 665 nm continuous wave (CW) laser at 250 mW cm−2 for 15 min to achieve a total energy dose of 28.3 J with a laser spot size of 12.5 mm2. The cells were left to incubate at 37 °C for 24 h post-irradiation.
Following incubation, we collected the cell culture supernatant of treated B16-OVA and EMT6 cells to form our conditioned media for activating the innate immune cells. We also examined the cell viability of B16-OVA and EMT6 cells with 100 μL of PrestoBlue® cell viability reagent (diluted 10×) (Invitrogen, USA) after 1 h of incubation following standard manufacturer specified protocols. The cell viability was subsequently measured from 90 μL of the reagent transferred to a 96-well black plate under fluorescence excitation and emission of 560 nm and 590 nm, respectively. Dark toxicities of NR-MS-Ce6, NR-MS and free MS-Ce6 were also evaluated by dosing B16-OVA and EMT6 cells with the same concentration range for 6 h, and then assessing their viability 24 h later in the dark without any irradiation.
Activation of DC2.4 and J774A.1
We examined the immunogenicity of the cell death from combined PDT + PTT by NR-MS-Ce6 by dosing the conditioned media from treated B16-OVA and EMT6 cells to both live DC2.4 dendritic cells and J774A.1 macrophages seeded in a 96-well plate. Briefly, the cell culture supernatant from 8.0 × 10⁴ of these innate immune cells seeded in 200 μL of their respective medium in the 96-well plate was removed after an initial 24 h of seeding and replaced with 200 μL of 1× DMEM and 100 μL of conditioned media, and the cells were then incubated for the next 24 h at 37 °C to induce immune activation. 5 μL of Lipopolysaccharide (LPS) at 200 μg/mL was added to both DC2.4 and J774A.1 as a positive control for immune activation.The conditioned medium was removed after 24 h by centrifugation of cells at ×300g for 5 min at 4 °C, and the cells were incubated in the dark at 4 °C with 200 μL of staining buffer solution (1.5% FBS in 1× PBS) for 30 min to block non-specific interactions. Following the blocking by FBS for non-specific binding, both DC2.4 and J774A.1 cells were subsequently stained with 100 μL of staining solution consisting of anti-mouse antibodies against five markers of immune activation: CD40, CD80, CD86, H-2Db (MHCI), and I-A/I-E (MHCII) (Biolegend, USA) in 1.5% FBS in 1× PBS following standard protocols for immunostaining for flow cytometry. The stained live cells were washed by repeated centrifugation with staining buffer after 30 min incubation in the dark at 4 °C before being transferred into a 5 mL flow tube and constituted to a total volume of 400 μL per sample in staining buffer for flow cytometry.
For flow cytometry, the fluorescence of PE, APC, FITC, PE-Cy7 and Pacific Blue dyes for the anti-CD40, CD80, CD86, MHCI and MHCII antibodies, respectively, was acquired with a BD Analyser Fortressa X-20 flow cytometer using FACSDiva software (Becton Dickinson, USA) with appropriate compensation settings. The data were analyzed based on at least 1.0 × 10⁴ cells using FlowJo version 7.6 (FlowJo, USA).
When examining the dependence of J774A.1 activation on the number of cancer cells, the conditioned media of treated EMT6 cells of varying numbers (between 3.0 × 10⁴ and 1.2 × 10⁵) were dosed to live J774A.1 macrophages seeded in a 96-well plate, and the activation of J774A.1 macrophages was probed by flow cytometry as described above.
Immunogenicity of NR-MS-Ce6
We also examined the immunogenicity of NR-MS-Ce6 at varying concentrations of 0.4, 4 and 40 pM on live J774A.1 macrophages seeded in a 96-well plate to rule out the contribution of NR-MS-Ce6 in activating the innate immune cells on their own. Briefly, the cell culture supernatant from 8.0 × 10⁴ of these innate immune cells seeded in 200 μL of their respective medium in a 96-well plate was removed after an initial 24 h of seeding and replaced with 200 μL of NR-MS-Ce6 at varying concentrations constituted in 1× DMEM, and incubated for the next 24 h at 37 °C to induce immune activation. 5 μL of Lipopolysaccharide (LPS) at 200 μg mL−1 was added to J774A.1 as a positive control for immune activation. The activation of both DC2.4 and J774A.1 macrophages was probed by flow cytometry as described above.Results and discussion
Synthesis and characterization of NR-MS-Ce6
NR-CTAB were synthesized with dimensions of 47.5 ± 1.0 nm by 18.4 ± 0.8 nm as determined from the TEM images (Fig. 2A). Their aspect ratio of 2.6 produced a longitudinal surface plasmon resonance (LSPR) peak at 664 nm (Fig. 2B), which matched the 665 nm excitation wavelength of Ce6, thus allowing a single laser wavelength excitation at 665 nm to simultaneously excite both the NRs and Ce6 for combined PTT + PDT. We observed a slight red-shift of ∼3 nm in the LSPR peak when the MS protein corona was formed on the NRs and Ce6 was loaded on the protein corona to give NR-MS and NR-MS-Ce6, respectively. This red-shift was expected as the absorption of serum proteins on NR-CTAB altered their surface dielectric properties.31,41,42,44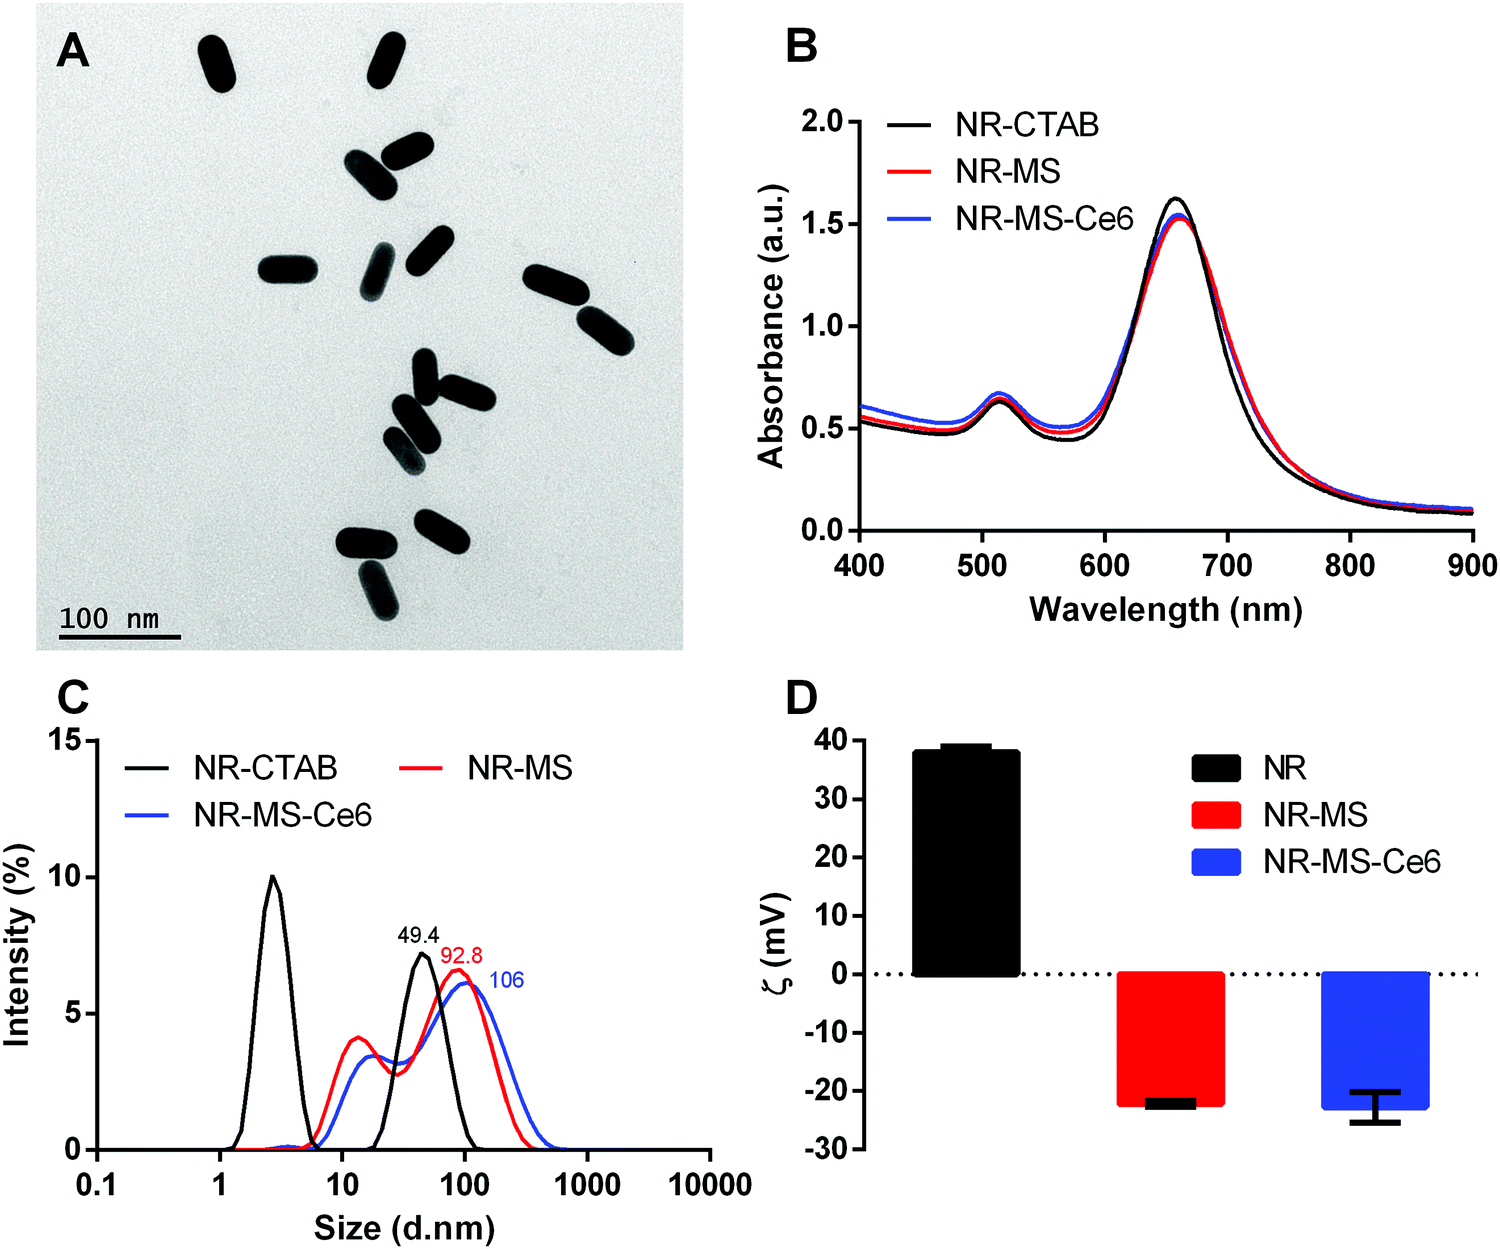 | ||
Fig. 2 Characterization of NR-MS-Ce6 and the controls of as-synthesized NR-CTAB and NR-MS showing (A) the monodispersity of the synthesized NR-CTAB used in this study using TEM with 200![[thin space (1/6-em)]](https://www.rsc.org/images/entities/char_2009.gif) 000× magnification, (B) the UV-vis spectrum, (C) histogram distribution of hydrodynamic diameter (DH) as determined by dynamic light scattering (DLS), and (D) zeta potential of all three samples. Error bars represent standard error for N = 3 samples. 000× magnification, (B) the UV-vis spectrum, (C) histogram distribution of hydrodynamic diameter (DH) as determined by dynamic light scattering (DLS), and (D) zeta potential of all three samples. Error bars represent standard error for N = 3 samples. | ||
With the protein corona formation and Ce6 loading, we observed no significant spectrum broadening and the LSPR peak remained distinct and narrow, which indicated the good colloidal stability of NR-MS-Ce6 (Fig. 2B). This was further confirmed by the dynamic light scattering (DLS) measurements, which showed appropriate increases in the average hydrodynamic diameter (DH) of NR-CTAB from 49.4 ± 0.6 nm to 92.8 ± 1.8 nm (ΔDH = 43.4 nm) and 106 ± 2.1 nm (ΔDH = 56.6 nm) for NR-MS and NR-MS-Ce6, respectively, with no aggregated size populations observed in their histogram size distribution (Fig. 2C).
The successful MS protein corona formation was also confirmed by zeta potential measurements, which showed the positively charged NR-CTAB with zeta potential, ζNR-CTAB, = 38.0 ± 0.3 mV flipped negatively to −22.2 ± 0.4 mV and −22.8 ± 0.5 mV for NR-MS and NR-MS-Ce6, respectively, due to the adsorption of net negatively charged MS proteins on NR-CTAB (Fig. 2D). Although the loading of Ce6 on the MS protein corona caused minimal changes to both the DH and zeta potential, we were able to use Ce6 fluorescence measurements together with an appropriate correction factor of 50.9 ± 0.6% for fluorescence quenching determined empirically (see ESI,† Fig. S1) to quantify a loading of ∼101 ± 3 Ce6 molecules per NR in NR-MS-Ce6.
Combined PDT + PTT on cancer cells with NR-MS-Ce6
We observed dose-dependent cell killing of B16-OVA cells following combined PDT + PTT with NR-MS-Ce6, achieving complete 100% cell killing at the lowest concentration of 0.2 nM NR-MS-Ce6 used in our study (Fig. 3A, blue solid). The equivalent concentration of 0.2 nM NR-MS for PTT alone and 20 nM free unloaded MS-Ce6 for PDT alone exhibited negligible cell killing and maintained relatively high cell viabilities of 97.2 and 96.3%, respectively (Fig. 3A, red and green solid, respectively). This indicated that while PTT or PDT alone was unable to provide efficacious treatment at such low concentrations, their combination using NR-MS-Ce6 enabled a synergistic therapeutic outcome at extremely low concentrations, consistent with our previous in vitro and in vivo studies.41,42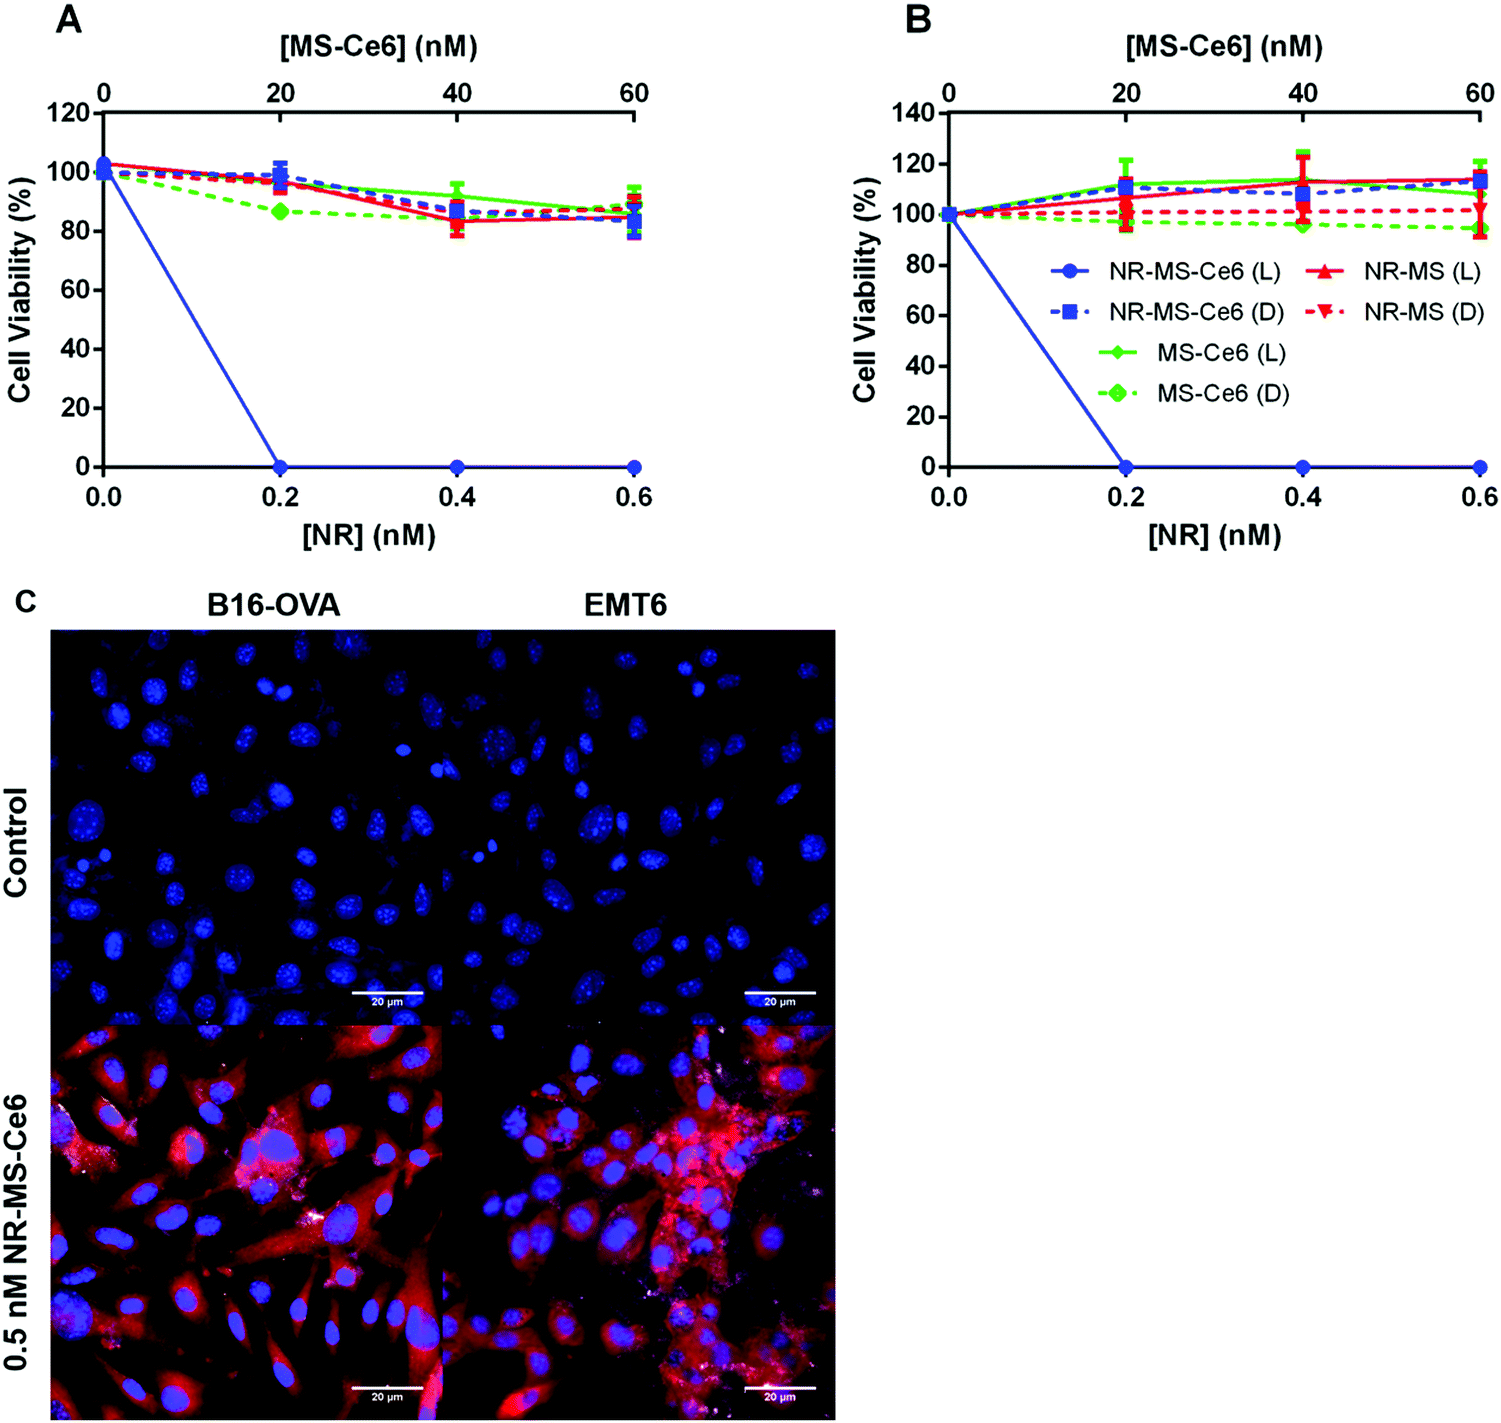 | ||
| Fig. 3 Cell viability after dosing 90000 cells per well of (A) B16-OVA and (B) EMT6 cells with varying concentrations of NR-MS-Ce6, NR-MS and free MS-Ce6 in serum-free medium for 6 h and irradiating them with a 665 nm CW laser at 250 mW cm−2 for 15 min of PDT and PTT. Note: L refers to laser irradiation, D refers to the dark condition. (C) Uptake and localization of 0.5 nM NR-MS-Ce6 in B16-OVA and EMT6 cells after 6 h incubation as probed by fluorescence and dark field microscopy superimposed together. Ce6 fluorescence is shown in the red channel, while the cell nucleus (DAPI-stained) is shown in the blue channel. The bright scattering signal from NRs under dark field microscopy was superimposed on the fluorescence image to show co-localization of both Ce6 and NRs in the EMT6 cells. B16-OVA and EMT6 cells that are not dosed with NR-MS-Ce6 formed our control images. Scale bar = 20 μm. Error bars represent standard error for N = 4 samples. | ||
The low concentrations used in our study also caused negligible dark toxicity for all three samples up to 0.6 nM NR-MS-Ce6, and its equivalently loaded 60 nM free MS-Ce6 (Fig. 3A, dotted), which highlighted the biocompatibility of NR-MS-Ce6 when used for treatment.41,42 Consistent observations on the cell killing were also made with EMT6 cells (Fig. 3B), indicating that the efficacy of combined PDT + PTT was not specific to any type of cancer cell.
We showed that NR-MS-Ce6 entered the B16-OVA and EMT6 cells to effect the cell killing during PDT + PTT, as evidenced from the red fluorescence of Ce6 predominantly in the cytoplasmic regions where its uptake is likely facilitated by NR-MS, as reported previously41,42 (Fig. 3C). We also observed co-localization of NRs in the cytoplasmic regions although the bright scattering signal from the NRs was not as extensive under the superimposed dark field microscopy, likely due to the low dosing concentration of NRs. The intracellular distribution of both NRs and Ce6 appeared non-homogenous from the uneven distribution of the bright scattering signal and red fluorescence, respectively, which agreed with the heterogenous nature of cancer cells in the uptake of NPs. Collectively, the co-localization suggested that PDT and PTT occurred concurrently.
Activation of J774A.1 and DC2.4 cells
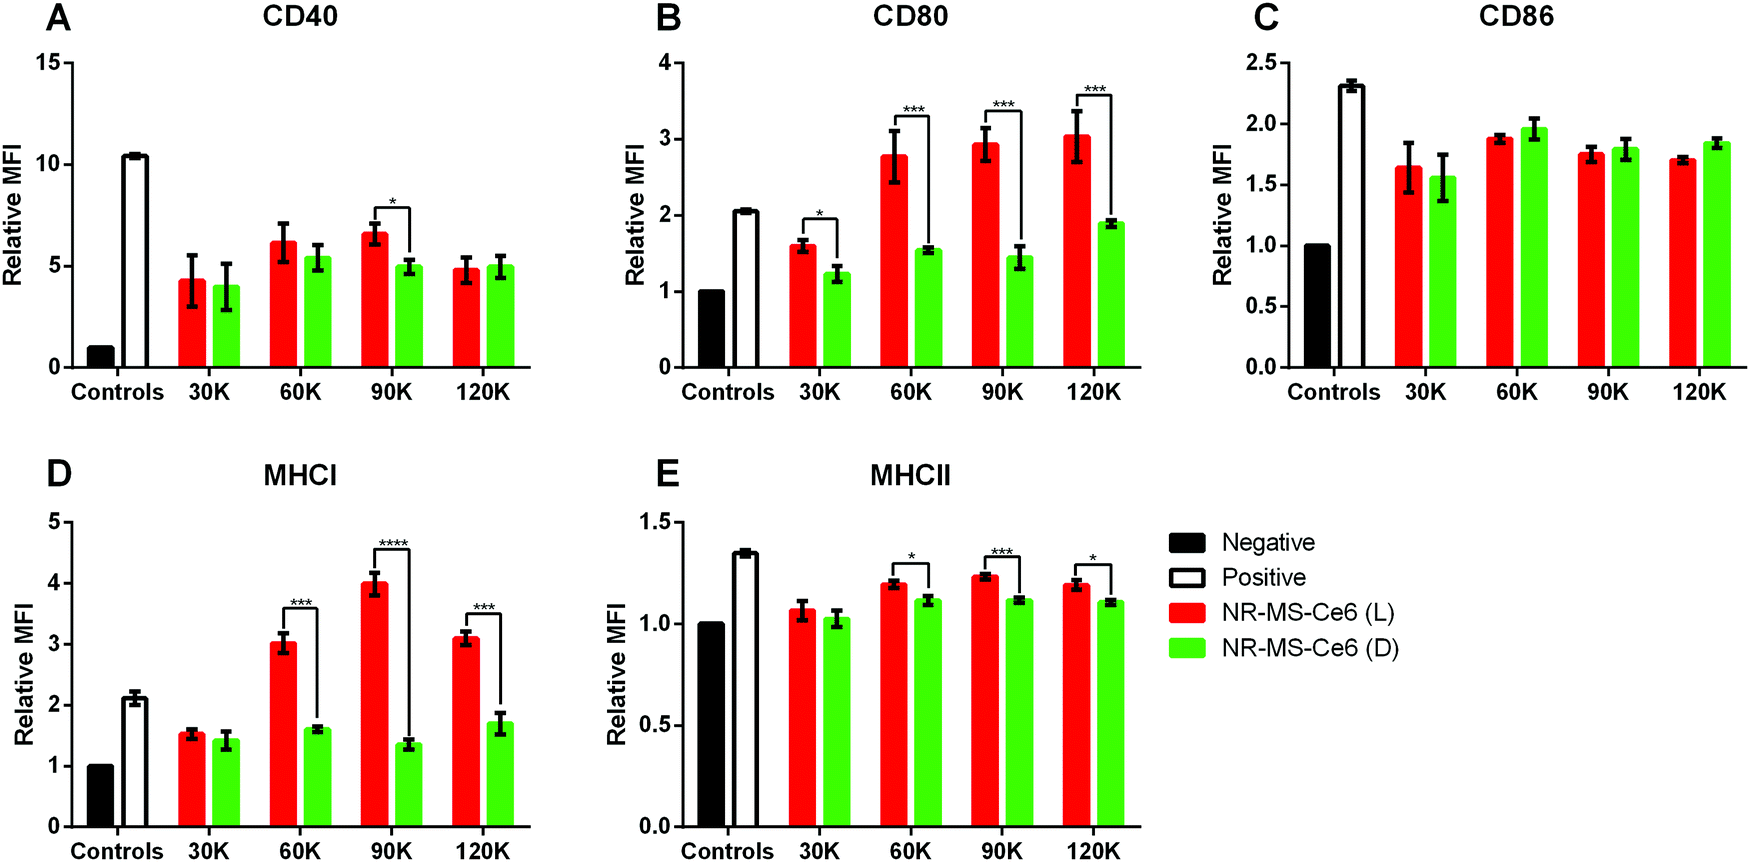
The conditioned medium from EMT6 cells following combined PDT + PTT with 0.2 nM NR-MS-Ce6 was extracted and dosed to investigate its ability to activate both J774A.1 and DC2.4 cells of innate immunity. We chose to examine the expression levels of antigen complexes (MHCI and MHCII) and co-stimulatory molecules (CD40, CD80, and CD86) as our relevant surface markers based on their interaction and activation of adaptive T cells, where the CD4+ and CD8+ T cells interact with MHCII and MHCI antigen complexes, respectively, as well as co-stimulatory molecules via the CD40-CD40L and CD28-CD80/86 axis. An increase in expression levels of the markers studied would provide an indication of the degree of activation of both DC2.4 and J774A.1 macrophages, and serve to facilitate the ligand–receptor interactions with effector T cells for increased proliferation and trafficking to tumor sites.45The relative mean fluorescence intensity (MFI) of various relevant surface markers obtained from the histogram data following flow cytometry of the innate immune cells (see the ESI,† Fig. S2 for J774A.1 cells and Fig. S3 for DC2.4 cells) showed significantly higher expression of co-stimulatory molecules CD40, CD80 and CD86 (Fig. 4A–C), and antigen complexes MHCI and MHCII (Fig. 4D and E) in J774A.1 cells dosed with conditioned medium from EMT6 cells following combined PDT + PTT with NR-MS-Ce6 (Fig. 4, red bars) when compared to non-activated J774A.1 cells as our negative control (Fig. 4, black bars). In fact, the expression levels of CD80 and MHCI were even higher than those of our positive control of J774A.1 cells activated by LPS (Fig. 4, white bars). The elevated expression levels of these surface markers, which indicated the activation of J774A.1 macrophages, could be attributed to the release of antigens comprising DAMPs and pro-inflammatory cytokines into the conditioned medium of EMT6 cells during cell death by combined PDT + PTT.4,7,9,18,46,47 The exact identity of these secreted antigens is complex and beyond the scope of our present study.
 | ||
| Fig. 4 Relative mean fluorescence intensities (MFIs) obtained from flow cytometry analysis indicating the expression levels of (A) CD40, (B) CD80, (C) CD86, (D) MHCI and (E) MHCII surface markers on DC2.4 and J774A.1 cells dosed with conditioned medium from 9.0 × 10⁴ EMT6 cells following combined PDT + PTT with 0.2 nM NR-MS-Ce6 (red) (N = 3, * p < 0.05, **p < 0.01, ***p < 0.001, ****p < 0.0001). Note: L and D denote EMT6 cells dosed with NR-MS-Ce6 and irradiated (red) or kept in the dark (green), respectively, light control refers to laser-irradiated EMT6 cells (blue) and dark control refers to non-laser irradiated EMT6 cells (gray), both in the absence of NR-MS-Ce6. Negative control (black) refers to unstimulated immune cells, while the positive control (blank) was stimulated with LPS. | ||
While the conditioned media obtained from EMT6 cells dosed with 0.2 nM NR-MS-Ce6 but not subjected to PDT + PTT irradiation also showed slightly higher expression levels of all five cell surface markers (Fig. 4, green bars) compared to non-activated J774A.1 (Fig. 4, black bars), most except CD86 were still significantly lower than that subjected to irradiation (Fig. 4, red bars). This was likely due to the absence of any cell death without irradiation, which consequently did not lead to the release of significant levels of antigens or other immunostimulatory cytokines associated with cell death.
Nonetheless, our results also suggested that NR-MS-Ce6 themselves could also be capable of inducing the EMT6 cells to secrete immunostimulatory factors into their conditioned medium without killing the cells to induce a smaller extent of J774A.1 activation. This could be attributed to the MS protein corona on NR-MS-Ce6, as previous studies have reported humoral mechanisms preventing tumor growth through a concentration-dependent toxicity exerted by MS proteins on mouse tumor cells in vitro.48 Here, the presence of MS proteins on NR-MS-Ce6 could have exerted similar humoral effects to trigger the secretion of immunogenic stress factors from EMT6 cells to activate J774A.1 macrophages, but yet be insufficient to exert cytotoxicity of EMT6 cells given their much lower concentration than that required for cytotoxicity, as shown in Fig. 3. The uptake of Ce6 in EMT6 cells was unlikely responsible for the small extent of J774A.1 activation since the conditioned media of EMT6 cells dosed with 20 nM MS-Ce6 mostly showed no significant increase in expression levels of the three co-stimulatory markers (p > 0.05) against their respective control regardless of irradiation (see the ESI,† Fig. S4). This suggested a low possibility of humoral effects exerted by 20 nM MS-Ce6 on EMT6 cells.
Interestingly, our results showed that the conditioned medium from EMT6 cells in itself without being dosed with NR-MS-Ce6 could also induce a small level of activation of the J774A.1 macrophages as observed from the slight increase in expression of all five markers over the negative control of unstimulated J774A.1 macrophages. This was regardless of whether the EMT6 cells were irradiated (Fig. 4, blue bars) or kept in the dark (Fig. 4, gray bars). This was expected since studies have reported that cancer cells are capable of secreting various factors during normal cellular metabolism that may potentially be slightly immunogenic.49,50
Apart from J774A.1 macrophages, the conditioned medium from EMT6 cells following combined PDT + PTT with NR-MS-Ce6 could also activate DC2.4 DCs although the level of activation may seem weaker quantitatively compared to the macrophages. Here, the expression levels of all markers expressed by DC2.4 dosed with conditioned medium of EMT6 treated with combined PDT + PTT were comparable to that of DC2.4 activated by LPS as our positive control.
The conditioned medium from EMT6 cells itself could also induce a statistically significant increase in expression of all markers (p < 0.05) except CD86 and MHCII (Fig. 4C and 4E, p > 0.05) regardless of whether the cells were dosed with NR-MS-Ce6 as compared to the unstimulated DC2.4 population. This could be attributed to the basal level of immunogenicity of EMT6 from normal cellular metabolism, as discussed earlier. However, it was interesting to note that these expression levels of the markers (Fig. 4, grey bars) were statistically comparable to the slightly higher expression levels of all markers induced by the conditioned media of PDT + PTT treated EMT6 cells (Fig. 4, red bars), possibly suggesting that combined PDT + PTT on EMT6 cells may not generate conditioned medium that could activate DC2.4 DCs to a significant degree. This was likely due to the less efficient phagocytic uptake inherent to dendritic cells as compared to macrophages, leading to a reduced uptake and processing of conditioned medium constituents and consequent reduced activation.51
The stronger activation of J774A.1 macrophages than the DC2.4 dendritic cells when these innate immune cells were dosed with the treated conditioned medium as compared to other controls could be due to differences in the biological responses between the two cell lines. Macrophages contribute to the initiation of the inflammatory process and are able to sustain activation for longer periods, while DCs have a relatively shorter activation lifespan as they lose their antigen uptake capacity upon activation and interaction with naïve T cells for downstream adaptive responses.52
Here, it is also noteworthy that the activation of macrophages and DCs was not exhaustive and other innate immune cells, e.g., neutrophils and natural killer cells that were not examined in our present study, could also be activated by the conditioned medium of treated cancer cells.
Cell-line dependent activation of J774A.1
With the activation observed in J774A.1 macrophages by conditioned medium of EMT6 cells following combined PDT + PTT, we further examined whether the conditioned medium of other cancer cell types could also activate the J774A.1 cells. Similar to EMT6 cells, the conditioned medium of B16-OVA in itself in the absence of NR-MS-Ce6 also induced slight activation of J774A.1, as evidenced by an increase in the expression of CD40 and CD86 markers as compared to our negative control (p < 0.05) (Fig. 5A and C). In the absence of NR-MS-Ce6, the relative MFI showed similar expression levels of all five markers between irradiated B16-OVA cells (Fig. 5, blue bars) and B16-OVA cells kept in the dark (Fig. 5, gray bars) with no significant difference between them. This slight activation was likely attributed to the secretion of various immunogenic factors by B16-OVA cells during normal cellular metabolism, as discussed earlier for EMT6 cells, and could be considered the baseline immunogenicity of B16-OVA cells.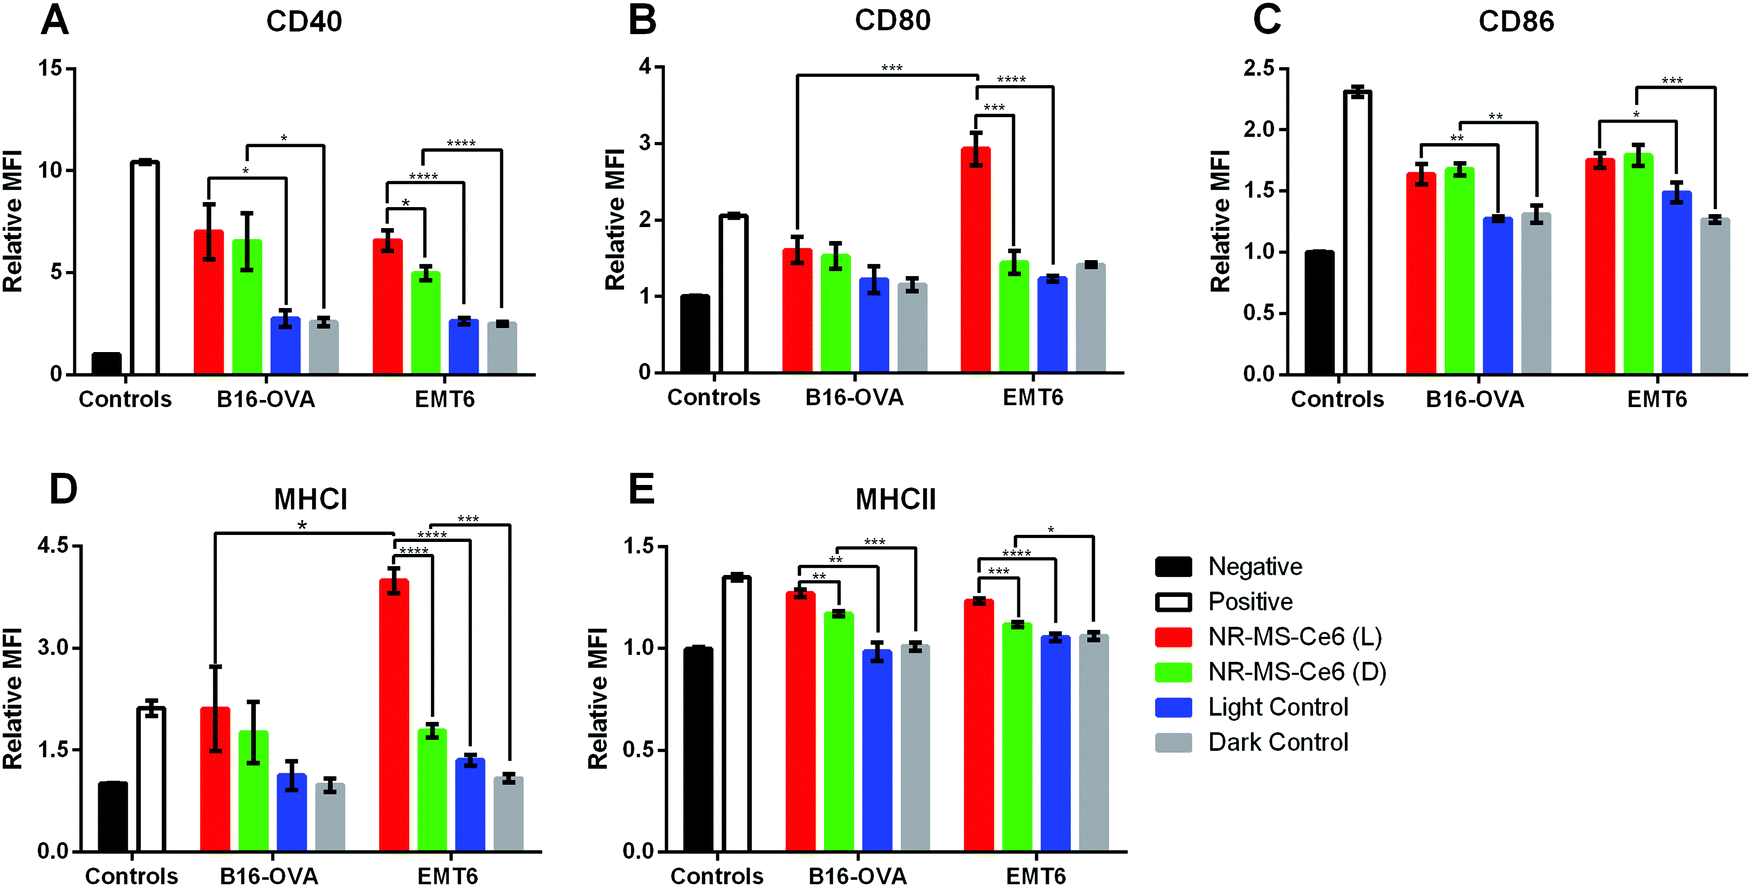 | ||
| Fig. 5 Relative mean fluorescence intensities (MFIs) obtained from flow cytometry analysis indicating the expression levels of (A) CD40, (B) CD80, (C) CD86, (D) MHCI and (E) MHCII surface markers on J774A.1 macrophages dosed with conditioned medium of treated B16-OVA or EMT6 cells (9.0 × 10⁴ cells) (N = 3, * represents p < 0.05, ** represents p < 0.01, *** represents p < 0.001, **** represents p < 0.0001). Note: L and D denote EMT6 cells dosed with NR-MS-Ce6 and irradiated (red) or kept in the dark (green), respectively, light control refers to laser-irradiated EMT6 cells (blue) and dark control refers to non-laser irradiated EMT6 cells (gray), both in the absence of NR-MS-Ce6. Negative control (black) refers to unstimulated J774A.1 cells, while the positive control (white) refers to J774A.1 cells stimulated with LPS. | ||
Furthermore, when the B16-OVA cells were treated with 0.2 nM NR-MS-Ce6, their resulting conditioned medium was likewise also able to activate the J774A.1 macrophages, similar to the conditioned medium of EMT6 cells. This was true regardless of whether the cells were irradiated for combined PDT + PTT (Fig. 5, red bars) or not (Fig. 5, green bars). In both cases, we observed statistically significant increases in surface expression over their respective controls without NR-MS-Ce6 (Fig. 5, blue and gray bars respectively), particularly for CD40, CD86 and MHCII.
In the case of B16-OVA, however, the expression of CD80 and MHCI in J774A.1 was not increased significantly in the presence of NR-MS-Ce6 unlike that of EMT6 where the combined PDT + PTT with NR-MS-Ce6 caused a drastic increase in the expression of CD80 and MHCI. The PDT + PTT-treated conditioned medium from EMT6 cells also caused significantly higher CD80 (Fig. 5B, red bars, p < 0.001) and MHCI (Fig. 5D, red bars, p < 0.05) expression levels in J774A.1 macrophages as compared to the conditioned medium from B16-OVA. This was likely due to the more immunogenic profile of antigens and DAMPs present in the conditioned media of treated EMT6 than that of B16-OVA, suggesting possible cancer cell-specific variations in J774A.1 activation, although this was inconclusive considering the lack of statistically significant differences in the CD40, CD86 and MHCII expression levels between both cell lines (Fig. 5A, C and E, p > 0.05).
Apart from this, we also observed no significant difference in the expression of all five surface markers on J774A.1 except MHCII (Fig. 5E) when dosed with the conditioned medium of B16-OVA cells regardless of whether the cells were previously subjected to PDT + PTT or not after dosing with NR-MS-Ce6. This was unlike the conditioned medium from EMT6, which elevated the expression of CD40, CD80, MHCI and MHCII of J774A.1 cells when PDT + PTT was performed on them compared to the non-irradiated EMT6 cells after dosing with NR-MS-Ce6. It is evident that the irradiation of NR-MS-Ce6 in EMT6 produced a conditioned medium capable of inducing a stronger activation of J774A.1 cells than the conditioned medium generated from the irradiation of NR-MS-Ce6 in B16-OVA cells. Such a cancer cell-dependent observation could also be due to the MS proteins on NR-MS-Ce6 exerting greater humoral effects as discussed earlier on B16-OVA cells than EMT6 cells, which minimized the additional activation attributed to the irradiation.
Dependence of J774A.1 activation on number of cancer cells
Since the activation of innate immune cells was dependent on their exposure to tumor antigens, DAMPs and pro-inflammatory cytokines present in the conditioned medium of cancer cells, we further investigated whether the immune response of a fixed number of 80000 J774A.1 cells could be tuned by dosing them with the conditioned medium from an increasing number of EMT6 cells (between 30000 and 12000 cells) following combined PDT + PTT with 0.2 nM NR-MS-Ce6.
In general, we observed a positive correlation between the expression levels of most markers, as quantified by the relative MFI expression, and the conditioned medium with increasing numbers of EMT6 cells from 30000 to 90000 cells relative to the non-irradiated controls (Fig. 6). Here, the release of antigenic cytokines following EMT6 cell death from PDT + PTT was likely proportional to the cell number. With the exception of CD86 (Fig. 6C), the conditioned medium from 90000 EMT6 cells following combined PDT + PTT induced significantly higher CD40, CD80, MHCI and MHCII expression compared to the non-irradiated cells dosed with NR-MS-Ce6.
 | ||
| Fig. 6 Relative mean fluorescence intensities (MFIs) obtained from flow cytometry analysis indicating the expression levels of (A) CD40, (B) CD80, (C) CD86, (D) MHCI and (E) MHCII surface markers on J774A.1 cells dosed with the treated EMT6 cell supernatant of varying cell numbers (N = 3, * represents p < 0.05, ** represents p < 0.01). Note: L refers to laser-irradiated EMT6 cells dosed with NR-MS-Ce6 (red), D refers to EMT6 cells dosed with NR-MS-Ce6 without laser irradiation (green). Negative control (black) refers to unstimulated J774A.1, while the positive control (white) was J774A.1 stimulated with LPS. | ||
On the other hand, the conditioned medium from 30000 EMT6 cells following combined PDT + PTT caused no significant increase in expression levels of all markers (except CD80, Fig. 6B) for the non-irradiated cells dosed with NR-MS-Ce6. All these results suggested that the generation of a larger antigenic load from more cancer cell killing could elicit a stronger level of activation in J774A.1 macrophages.
A further increase in the activation of J774A.1 was not observed when the EMT6 cell number increased beyond 90000 to 120000 cells as the relative MFI expression for all markers did not increase any further. It appeared that an upper limit or a saturation amount of antigenic load in the conditioned medium existed to maximize the activation extent of J774A.1 by the EMT6 conditioned medium based on the EMT6 cell numbers. This could be due to the finite phagocytic capacity of macrophages for immunogenic antigens present in the conditioned medium to the point beyond which macrophage exhaustion occurs with impairment to its function in antigen presentation,53 as observed by the drop in CD40, CD86, MHCI and MHCII levels (Fig. 6).53 Nonetheless, it is clear that combined PDT + PTT on EMT6 cells does significantly alter the profile of the conditioned media to be highly immunogenic, and these findings provided the rationale for us to perform combined PDT + PTT on 90000 cancer cells to induce activation of J774A.1 macrophages (Fig. 4 and 5).
Furthermore, the same observations of significant increases (p < 0.05) in expression levels of co-stimulatory molecules (i.e., CD40, CD80 and CD86) in J774A.1 from conditioned medium of non-irradiated EMT6 cells dosed with NR-MS-Ce6 over the negative control were made (Fig. 6, green vs. black bars). Again, this could potentially be due to humoral factors exerted by MS proteins on EMT6 cells, although the immunogenicity posed by the minute amounts of NR-MS-Ce6 excreted by the EMT6 cells into the conditioned medium could not be ruled out as discussed earlier.
However, the expression levels of surface markers on J774A.1 appeared to be independent of the number of non-irradiated EMT6 cells dosed with 0.2 nM NR-MS-Ce6. This was unexpected but could also further suggest the immunogenicity to be largely associated with the fixed dose of NR-MS-Ce6. Furthermore, cancer cells could also release immunosuppressive factors such as TGF-β, VEGF and IL-10 that were in homeostasis with the secreted immunogenic cytokines during normal cellular metabolism in the absence of PDT + PTT to maintain a constant immunogenic profile of the EMT6 conditioned media regardless of EMT6 cell numbers.50,54
Non-activation of innate immune cells by NR-MS-Ce6
While the conditioned medium from the cancer cells may contain a small amount of NR-MS-Ce6 that were excreted out and could contribute to the immunogenicity of the conditioned medium as discussed earlier, we showed that such a low concentration range of 0.4 to 40 pM NR-MS-Ce6 dosed directly to both J774A.1 and DC2.4 cells did not induce their activation (Fig. 7). Here, we examined a wide concentration range of NR-MS-Ce6 over two decades dosed to the innate immune cells to mimic and cover their possible range of concentrations present in the conditioned medium of EMT6 and B16-OVA cells due to exocytosis. The concentration range used was within an order of the ∼0.8 fractional quantification of exocytosis of the dosed NPs reported by Chithrani et al.,55 although we note that the reported fraction of exocytosis was also dependent on factors including cell type, initial dosing concentration and surface protein corona characteristics.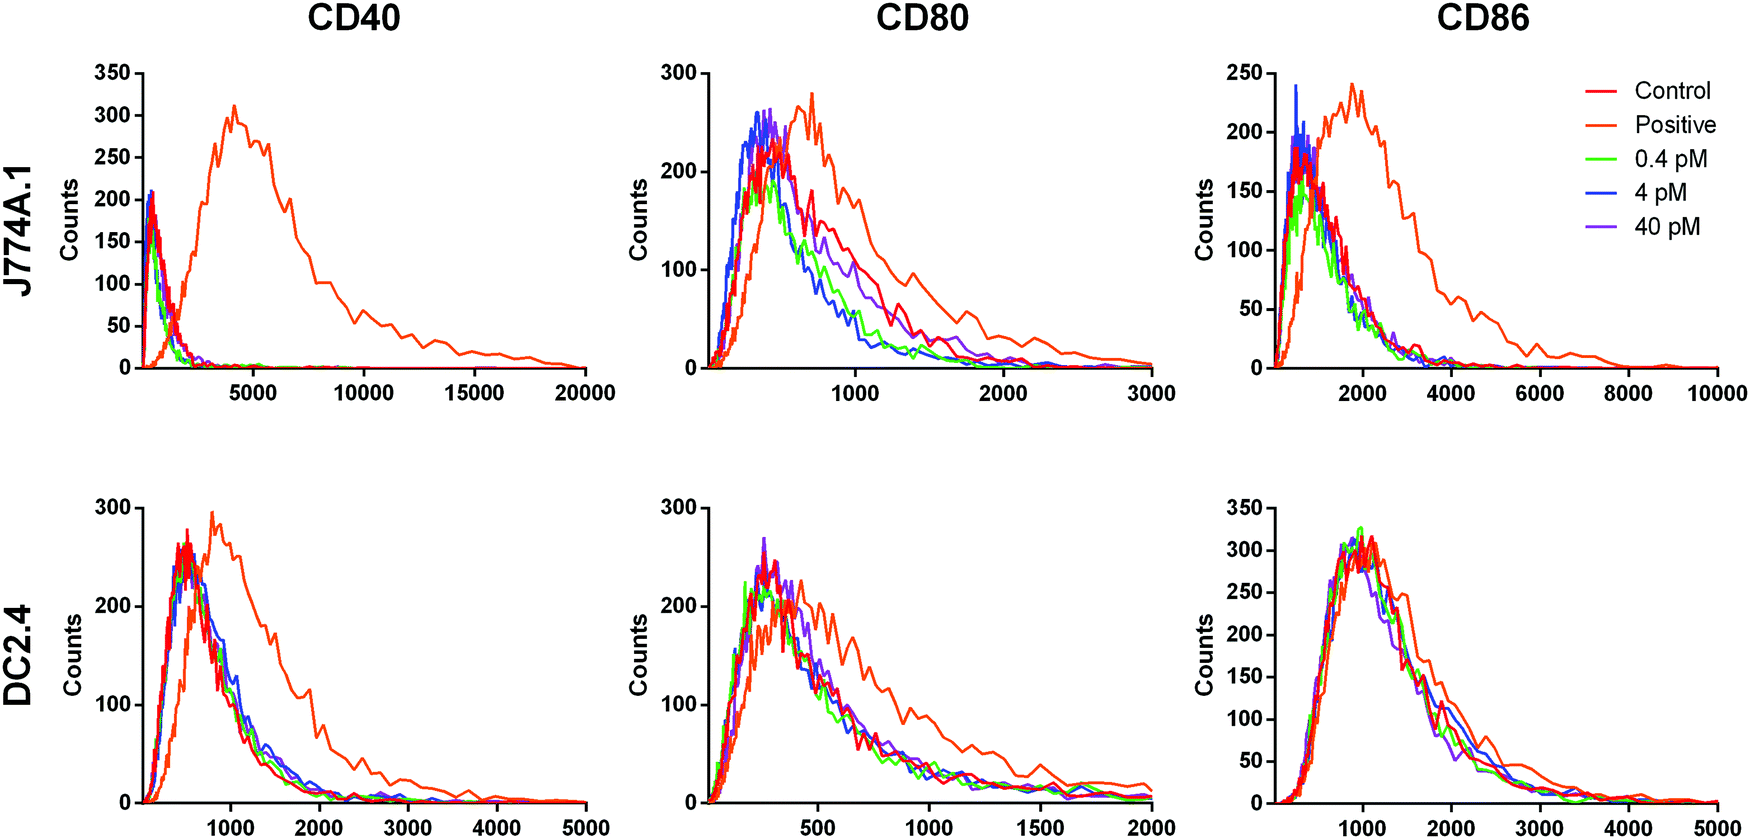 | ||
| Fig. 7 Fluorescence histograms of staining for CD40, CD80 and CD86 surface markers in J774A.1 (top) and DC2.4 (bottom) cells after dosing directly with 0.4 pM (green), 4 pM (blue) and 40 pM (purple) NR-MS-Ce6. The overlapping fluorescence profiles indicated no observed activation of J774A.1 cells relative to the negative control of non-activated J774A.1 cells (red). J774A.1 cells stimulated with LPS formed our positive control (orange) of activation. | ||
The analysis of activation based on fluorescence histogram profiles for co-stimulatory markers CD40, CD80 and CD86 showed no upregulation of co-stimulatory markers, as evidenced from the lack of right-shifting of the fluorescence histogram profile for the three concentrations, as well as their overlap with the unstimulated control for both J774A.1 (Fig. 7, top row) and DC2.4 (Fig. 7, bottom row). In fact, a further increase in the concentration of NR-MS-Ce6 by 6.25 times to 0.25 nM also showed non-significant immune activation across all markers when dosed to J774A.1 cells (p > 0.05, see ESI,† Fig. S5). Since NR-MS-Ce6 did not activate J774A.1 and DC2.4 directly, these results thus showed that the activation of innate immune cells induced by the conditioned medium was likely not attributed to the excreted NR-MS-Ce6 from the cancer cells.
Cytokine secretion by activated J774A.1
Simultaneous expression of co-stimulatory surface molecular markers and secretion of pro-inflammatory cytokines is often observed in macrophage activation since they collectively prime the cells to mount an immune response.10,56,57 The secretion of pro-inflammatory cytokines not only serves as a signal for the activation of naïve T cells, they also regulate the antigen sensitivity, proliferation and trafficking of effector and memory T cells, which will confer advantages for T cells to act against the target pathogens.58 Hence, we examined if the activation of J774A.1 by the conditioned medium of PDT + PTT treated B16-OVA and EMT6 cancer cells also induced their secretion of TNF-α and IL-6 as the pro-inflammatory cytokines of our interest. These cytokines are commonly reported to promote pro-inflammatory responses against cancers, where both TNF-α and IL-6 serve as inflammatory mediators for the generation of acute immune responses.57,59,60We observed from our ELISA analysis that statistically significant levels of TNF-α (p < 0.0001) and IL-6 (p < 0.05) were secreted from J774A.1 macrophages when they were exposed to the conditioned medium of B16-OVA cells following combined PDT + PTT with 0.2 nM NR-MS-Ce6 (Fig. 8, red bars) compared to the other controls without drug and light (Fig. 8). The level of IL-6 was even comparable to our positive control of J774A.1 stimulated with LPS. Such levels of cytokine secretion correlated well with the increase in most surface marker expressions (i.e., CD40, CD86, and MHCII) seen earlier in Fig. 4, suggesting that combined PDT + PTT with NR-MS-Ce6 on B16-OVA could promote broad macrophage activation.
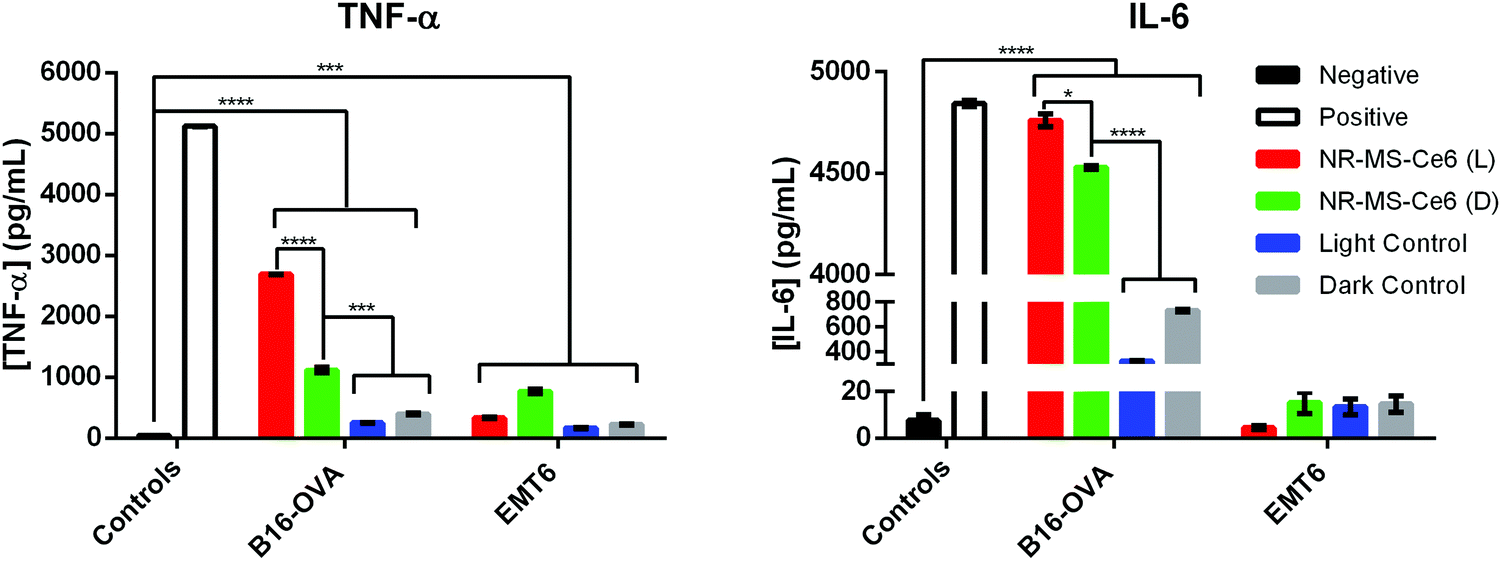 | ||
| Fig. 8 Levels of pro-inflammatory cytokines (TNF-α and IL-6) secreted by J774A.1 macrophages dosed with conditioned medium of B16-OVA or EMT6 cells (90000 cells) following combined PDT + PTT as examined by ELISA (N = 3, * represents p < 0.05, *** represents p < 0.001, **** represents p < 0.0001). Note: L refers to laser-irradiated cancer cells dosed with NR-MS-Ce6 (red), D refers to EMT6 cells dosed with NR-MS-Ce6 without laser irradiation (green), light control refers to laser-irradiated cancer cells (blue) and dark control refers to non-laser irradiated cancer cells (grey), both in the absence of NR-MS-Ce6. The negative control (black) refers to unstimulated J774A.1, while the positive control (white) was J774A.1 stimulated with LPS. | ||
Even in the absence of light exposure, the dosing of NR-MS-Ce6 to the B16-OVA cells could generate a conditioned medium that induced significantly elevated TNF-α (p < 0.001) and IL-6 (p < 0.0001) secretion in J774A.1 macrophages (Fig. 8, green bar) compared to the controls of B16-OVA cells without the NR-MS-Ce6 dosing (Fig. 8, gray bars). This pro-inflammatory cytokine secretion by J774A.1 macrophages was largely consistent with their increased surface marker expression (Fig. 5), and could further support the role of NR-MS-Ce6 in exerting humoral effects on some cancer cells like B16-OVA that could possess downstream immunological implications regardless of whether phototherapy was initiated.
However, the levels of TNF-a and IL-6 secreted by J774A.1 macrophages on their exposure to the conditioned medium of EMT6 cells following combined PDT + PTT (Fig. 8, red bars for EMT6 cells) were significantly lower compared to B16-OVA. In fact, the levels of both pro-inflammatory cytokines were lower than that induced by the conditioned media of EMT6 cells dosed with NR-MS-Ce6 but not irradiated (Fig. 8, green bars for EMT6 cells). This was unexpected given the increased surface marker expression observed in J774A.1 macrophages with the same conditioned medium (Fig. 4). The absence of any corresponding increase in pro-inflammatory cytokine secretion could suggest that the macrophages may not be fully activated when assessed against a more complete suite of activation markers comprising both surface and secreted markers. It is also worth noting that the conditioned medium of EMT6 without NR-MS-Ce6 dosing also induced lower pro-inflammatory cytokine levels in J774A.1 macrophages compared to its B16-OVA counterpart, particularly for IL-6. This again highlights cancer cell-specific differences in their propensity to stimulate the innate immune cells with their humoral secretion.
While it was difficult to adequately account for the disparate observations between the surface marker expression and cytokine secretion arising from the conditioned medium of EMT6 cells, we could only suggest the possibility that some DAMPs released from combined PDT + PTT on EMT6 cells, such as HMGB1 and S100, could contribute to both anti-tumor and pro-tumor effects and limit the production of pro-inflammatory cytokines by J774A.1 cells.61
Nonetheless, our results also suggested that pro-inflammatory cytokine production in macrophages induced by conditioned medium of PDT + PTT treated cancer cells could be cell-line dependent. Here, B16-OVA and EMT6 cells exhibited different intrinsic characteristics in vitro,62 where the profile of DAMPs present in the conditioned media for both B16-OVA and EMT6 differed significantly to explain the variations in the surface marker expression and pro-inflammatory cytokine secretion profiles of J774A.1. Unfortunately, a detailed examination of DAMPs was beyond the scope of our study.
Conclusion
Our present study demonstrated the ability of combined PDT + PTT with NR-MS-Ce6 on cancer cells to activate innate immune cells upon cancer cell death in vitro as marked by increased surface marker expression and pro-inflammatory cytokine secretion in J774A.1 macrophages when dosed with the conditioned media from the cancer cells. The activation of DC2.4 appeared weaker given its weaker surface marker expression and phagocytic properties compared to J774A.1, and would therefore play a lesser role than the macrophages in the immune-related anti-tumor responses proposed in our previous in vivo study.31 The extent of activation also depended on the cancer cell type and cell number, which influenced the released antigen load.Given the gaps in our present understanding of innate immune activation associated with combined PDT + PTT, our study uncovered differences in cancer cell line-specific responses, which implied that the same extent of post-therapy immunological response could not be expected between different cancer cell types. This would consequently affect the overall efficacy of the phototherapy between different types of cancers, necessitating further verification with in vivo studies. The dependence on cell number in vitro below a certain threshold also highlighted potential implications in having a limited tumor size before the amount of tumor antigens and endogenous adjuvants released ceased to have any incremental effect on the innate immune activation.
Collectively, our study therefore highlighted the importance of immunological investigations to complement any studies on nanoparticle-based therapeutic interventions either in vitro or in vivo to better evaluate them. Specifically, we argue for consideration of the potential role and involvement of the immune system in recognizing and eradicating cancers when designing nanomedicine to effectively reduce or prevent the re-growth of tumors.
Although the focus of our study on innate immune cells might not be as comprehensive compared to animal studies, we propose that our approach could provide a simple way to screen for the first line of immune responses arising from nanoparticle-based therapies prior to in vivo studies. With a better understanding of the post-therapy innate immune effects, we can further improve the design of nanomedicines that exploit not just their inherent properties, but also harness the immune system to achieve even better therapeutic outcomes.
Author contributions
MWCK performed all the experiments and analyzed the data. HL and JCYK provided the experimental design and resources for the experiments to be conducted. The manuscript was written through contributions of all authors. All authors have given approval to the final version of the manuscript.Conflicts of interest
There are no conflicts to declare.Acknowledgements
The funding used to support the research of the manuscript was from the Ministry of Education (MOE) AcRF Tier 1 Grant (WBS R-397-000-295-114). WCM Kang would like to acknowledge support through the NGS scholarship by the NUS Graduate School for Integrative Sciences and Engineering.References
- S. Zelenay and C. Reis e Sousa, Trends Immunol., 2013, 34, 329–335 CrossRef CAS.
- P. Mroz, A. Yaroslavsky, G. B. Kharkwal and M. R. Hamblin, Cancers, 2011, 3, 2516–2539 CrossRef CAS.
- G. Kroemer, L. Galluzzi, O. Kepp and L. Zitvogel, Annu. Rev. Immunol., 2013, 31, 51–72 CrossRef CAS.
- A. D. Garg, D. Nowis, J. Golab, P. Vandenabeele, D. V. Krysko and P. Agostinis, Biochim. Biophys. Acta, Rev. Cancer, 2010, 1805, 53–71 CrossRef CAS.
- B. Montico, A. Nigro, V. Casolaro and J. Dal Col, Int. J. Mol. Sci., 2018, 19, 594 CrossRef.
- A. D. Garg, L. Galluzzi, L. Apetoh, T. Baert, R. B. Birge, J. M. Bravo-San Pedro, K. Breckpot, D. Brough, R. Chaurio, M. Cirone, A. Coosemans, P. G. Coulie, D. De Ruysscher, L. Dini, P. de Witte, A. M. Dudek-Peric, A. Faggioni, J. Fucikova, U. S. Gaipl, J. Golab, M. L. Gougeon, M. R. Hamblin, A. Hemminki, M. Herrmann, J. W. Hodge, O. Kepp, G. Kroemer, D. V. Krysko, W. G. Land, F. Madeo, A. A. Manfredi, S. R. Mattarollo, C. Maueroder, N. Merendino, G. Multhoff, T. Pabst, J. E. Ricci, C. Riganti, E. Romano, N. Rufo, M. J. Smyth, J. Sonnemann, R. Spisek, J. Stagg, E. Vacchelli, P. Vandenabeele, L. Vandenberk, B. J. Van den Eynde, S. Van Gool, F. Velotti, L. Zitvogel and P. Agostinis, Front. Immunol., 2015, 6, 588 Search PubMed.
- D. V. Krysko, A. D. Garg, A. Kaczmarek, O. Krysko, P. Agostinis and P. Vandenabeele, Nat. Rev. Cancer, 2012, 12, 860–875 CrossRef CAS.
- J. S. Roh and D. H. Sohn, Immune Network, 2018, 18, e27 CrossRef.
- A. Tesniere, L. Apetoh, F. Ghiringhelli, N. Joza, T. Panaretakis, O. Kepp, F. Schlemmer, L. Zitvogel and G. Kroemer, Curr. Opin. Immunol., 2008, 20, 504–511 CrossRef CAS.
- J. P. van Vloten, S. T. Workenhe, S. K. Wootton, K. L. Mossman and B. W. Bridle, J. Immunol., 2018, 200, 450–458 CrossRef CAS.
- A. P. Castano, P. Mroz and M. R. Hamblin, Nat. Rev. Cancer, 2006, 6, 535–545 CrossRef CAS.
- P. Mroz, Y.-Y. Huang and M. Hamblin, Photodynamic therapy for cancer and activation of immune response, SPIE, 2010 Search PubMed.
- P. Mroz, A. Szokalska, M. X. Wu and M. R. Hamblin, PLoS One, 2010, 5, e15194 CrossRef CAS.
- D. Nowis, T. Stokłosa, M. Legat, T. Issat, M. Jakóbisiak and J. Gołąb, Photodiagn. Photodyn. Ther., 2005, 2, 283–298 CrossRef CAS.
- P. Mroz, A. Castano and M. Hamblin, Stimulation of dendritic cells enhances immune response after photodynamic therapy, SPIE, 2009 Search PubMed.
- C. M. Brackett and S. O. Gollnick, Photochem. Photobiol. Sci., 2011, 10, 649–652 RSC.
- E. Panzarini, V. Inguscio and L. Dini, BioMed Res. Int., 2013, 2013, 482160 Search PubMed.
- C. Wang, L. Xu, C. Liang, J. Xiang, R. Peng and Z. Liu, Adv. Mater., 2014, 26, 8154–8162 CrossRef CAS.
- Y. Yang, Y. Hu and H. Wang, Oxid. Med. Cell. Longevity, 2016, 2016, 5274084 Search PubMed.
- A. Castano, F. Gad, T. Zahra and M. Hamblin, Specific anti-tumor immune response with photodynamic therapy mediated by benzoporphyrin derivative and chlorin(e6), SPIE, 2003 Search PubMed.
- W. R. Chen, P. Mroz and M. R. Hamblin, presented in part at the Biophotonics and Immune Responses III, 2008.
- T. G. St Denis, K. Aziz, A. A. Waheed, Y. Y. Huang, S. K. Sharma, P. Mroz and M. R. Hamblin, Photochem. Photobiol. Sci., 2011, 10, 792–801 RSC.
- K. Berg, J. Golab, M. Korbelik and D. Russell, Photochem. Photobiol. Sci., 2011, 10, 647–648 RSC.
- S. Bharathiraja, P. Manivasagan, M. S. Moorthy, N. Q. Bui, K. D. Lee and J. Oh, Photodiagn. Photodyn. Ther., 2017, 19, 128–134 CrossRef CAS.
- A. Bucharskaya, G. Maslyakova, G. Terentyuk, A. Yakunin, Y. Avetisyan, O. Bibikova, E. Tuchina, B. Khlebtsov, N. Khlebtsov and V. Tuchin, Int. J. Mol. Sci., 2016, 17, 1295 CrossRef.
- T. Liu, C. Wang, W. Cui, H. Gong, C. Liang, X. Shi, Z. Li, B. Sun and Z. Liu, Nanoscale, 2014, 6, 11219–11225 RSC.
- J. Oh, H. Yoon and J.-H. Park, Biomed. Eng. Lett., 2013, 3, 67–73 CrossRef.
- B. Poinard, S. Z. Y. Neo, E. L. L. Yeo, H. P. S. Heng, K. G. Neoh and J. C. Y. Kah, ACS Appl. Mater. Interfaces, 2018, 10, 21125–21136 CrossRef CAS.
- X. Wei, H. Chen, H. P. Tham, N. Zhang, P. Xing, G. Zhang and Y. Zhao, ACS Appl. Nano Mater., 2018, 1, 3663–3672 CrossRef CAS.
- J. Xu, L. Xu, C. Wang, R. Yang, Q. Zhuang, X. Han, Z. Dong, W. Zhu, R. Peng and Z. Liu, ACS Nano, 2017, 11, 4463–4474 CrossRef CAS.
- E. L. L. Yeo, P. S. P. Thong, K. C. Soo and J. C. Y. Kah, Nanoscale, 2018, 10, 2461–2472 RSC.
- X. Yu, D. Gao, L. Gao, J. Lai, C. Zhang, Y. Zhao, L. Zhong, B. Jia, F. Wang, X. Chen and Z. Liu, ACS Nano, 2017, 11, 10147–10158 CrossRef CAS.
- A. D. Garg, D. Nowis, J. Golab and P. Agostinis, Apoptosis, 2010, 15, 1050–1071 CrossRef CAS.
- J. R. Melamed, R. S. Edelstein and E. S. Day, ACS Nano, 2015, 9, 6–11 CrossRef CAS.
- W. Li, J. Yang, L. Luo, M. Jiang, B. Qin, H. Yin, C. Zhu, X. Yuan, J. Zhang, Z. Luo, Y. Du, Q. Li, Y. Lou, Y. Qiu and J. You, Nat. Commun., 2019, 10, 3349 CrossRef.
- Y. Li, X. Liu, W. Pan, N. Li and B. Tang, Chem. Commun., 2020, 56, 1389–1392 RSC.
- E. E. Sweeney, J. Cano-Mejia and R. Fernandes, Small, 2018, 14, e1800678 CrossRef.
- Q. Chen, L. Xu, C. Liang, C. Wang, R. Peng and Z. Liu, Nat. Commun., 2016, 7, 13193 CrossRef CAS.
- C. M. Fares, E. M. Van Allen, C. G. Drake, J. P. Allison and S. Hu-Lieskovan, Am. Soc. Clin. Oncol. Educ. Book, 2019, 147–164, DOI:10.1200/EDBK_240837.
- J. Gunther, J. Dabritz and E. Wirthgen, Front. Immunol., 2019, 10, 1801 CrossRef.
- E. L. L. Yeo, J. U. J. Cheah, B. Y. Lim, P. S. P. Thong, K. C. Soo and J. C. Y. Kah, ACS Biomater. Sci. Eng., 2017, 3, 1039–1050 CrossRef CAS.
- E. L. L. Yeo, J. U. Cheah, D. J. H. Neo, W. I. Goh, P. Kanchanawong, K. C. Soo, P. S. P. Thong and J. C. Y. Kah, J. Mater. Chem. B, 2017, 5, 254–268 RSC.
- C. J. Orendorff and C. J. Murphy, J. Phys. Chem. B, 2006, 110, 3990–3994 CrossRef CAS.
- J. C. Y. Kah, J. Chen, A. Zubieta and K. Hamad-Schifferli, ACS Nano, 2012, 6, 6730–6740 CrossRef CAS.
- N. D. Pennock, J. T. White, E. W. Cross, E. E. Cheney, B. A. Tamburini and R. M. Kedl, Adv. Physiol. Educ., 2013, 37, 273–283 CrossRef.
- M. Korbelik, B. Stott and J. Sun, Br. J. Cancer, 2007, 97, 1381–1387 CrossRef CAS.
- E. Reginato, P. Wolf and M. R. Hamblin, World J. Immunol., 2014, 4, 1–11 CrossRef.
- Y. Tanigaki, N. Terada, H. Kitamura, E. Kitano, K. Takemura, T. Yamamoto, Y. Mori, H. Akedo and H. Tanaka, Oncol. Rep., 1998, 5, 693–701 CAS.
- M. G. Lechner, S. S. Karimi, K. Barry-Holson, T. E. Angell, K. A. Murphy, C. H. Church, J. R. Ohlfest, P. Hu and A. L. Epstein, J. Immunother., 2013, 36(9), 477–489 CrossRef CAS.
- V. Thorsson, D. L. Gibbs, S. D. Brown, D. Wolf, D. S. Bortone, T. H. Ou Yang, E. Porta-Pardo, G. F. Gao, C. L. Plaisier, J. A. Eddy, E. Ziv, A. C. Culhane, E. O. Paull, I. K. A. Sivakumar, A. J. Gentles, R. Malhotra, F. Farshidfar, A. Colaprico, J. S. Parker, L. E. Mose, N. S. Vo, J. Liu, Y. Liu, J. Rader, V. Dhankani, S. M. Reynolds, R. Bowlby, A. Califano, A. D. Cherniack, D. Anastassiou, D. Bedognetti, Y. Mokrab, A. M. Newman, A. Rao, K. Chen, A. Krasnitz, H. Hu, T. M. Malta, H. Noushmehr, C. S. Pedamallu, S. Bullman, A. I. Ojesina, A. Lamb, W. Zhou, H. Shen, T. K. Choueiri, J. N. Weinstein, J. Guinney, J. Saltz, R. A. Holt, C. S. Rabkin, N. Cancer Genome Atlas Research, A. J. Lazar, J. S. Serody, E. G. Demicco, M. L. Disis, B. G. Vincent and I. Shmulevich, Immunity, 2018, 48, 812–830 CrossRef CAS e814.
- R. W. Melvold and R. P. Sticca, Surg. Oncol. Clin. N. Am., 2007, 16, 711–735 CrossRef , vii.
- Z. Ivan and G. Francesca, Curr. Immunol. Rev., 2009, 5, 311–325 CrossRef.
- C. S. Zent and M. R. Elliott, FEBS J., 2017, 284, 1021–1039 CrossRef CAS.
- D. S. Chen and I. Mellman, Immunity, 2013, 39, 1–10 CrossRef CAS.
- B. D. Chithrani and W. C. W. Chan, Nano Lett., 2007, 7, 1542–1550 CrossRef CAS.
- P. H. Pandya, M. E. Murray, K. E. Pollok and J. L. Renbarger, J. Immunol. Res., 2016, 2016, 4273943 Search PubMed.
- X. Qu, Y. Tang and S. Hua, Front. Immunol., 2018, 9, 563 CrossRef.
- S. A. Condotta and M. J. Richer, PLoS Pathog., 2017, 13, e1006618 CrossRef.
- S. I. Grivennikov and M. Karin, Ann. Rheum. Dis., 2011, 70(Suppl 1), i104–i108 CrossRef CAS.
- P. Berraondo, M. F. Sanmamed, M. C. Ochoa, I. Etxeberria, M. A. Aznar, J. L. Pérez-Gracia, M. E. Rodríguez-Ruiz, M. Ponz-Sarvise, E. Castañón and I. Melero, Br. J. Cancer, 2019, 120, 6–15 CrossRef CAS.
- C. Hernandez, P. Huebener and R. F. Schwabe, Oncogene, 2016, 35, 5931–5941 CrossRef CAS.
- J. W. Yu, S. Bhattacharya, N. Yanamandra, D. Kilian, H. Shi, S. Yadavilli, Y. Katlinskaya, H. Kaczynski, M. Conner, W. Benson, A. Hahn, L. Seestaller-Wehr, M. Bi, N. J. Vitali, L. Tsvetkov, W. Halsey, A. Hughes, C. Traini, H. Zhou, J. Jing, T. Lee, D. J. Figueroa, S. Brett, C. B. Hopson, J. F. Smothers, A. Hoos and R. Srinivasan, PLoS One, 2018, 13, e0206223 CrossRef.
Footnote |
| † Electronic supplementary information (ESI) available. See DOI: 10.1039/d0tb01953d |
| This journal is © The Royal Society of Chemistry 2020 |