 Open Access Article
Creative Commons Attribution 3.0 Unported Licence
Correction: Machine-learning-assisted screening of pure-silica zeolites for effective removal of linear siloxanes and derivatives
Shiru
Lin
a,
Yekun
Wang
b,
Yinghe
Zhao
a,
Luis R.
Pericchi
b,
Arturo J.
Hernández-Maldonado
*c and
Zhongfang
Chen
*a
aDepartment of Chemistry, University of Puerto Rico, Rio Piedras, San Juan, PR 00931, USA. E-mail: zhongfangchen@gmail.com
bDepartment of Mathematics, University of Puerto Rico, Rio Piedras, San Juan, PR 00931, USA
cDepartment of Chemical Engineering, University of Puerto Rico, Mayagüez Campus, Mayagüez, PR 00681, USA
First published on 23rd March 2020
Abstract
Correction for ‘Machine-learning-assisted screening of pure-silica zeolites for effective removal of linear siloxanes and derivatives’ by Shiru Lin et al., J. Mater. Chem. A, 2020, 8, 3228–3237.
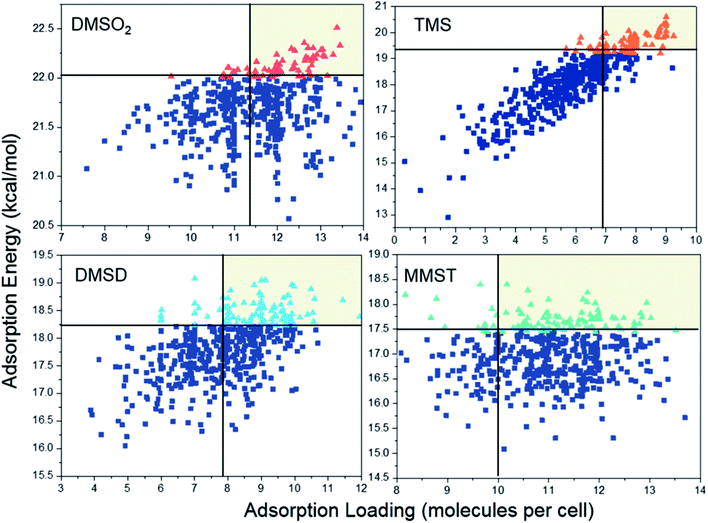
The authors regret that in the main manuscript and ESI, the unit for average loading was reported incorrectly. The correct unit for average loading should be “molecules per cell” instead of “mol” or “mol−1”, which includes:
(1) Page 3229, right column, line 5, “average adsorption loading (mol−1)” should be “average adsorption loading (molecules per cell)”.
(2) Page 3230, left column, line 24, “average adsorption loading (mol−1)” should be “average adsorption loading (molecules per cell)”.
(3) Page 3230, right column, line 3, “average adsorption loading (mol−1)” should be “average adsorption loading (molecules per cell)”.
(4) Table S1, “adsorption loading (L/mol)” should be “adsorption loading (L/molecules per cell)”.
(5). The corrected Fig. 1, Fig. 6, and Fig. S12 are provided below:
The Royal Society of Chemistry apologises for these errors and any consequent inconvenience to authors and readers.
| This journal is © The Royal Society of Chemistry 2020 |


