 Open Access Article
Structure, electrical conductivity and oxygen transport properties of Ruddlesden–Popper phases Lnn+1NinO3n+1 (Ln = La, Pr and Nd; n = 1, 2 and 3)†
Jia
Song‡
 a,
De
Ning§
b,
Bernard
Boukamp
 c,
Jean-Marc
Bassat
d and
Henny J. M.
Bouwmeester
 *aef
*aef
aElectrochemistry Research Group, Membrane Science and Technology, MESA+ Institute for Nanotechnology, University of Twente, P.O. Box 217, 7500 AE, Enschede, The Netherlands. E-mail: h.j.m.bouwmeester@utwente.nl
bHelmholtz-Zentrum Berlin für Materialien und Energie, Hahn-Meitner-Platz 1, 14109 Berlin, Germany
cInorganic Materials Science, MESA+ Institute for Nanotechnology, University of Twente, P.O. Box 217, 7500 AE, Enschede, The Netherlands
dCNRS, Université de Bordeaux, Institut de Chimie de la Matière Condensée de Bordeaux (ICMCB), 87 Av. Dr Schweitzer, F-33608 Pessac Cedex, France
eCAS Key Laboratory of Materials for Energy Conversion, Department of Materials Science and Engineering, University of Science and Technology of China, Hefei, 230026, P. R. China
fForschungszentrum Jülich GmbH, Institute of Energy and Climate Research-IEK-1, Leo-Brandt-Str. 1, D-52425, Jülich, Germany
First published on 1st October 2020
Abstract
Layered Ruddlesden–Popper (RP) lanthanide nickelates, Lnn+1NinO3n+1 (Ln = La, Pr and Nd; n = 1, 2 and 3), are considered potential cathode materials in solid oxide fuel cells. In this study, the thermal evolution of the structure, oxygen nonstoichiometry, electrical conductivity and oxygen transport properties of La2NiO4+δ, Nd2NiO4+δ, La3Ni2O7−δ, La4Ni3O10−δ, Pr4Ni3O10−δ and Nd4Ni3O10−δ are investigated. Phase transitions involving a disruption of the cooperative tilting of the perovskite layers in the low-temperature structure thereby transforming it to a more symmetric structure are observed in several of the materials upon heating in air. Pr4Ni3O10−δ and Nd4Ni3O10−δ show no phase transition from room temperature up to 1000 °C. High density ceramics (>96%) are obtained after sintering at 1300 °C and (for n = 2 and n = 3 members) post-sintering annealing at reduced temperatures. Data for the electrical conductivity measurements on these specimens indicate itinerant behaviour of the charge carriers in the RP nickelates. The increase in p-type conductivity with the order n of the RP phase is interpreted as arising from the concomitant increase in the formal valence of Ni. The observations can be interpreted in terms of a simple energy band scheme, showing that electron holes are formed in the σx2−y2↑ band upon increasing the oxidation state of Ni. Electrical conductivity relaxation measurements reveal remarkable similarities between the surface exchange coefficients (kchem) of the different RP phases despite the differences in the order parameter n and the nature of the lanthanide ion. Calculation of the oxygen self-diffusion coefficients (Ds) from the experimental values of the chemical diffusion coefficients (Dchem), using the corresponding data of oxygen non-stoichiometry from thermogravimetry measurements, shows that these are strongly determined by the order parameter n. The value of Ds decreases almost one order of magnitude on going from the n = 1 members La2NiO4+δ and Nd2NiO4+δ to the n = 2 member La3Ni2O7−δ, and again one order of magnitude on going to the n = 3 members La4Ni3O10−δ, Pr4Ni3O10−δ and Nd4Ni3O10−δ. The results confirm that oxygen-ion transport in the investigated RP nickelates predominantly occurs via an interstitialcy mechanism within the rock-salt layer of the structures.
1. Introduction
Layered Ruddlesden–Popper (RP) nickelates with the generic formula (LnNiO3)nLnO (Ln = La, Pr, Nd; n = 1, 2, 3) have attracted considerable interest for potential application as the cathode for intermediate-temperature solid oxide fuel cells (IT-SOFCs).1–7 Their crystal structures can be viewed as a stack of one rock-salt LnO layer with a finite number (n) of perovskite-type LnNiO3 layers along the principal crystallographic axis.The n = 1 members with composition Ln2NiO4+δ adopt the K2NiF4-type structure.8–13 A high concentration of interstitial oxygen is found in the rock-salt layers, which accounts for the highly anisotropic and fast diffusion of oxygen.14–17 The migration of oxygen in the crystal proceeds via an interstitialcy (or push pull) mechanism, whereby the oxygen vacancy formed at an apical site by the movement of apical oxygen to an interstitial site is filled by a nearby interstitial oxygen.17–19 Excellent thermal stability is found for La2NiO4+δ and Nd2NiO4+δ up to 1400 °C in air.20 SOFCs with cathode materials of La2NiO4+δ and Nd2NiO4+δ show no degradation in cell performance after hundreds of hours of operation at 750–800 °C.21,22 Pr2NiO4+δ, on the other hand, starts to decompose upon annealing in air above 580 °C to a mixture consisting of Pr4Ni3O10−δ, PrNiO3−δ and Pr6O11.23–31 Though apparent oxygen diffusion and surface exchange kinetics are enhanced after thermal decomposition,23 a significant degradation of cell performance is observed for the SOFC with Pr2NiO4+δ as the cathode after 1000 h of operation at 750 °C.22
Meanwhile, there is a growing interest in using higher order RP nickelates as the cathode material. Among the n = 2 members, Ln3Ni3O7−δ (Ln = La, Pr, Nd), so far only La3Ni2O7−δ could be prepared in a phase-pure form, while Pr3Ni2O7−δ and Nd3Ni2O7−δ have been observed only as disordered intergrowths in the corresponding n = 3 members.32 Several studies have investigated the electrode performance of RP-type lanthanum nickelates with controversial results. Using impedance spectroscopy on symmetric cells with La0.9Sr0.1Ga0.8Mg0.2O3−δ as the electrolyte, Amow et al.33 found that the area-specific resistance (ASR) in the temperature range 500–900 °C followed the trend La4Ni3O10−δ < La3Ni2O7−δ < La2NiO4+δ. This trend is consistent with that of the cell performance of Lan+1NinO3n+1/SDC/Ni-SDC cell configurations.13 However, such a trend was not observed in a comparative study on symmetric cells by Woolley et al.34 Sharma et al.3 showed that La3Ni2O7−δ would be a better cathode material than La4Ni3O10−δ based on ASR data of symmetric cells using GCO (Ce0.9Gd0.1O2−δ) as the electrolyte. Increasing the order n of the RP nickelates promotes electrical conductivity and long-term stability in the range 600–800 °C.4,13,33,35 Apart from material composition, the microstructure of the cathodes is found to play a key role in their performance.4,36
In this work, the structure, oxygen nonstoichiometry, electrical conductivity and oxygen transport of Lnn+1NinO3n+1 (Ln = La, Pr and Nd; n = 1, 2 and 3) are studied. Data on oxygen self-diffusion coefficients and ionic conductivities of La3Ni2O7−δ, La4Ni3O10−δ, Pr4Ni3O10−δ and Nd4Ni3O10−δ are reported for the first time. Pr2NiO4+δ, Pr3Ni2O7−δ and Nd3Ni2O7−δ are excluded from this work as the latter two compositions could not be prepared in a phase-pure form, while Pr2NiO4+δ fully decomposes after annealing in air above 580 °C, as alluded to above.
2. Experimental
2.1 Sample preparation
Powders of Lnn+1NinO3n+1 (Ln = La, Pr, Nd, n = 1, 2, 3) were prepared via a modified Pechini method as described elsewhere.37 Stoichiometric amounts of La(NO3)3·6H2O (Alfa Aesar, 99.9%), Pr(NO3)3·6H2O (Sigma-Aldrich, 99.9%), Nd(NO3)3·6H2O (Sigma-Aldrich, 99.9%) and Ni(NO3)2·6H2O (Sigma-Aldrich, 99.0–102.0%) were dissolved in water followed by the addition of C10H16N2O8 (EDTA, Sigma-Aldrich, >99%) and C6H8O7 (citric acid, Alfa Aesar, >99.5%) as chelating agents. The pH of the solution was adjusted to 7 using NH3·H2O solution (Sigma-Aldrich, 30 w/v%). After evaporating the water, the foam-like gel reached self-ignition at around 350 °C. The obtained raw powders were ground to fine powders and calcined under various conditions as shown in Table 1. The heating and cooling rates were 2 °C min−1. The obtained phase-pure powders were first ball-milled in ethanol using 2 mm ZrO2 balls for 2 days to enhance their sinterability before they were pelletized by uniaxial pressing at 25 MPa. Isostatic pressing of pellets was performed at 400 MPa for 2 min. All pellets were sintered at 1300 °C for 4 h in air, while a post-sintering annealing treatment was applied for La3Ni2O7−δ, La4Ni3O10−δ, Pr4Ni3O10−δ and Nd4Ni3O10−δ under the conditions listed in Table 1. The relative density of the pellets obtained was above 96% of their theoretical value as measured by Archimedes' method. The results were cross-checked by simple calculations based on the weight and geometric volume of the pellets.| Calcination | Sintering | Post-sintering annealing | |
|---|---|---|---|
| La2NiO4+δ | 1100 °C | 1300 °C | — |
| 4 h in air | 4 h in air | ||
| Nd2NiO4+δ | 1100 °C | 1300 °C | — |
| 4 h in air | 4 h in air | ||
| La3Ni2O7−δ | 1150 °C | 1300 °C | 1100 °C |
| 144 h in air | 4 h in air | 130 h in air | |
| La4Ni3O10−δ | 1050 °C | 1300 °C | 1050 °C |
| 132 h in air | 4 h in air | 230 h in air | |
| Pr4Ni3O10−δ | 1000 °C | 1300 °C | 1000 °C |
| 125 h in pure O2 | 4 h in air | 110 h in pure O2 | |
| Nd4Ni3O10−δ | 1000 °C | 1300 °C | 1000 °C |
| 125 h in pure O2 | 4 h in air | 170 h in pure O2 |
2.2 Phase analysis and surface morphology
The phase purity and crystal structure of the prepared powders and annealed dense pellets were studied by X-ray diffraction (XRD, D2 PHASER, Bruker) with Cu Kα1 radiation (λ = 1.54060 Å) in air. The surfaces of the annealed pellets were polished. Data were collected using the step-scan mode in the 2θ range of 20–80° with an increment of 0.01° and a counting time of 5 s. The thermal evolution of the structures was investigated in situ using HT-XRD (D8 Advance, Bruker) from 40 °C to 1000 °C with steps of 50–60 °C below 300 °C and steps of 25 °C at higher temperatures. The sample was heated to the desired temperature with a heating rate of 25 °C min−1. After a dwell time of 15 min, the HT-XRD patterns were recorded in the 2θ range of 20–90° with a step size of 0.015° and a counting time of 1.3 s. The FullProf software package was used for Rietveld refinements of the XRD patterns.38 Scanning electron microscopy (SEM) measurements were performed using a JEOL JSM-6010LA microscope, operated at a 5 keV accelerating voltage. The SEM images of the polished samples were recorded after thermal etching at 1000 °C for 2 h in air.2.3 Thermogravimetric analysis
Data of oxygen stoichiometry were collected by thermogravimetric analysis (TGA) of the powders in the pO2 range of 0.045–0.90 atm between 700 °C and 900 °C with intervals of 25 °C, using a Netzsch STA F3 Jupiter. Measurements were conducted using 2000–3000 mg of powder. Data were collected at 4.5, 10, 21, 42, and 90% O2 in N2, which correspond to values of the pO2 of the gas streams used in the electrical conductivity relaxation (ECR) experiments. The heating and cooling rates were 5 °C min−1 and 3 °C min−1, respectively. At the end of each TGA experiment, the powder was held at 100 °C in synthetic air for 3 h. Approximately 30 mg of the powder was subsequently transferred to a Mettler Toledo 851e TGA system to determine the absolute oxygen stoichiometry of the sample by thermal reduction in hydrogen (16% H2/Ar).2.4 Electrical conductivity relaxation
Samples for ECR measurements were prepared by grinding and cutting the obtained dense pellets to planar-sheet-shaped sample bars with approximate dimensions of 12 × 5 × 0.5 mm3. The sample surfaces were polished down to 0.5 μm using diamond polishing discs (JZ Primo, Xinhui China). A four-probe DC method was used to collect data on electrical conductivity. Two gold wires (Alfa Aesar, 99.999%, ∅ = 0.25 mm) were wrapped around the ends of the sample bar for current supply. Two additional gold wires were wrapped 1 mm away from the current electrodes to act as the voltage probes. To ensure good contact between the gold wires and the sample, sulfur-free gold paste (home-made) was applied to the gaps between the sample surface and the gold wires. Finally, the sample was annealed at 950 °C in air for 1 h to sinter the gold paste and to thermally cure the polished sample surface.The sample was mounted on a holder and placed in an alumina sample containment chamber (or reactor). Two gas streams, each of which had a flow rate of 280 ml min−1, with a different pO2 were created by mixing dried oxygen and nitrogen in the desired ratios using Brooks GF040 mass flow controllers. A pneumatically operated four-way valve was used to instantaneously switch between both gas streams so that one of them was fed through the reactor. Data on the transient electrical conductivity was collected following oxidation and reduction step changes in pO2 between 0.10 and 0.21 atm. Measurements were conducted following stepwise cooling from 900 °C to 650 °C with intervals of 25 °C, heating/cooling rates of 10 °C min−1 and a dwell time of 60 min at each temperature before data acquisition.
The transient conductivity after each pO2 step change was normalized according to eqn (1) and fitted to eqn (2)–(4) to obtain the chemical diffusion coefficient Dchem and the surface exchange coefficient kchem.
 | (1) |
 | (2) |
 | (3) |
 | (4) |
In these equations, g(t) is the normalized conductivity, σ0 and σ∞ are the conductivities σ(t) at time t = 0 and t = ∞, respectively, τf is the flush time, and 2bi is the sample dimension along coordinate i, whilst the values of βm,i are the non-zero roots of eqn (4). Lc = Dchem/kchem is the critical thickness below which oxygen surface exchange prevails over bulk oxygen diffusion in determining the rate of re-equilibration after a pO2 step change. The flush time τf was calculated from
 | (5) |
3. Results and discussion
3.1 Synthesis and consolidation
The calcination, sintering and post-sintering annealing conditions of the different RP nickelates investigated in this work are compiled in Table 1. The powders obtained were calcined in air apart from the powders of Pr4Ni3O10−δ and Nd4Ni3O10−δ, which could only be prepared in a phase-pure form by calcination at 1000 °C under flowing oxygen. The latter is considered consistent with observations by Vibhu et al.4 Using thermogravimetric analysis, these authors showed decomposition of Pr4Ni3O10−δ into Pr2NiO2+δ and NiO upon heating (2 °C min−1) under air above 1050 °C, but above 1120 °C when these experiments were conducted under oxygen. Note from Table 1 that long annealing times (125–144 h) are required for the n = 2 and n = 3 RP nickelates to obtain phase-pure powders.A sintering temperature of 1300 °C was found necessary to sinter pressed powder compacts of the RP nickelates to high density (>96%). It should be noted that this temperature is well above the reported decomposition temperatures of the n = 2 and n = 3 members La3Ni2O7−δ, La4Ni3O10−δ, Pr4Ni3O10−δ and Nd4Ni3O10−δ.4,35,41,42 The cited studies demonstrated that decomposition into the n = 1 member (and NiO) occurs which, as expected, has improved sintering behaviour over the n = 2 and n = 3 members. In an attempt to regain the pure phases of La3Ni2O7−δ, La4Ni3O10−δ, Pr4Ni3O10−δ and Nd4Ni3O10−δ, a post-sintering annealing step was performed at a lower temperature, as indicated in Table 1. Annealing times between 110 and 230 h were necessary to obtain almost single-phase materials. The phase purity of the samples obtained after post-sintering annealing was studied by XRD, which is discussed in the next section.
3.2 Crystal structure and phase transitions
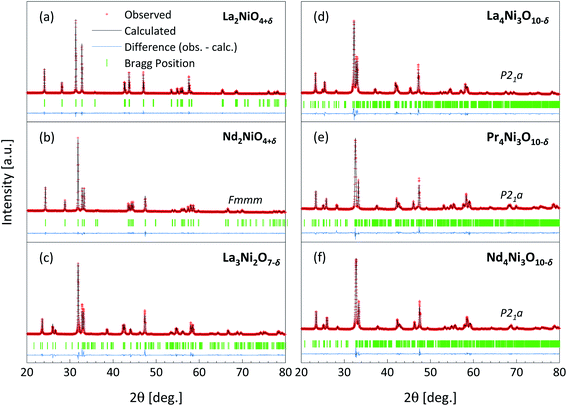
Fig. 1 shows the results of Rietveld refinements of the room-temperature XRD patterns of the prepared powders. All compositions appear to be single-phase as no diffraction peaks of impurity phases can be detected. The refined values of the lattice parameters and reliability factors for the different compositions are given in Table 2. The cell parameters for all compositions are in good agreement with those reported previously in the literature.5,10,41,43–47 The crystallographic parameters obtained from the Rietveld refinements are listed in Table S1.† The corresponding structures of the RP nickelates are shown in Fig. 2.| La2NiO4+δ | Nd2NiO4+δ | La3Ni2O7−δ | La4Ni3O10−δ | Pr4Ni3O10−δ | Nd4Ni3O10−δ | |
|---|---|---|---|---|---|---|
| Space group | Fmmm | Fmmm | Cmmm | P21a | P21a | P21a |
| a/Å | 5.4608(7) | 5.44647(7) | 5.39431(5) | 5.4160(1) | 5.37556(5) | 5.36373(5) |
| b/Å | 5.4612(7) | 5.377711(7) | 5.45002(6) | 5.4656(1) | 5.46462(6) | 5.45221(7) |
| c/Å | 12.67758(8) | 12.36233(18) | 20.5264(2) | 27.9750(6) | 27.5463(3) | 27.4100(3) |
| β/° | 90 | 90 | 90 | 90.179(1) | 90.283(1) | 90.292(1) |
| V/Å3 | 378.098(2) | 362.0475(4) | 603.4595(3) | 828.112(1) | 809.1756(5) | 801.5767(4) |
| R wp/% | 13.9 | 11.8 | 18.1 | 14.7 | 12.6 | 11.0 |
| R exp/% | 11.7 | 8.28 | 8.77 | 5.87 | 7.04 | 4.48 |
| R Bragg/% | 2.37 | 2.96 | 7.39 | 6.57 | 5.14 | 3.19 |
| χ 2 | 1.942 | 2.025 | 4.259 | 6.271 | 3.203 | 6.338 |
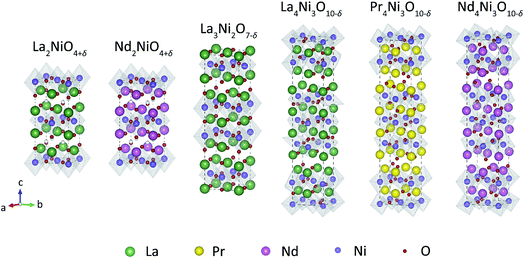 | ||
| Fig. 2 Unit cells of RP phases Lnn+1NinO3n+1 (Ln = La, Pr, Nd; n = 1, 2, 3) obtained from Rietveld refinements of the room temperature XRD powder patterns. | ||
The X-ray diffractograms of La2NiO4+δ and Nd2NiO4+δ can be fitted in the orthorhombic space group Fmmm, which is in good agreement with previous analyses of data from synchrotron X-ray powder diffraction (SXRPD) and neutron powder diffraction (NPD) of both materials.10,44,45 The XRD pattern of La3Ni2O7−δ can be fitted in the orthorhombic space group Cmmm, consistent with the results from Mössbauer spectroscopy and XRD by Kiselev et al.46 The XRD patterns of the n = 3 RP nickelates were fitted using the monoclinic space group P21a, which is in agreement with the results from high-resolution SXRPD and NPD.5,41,43,47 The lattice parameters of the n = 3 members are found to increase in the order Nd4Ni3O10−δ < Pr4Ni3O10−δ < La4Ni3O10−δ. The corresponding crystal structures become more distorted in the reverse order as can be derived from the value of the monoclinic angle (β) obtained from the refinements. The degree of structural distortion can be linked to the size of the lanthanide ion.32,48,49
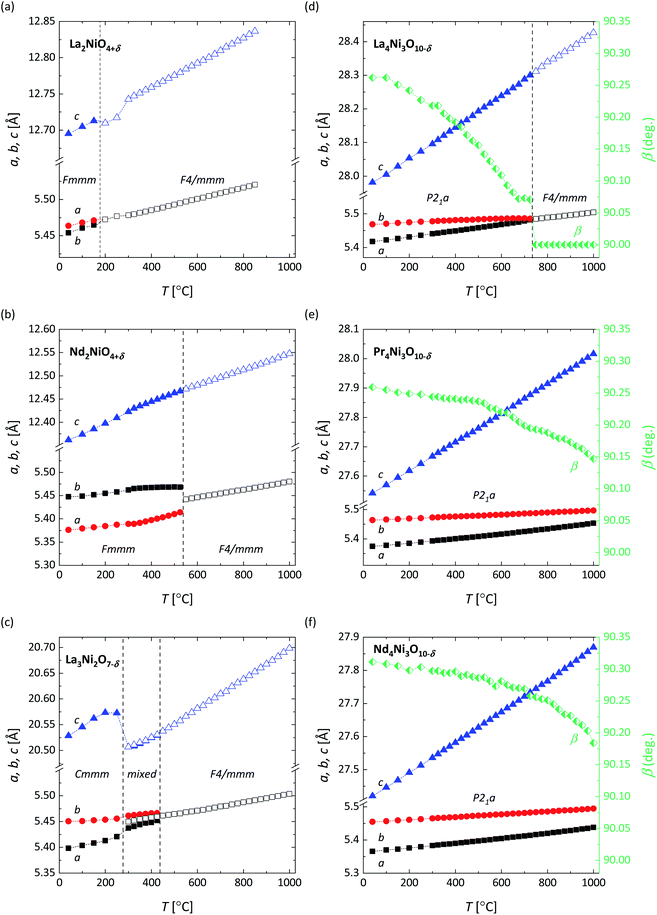
Fig. 3 shows the HT-XRD pattern of Pr4Ni3O10−δ recorded in air from 40 °C to 1000 °C. The patterns for the other compositions investigated in this work are shown in Fig. S1–S5.† All compositions are found to be phase-pure, i.e., no impurity peaks are observed up to 1000 °C. Fig. 4 shows the lattice parameters obtained from refinement of the HT-XRD patterns. The thermal evolution of the structure of the RP nickelates is discussed below. In several of these, a phase transition is observed, driven by a disruption of the cooperative tilting of the NiO6 octahedra in the low-temperature structure transforming it to a more symmetric structure at elevated temperature.50 It should be noted that the appearance of the phase transition may be influenced by the degree of oxygen nonstoichiometry of the material under the conditions of the experiment.51,52
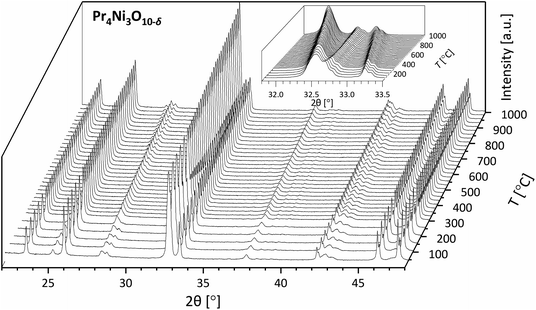 | ||
| Fig. 3 In situ HT-XRD patterns of Pr4Ni3O10−δ (powder) between 22° and 48° recorded in air from 40 °C to 1000 °C. The inset shows the magnification of the peaks between 31.8–33.5°. | ||
n = 1 RP nickelates
La2NiO4+δ shows a phase transition from orthorhombic (Fmmm) to tetragonal (F4/mmm) at approximately 175 °C, as can be derived from the data in Fig. 4a. This result is consistent with that found by in situ high-temperature NPD measurements.10,53 Due to the relatively small orthorhombic distortion (approximately 0.1% difference between cell parameters a and b), the separation between the orthorhombic (2 0 0) and (0 2 0) peaks is hardly noticeable (see the inset of Fig. S1†).
The Rietveld refinements of the HT-XRD patterns of Nd2NiO4+δ (Fig. 4b) reveal a phase transition from orthorhombic (Fmmm) to tetragonal (F4/mmm) at around 550 °C. This temperature is about 50 °C lower than that evaluated for Nd2NiO4+δ by means of HT-XRD by Toyosumi et al.52
n = 2 RP nickelates
For La3Ni2O7−δ, a gradual merging of the peaks at around 33° is observed with increasing temperature from 300 °C to 450 °C (Fig. S3†), suggesting a phase transition in this temperature range. The HT-XRD patterns of the high-temperature phase of La3Ni2O7−δ can be well-fitted using the tetragonal space group F4/mmm. The results of the Rietveld refinements of the HT-XRD patterns in Fig. 4c confirm an orthorhombic (Cmmm) to tetragonal (F4/mmm) phase transition at around 300 °C. A mixture of Cmmm and F4/mmm phases is found between 300 °C and 450 °C. The refined weight percentages of the two phases at different temperatures are listed in Table 3.
| Wt% | 300 °C | 325 °C | 350 °C | 375 °C | 400 °C | 425 °C | 450 °C |
|---|---|---|---|---|---|---|---|
| Cmmm | 97.75 | 97.28 | 97.05 | 53.77 | 40.73 | 19.16 | 7.64 |
| F4/mmm | 2.25 | 2.72 | 2.95 | 46.23 | 59.27 | 80.84 | 92.36 |
n = 3 RP nickelates
The results of the refinements of the HT-XRD patterns of La4Ni3O10−δ reveal a phase transition from monoclinic (P21a) to tetragonal (F4/mmm) at around 750 °C, as shown in Fig. 4d. The observed phase transition temperature is found to be in good agreement with that reported by Nagell et al.43
The HT-XRD patterns of Pr4Ni3O10−δ in Fig. 3 show no phase transition in the experimental temperature region. The (2 0 0) and (0 2 0) peaks approach each other up to the highest temperature of the measurements, confirming that the structure of Pr4Ni3O10−δ remains monoclinic (P21a) up to 1000 °C. The refined monoclinic angle decreases from 99.25° at 40 °C to 90.15° at 1000 °C, as shown in Fig. 4e.
Similar to Pr4Ni3O10−δ, the crystal structure of Nd4Ni3O10−δ appears to be monoclinic (P21a) in the temperature range 40–1000 °C. The corresponding results of the refinements of the HT-XRD patterns are shown in Fig. 4f.
The phase purity of the sintered samples was analyzed by XRD. No impurities were found in samples La2NiO4+δ and Nd2NiO4+δ. The XRD patterns of consolidated samples La3Ni2O7−δ, La4Ni3O10−δ, Pr4Ni3O10−δ and Nd4Ni3O10−δ obtained after post-sintering annealing are shown in Fig. 5. Rietveld refinements confirm the presence of minor impurities in these samples. The corresponding results are listed in Table S2.† As discussed above, the presence of impurities in these samples is assigned to (partial) thermal decomposition at the applied sintering temperatures (cf. Table 1). Over 96 wt% of the main phase is obtained after post-sintering annealing. More specifically, 2.2 wt% of the n = 1 RP phase is found to be an impurity in the sintered pellet of La3Ni2O7−δ, 1.9 wt% in that of La4Ni3O10−δ and 3.6 wt% in that of Nd4Ni3O10−δ. 4.0 wt% of the Pr6O11 impurity is found in the Pr4Ni3O10−δ pellet. No evidence of NiO is found in the diffractograms, despite the stoichiometric ratio for the n = 2 and n = 3 RP nickelates suggesting the formation of NiO as the by-product of the decomposition reaction into the n = 1 member during sintering at 1300 °C. The absence of NiO in the samples after subsequent post-sintering annealing to reform the higher-order RP phase may be due either to volatility of NiO54–56 or its weaker contribution to scattering compared with rare-earth oxides. In none of the sintered samples was evidence found for a preferred orientation (i.e., crystallographic texture), suggesting that grains in the sintered materials are randomly oriented. Furthermore, to the best of our knowledge, this is the first report of sintered bodies of the above-mentioned n = 2 and n = 3 RP nickelates with such a high purity (>96 wt%) and high density (>96%).
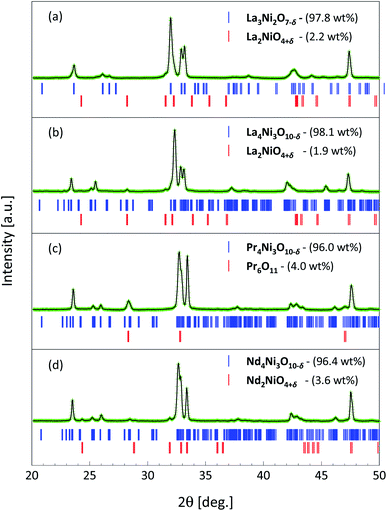 | ||
| Fig. 5 Rietveld refinements (green crosses) of the room temperature X-ray diffractograms (black lines) of polished dense pellets of (a) La3Ni2O7−δ, (b) La4Ni3O10−δ, (c) Pr4Ni3O10−δ, and (d) Nd4Ni3O10−δ after post-sintering annealing (cf. Table 1). Minor impurities are found in the pellets and their refined weight percentages are indicated in brackets. Bragg positions of the main phases and impurities are indicated as vertical bars. | ||
3.3 Oxygen nonstoichiometry
Fig. 6 shows the data of TGA measurements of Nd2NiO4+δ under a reducing atmosphere. Similar data were obtained for La2NiO4+δ, La4Ni3O10−δ, Pr4Ni3O10-δ and Nd4Ni3O10−δ and are presented in Fig. S6–S9.† In agreement with the literature reports, a two-step reduction process is found for all compositions.4,32,57–59 The final decomposition products are assumed to be Ln2O3 and Ni. The decomposition reaction can thus be represented as | (6) |
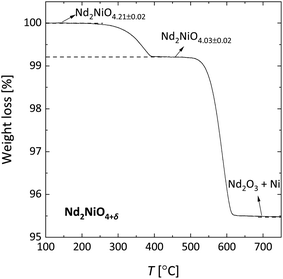 | ||
| Fig. 6 TGA weight loss curve recorded for Nd2NiO4+δ in 16% H2/Ar. The oxygen nonstoichiometries as indicated were calculated using the oxide reduced to Nd2O3 and Ni as the reference state. | ||
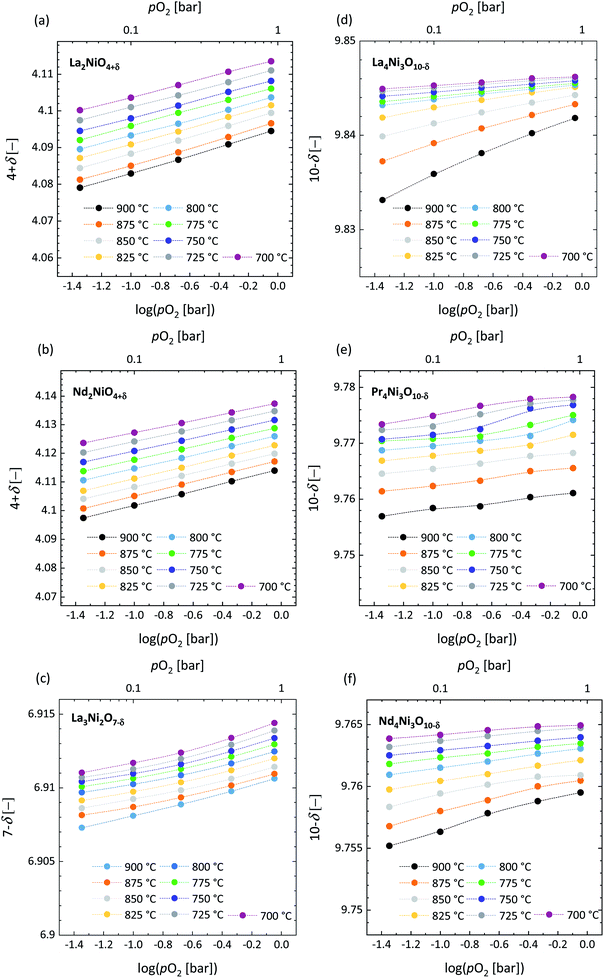
The initial (i.e., room temperature) oxygen nonstoichiometries calculated using the oxide reduced in 16% H2/Ar as the reference state are listed in Table 4. It should be noted that, in general, the oxygen stoichiometry may be influenced by the thermal history of the powder. Note further from Table 4 that oxygen hyper-stoichiometry is found for La2NiO4+δ and Nd2NiO4+δ, while oxygen hypo-stoichiometry is found for all other investigated compositions.
Good agreement is obtained between the value of δ for La4Ni3O10−δ and that evaluated from the data of near-edge X-ray absorption spectroscopy (XANES).60 Somewhat larger values of δ are found for Pr4Ni3O10−δ and Nd4Ni3O10−δ in this study when compared to the corresponding values reported for oxygen-cooled samples.32,41
The pO2 dependence of the oxygen nonstoichiometry was investigated in the range of 0.045–0.900 atm at temperatures of 700–900 °C. The corresponding data are shown in Fig. 7. The corresponding weight loss curves are presented in Fig. S10–S14.† Excellent agreement with the literature data is found for La2NiO4+δ and Nd2NiO4+δ,61,62 as demonstrated in Fig. S15.†
3.4 Electrical conductivity
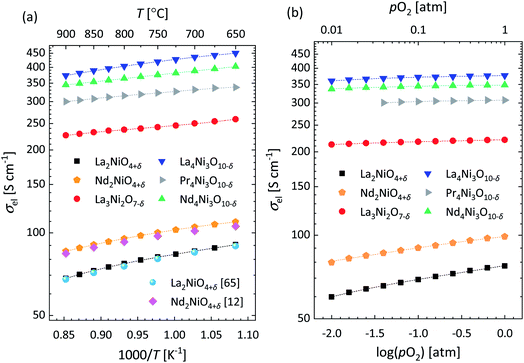
Arrhenius plots of the electrical conductivity (σel) of the investigated RP Lnn+1NinO3n+1 nickelates, measured in air in the range 650–900 °C, are shown in Fig. 8a. As illustrated in this figure, excellent agreement is obtained with the published data for La2NiO4+δ and Nd2NiO4+δ.12,63 For La3Ni2O7−δ, La4Ni3O10−δ, Pr4Ni3O10−δ and Nd4Ni3O10−δ, however, noticeably higher values of σel are found compared with those reported in the literature.4,33,64,65 A comparison of the data from this study with the corresponding data from the literature, at 750 °C in air, is shown in Table S3.† The observed discrepancies can be ascribed, in part, to small differences in composition (e.g. impurities), but more likely to the much higher densities (>96%) of the samples used in the present study when compared with those used in the cited studies (cf. Table S3†). Fig. 8b shows the pO2 dependence of σel, at 900 °C, in the range of 0.01–1 atm. For all the investigated compositions, σel is found to decrease with decreasing pO2, which on the log scale is the most pronounced for the n = 1 RP phases La2NiO4+δ and Nd2NiO4+δ, exhibiting the lowest conductivities. Note further from Fig. 8a and b that within the range of temperature and oxygen partial pressure, σel of Lnn+1NinO3n+1 increases with the order n.La2NiO4+δ and Nd2NiO4+δ are typical p-type conductors as confirmed by their positive Seebeck coefficients in a wide range of temperature.12,66 Their electrical conductivities display a broad maximum in the range 400–450 °C without discontinuous changes in the Seebeck coefficients, which is frequently interpreted in terms of a metal–semiconductor transition.12,66 This interpretation has been contested by several authors as the loss in oxygen occurring at elevated temperature brings about a concomitant decrease in the charge carrier density.67,68
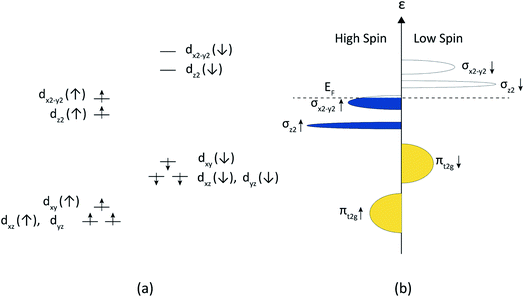
The strongly correlated charge carriers in the RP nickelates and related transition metal oxides may be viewed as intermediate between localized and delocalized. Goodenough et al.69,70 proposed the coexistence of localized and itinerant electrons in La2NiO4+δ. The bonding orbitals with εg (dx2−y2,dz2) symmetry are assumed to be split by the tetragonal distortion into a localized σz2 orbital and a more delocalized σx2−y2 band. Electron–electron correlation leads to further splitting of these into low and high spin states, which is more profound for the narrow σz2 orbitals and less for the σx2−y2 and the lower energy πt2g (derived from dxy,dxz,dyz) bands, as schematically shown in Fig. 9. Nakamura et al.12,66 used this band scheme to account for the electrical transport properties of La2−xSrxNiO4+δ (x = 0, 0.2, 0.4) and Nd2−xSrxNiO4+δ (x = 0, 0.2 0.4). The electrical conductivity is found to increase significantly upon partial substitution of La with Sr. Semi-quantitative analysis of the data of oxygen nonstoichiometry, electrical conductivity and Seebeck coefficients supports the itinerant behavior of the electrons at high temperature in both series. A similar band scheme has been proposed to interpret the data of electrical conductivity and magnetic susceptibility of La3Ni2O7−δ (ref. 71) and Ln4Ni3O10−δ (Ln = La, Pr, Nd).32 Below, we show that the band scheme in Fig. 9 can also be used to interpret the data of the electrical conductivity of phases Lnn+1NinO3n+1, ignoring possible hybridization of the nickel 3d and oxygen 2p orbitals when increasing the formal valence of Ni and the 3D character of the structure of Lnn+1NinO3n+1 (i.e., with increasing n), as was suggested by Zhang and Greenblatt.32
In accord with the band scheme shown in Fig. 9, the conduction in the RP phases Lnn+1NinO3n+1 is metal-like. The σx2−y2↑ band is completely filled with electrons when the formal valence of Ni is +2 (corresponding to a d8 configuration). The higher the formal valence of Ni, the lower the Fermi level (EF), increasing the density of states (DOS) near EF. Noting that only those electrons in a small energy range near EF contribute to electrical transport, the electrical conductivity thus increases with an increase in the formal valence of Ni.
As an example, under air and in the temperature range 700–900 °C covered by our TGA experiments, the Ni formal valence in phases Lan+1NinO3n+1 ranges from 2.217 to 2.168 for n = 1, from 2.413 to 2.409 for n = 2, and from 2.564 to 2.559 for n = 3. These results indicate that under the given conditions, the conductivity remains p-type. In accordance with the proposed band scheme, p-type conductivity persists if there is less than one hole per Ni. Only when the Ni formal valence becomes higher than 3 does the conductivity become n-type (provided that the σx2−y2↑ does not become fully hybridized with the O-2p band). There are, however, many influences, such as interatomic distances, the presence of lattice defects (e.g. oxygen vacancies), disorder (i.e., the range of atomic orbital energies) and inter-electron repulsion, which can cause the electron states to become more localized than the band scheme in Fig. 9 suggests.72 A more detailed analysis of the electrical conductivity of the RP Lnn+1NinO3n+1 nickelates requires data from high temperature Seebeck and Hall coefficient measurements.
3.5 Electrical conductivity relaxation
ECR experiments were conducted for evaluation of the oxygen transport properties of the RP nickelates. Fig. 10 shows the typical normalized conductivity relaxation curves recorded, at 900 °C, after a pO2 step change from 0.10 atm to 0.21 atm, along with the fitted curves. Note from this figure that slower re-equilibration after the pO2 step change occurs for the higher order members.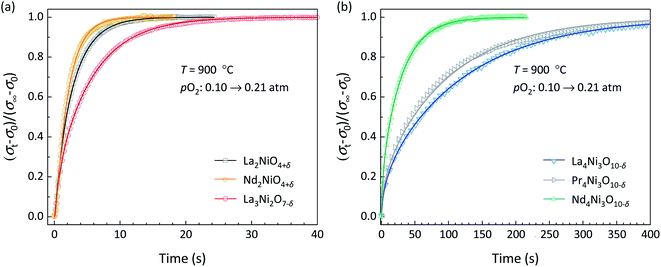 | ||
| Fig. 10 Typical conductivity relaxation profiles of (a) La2NiO4+δ, Nd2NiO4+δ, and La3Ni2O7−δ and (b) La4Ni3O10−δ, Pr4Ni3O10−δ, and Nd4Ni3O10−δ, at 900 °C, after a pO2 step change from 0.10 atm to 0.21 atm. Full lines represent the corresponding curve fits to eqn (2)–(4). | ||
Curve fitting allows simultaneous determination of Dchem and kchem, provided that fitting is sensitive to both parameters. As a rule of thumb, though, depending on the accuracy of the collected data, both parameters can be reliably assessed if the Biot number (Bi), defined as
 | (7) |
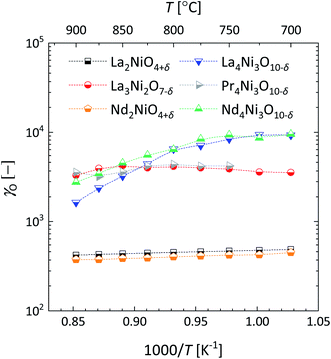
Fig. 11 shows the temperature dependence of the Biot numbers calculated from the values of Dchem and kchem obtained from fitting of the conductivity relaxation curves measured for the different RP nickelates. As seen from this figure, the Biot numbers obtained for the n = 1 and n = 2 members in the series are in the mixed-controlled region. However, those of the n = 3 members are significantly higher than 30, decreasing the accuracy of assessing the values for kchem. The Biot numbers for Pr4Ni3O10−δ could not be calculated as an accurate value of kchem could not be obtained from fitting.
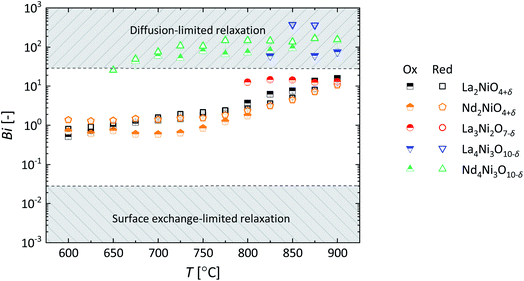 | ||
| Fig. 11 Temperature dependence of the Biot number (Bi) of materials investigated in this work. As explained in the main text, Biot numbers could not be calculated for Pr4Ni3O10−δ. | ||
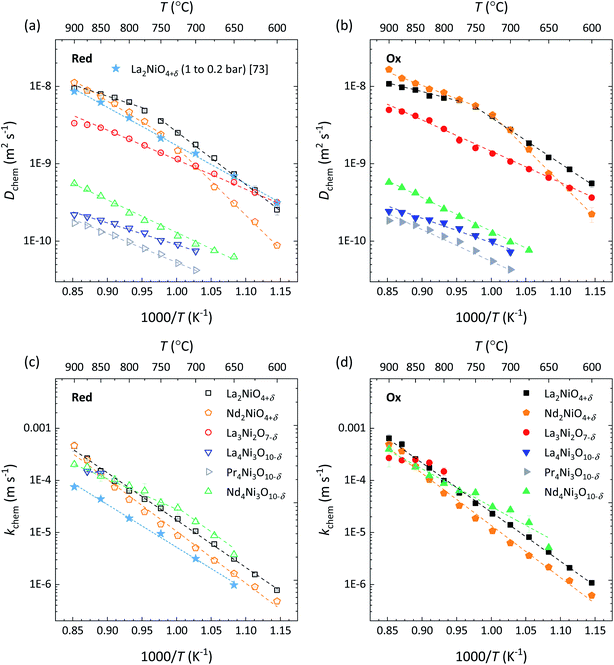
Fig. 12 shows the Arrhenius plots of Dchem and kchem of the RP nickelates investigated in this work. In general, fair to good agreement is noted between the values extracted from oxidation and reduction step changes in pO2. Values for Dchem of La2NiO4+δ are found to be in good agreement with those reported in the literature.73 Somewhat surprising at first glance is that the RP nickelates exhibit similar kchem values (Fig. 12c and d), despite the presence of different lanthanide ions, differences in the structural ordering, and, as discussed below, different magnitudes of the oxygen self-diffusion coefficient, and associated ionic conductivity, displayed by the RP phases. Moreover, we examined the SEM images of the samples after completion of the series of ECR experiments (carried out at different temperatures and oxygen partial pressures) and detected significant morphological changes in the surface relative to that of polished samples. As examples, the corresponding SEM images for La2NiO4+δ, La3Ni2O7−δ and La4Ni3O10−δ are shown in Fig. S16.† The nature and cause of the morphological changes and their possible influence on the apparent surface exchange rates of the RP nickelates are currently under investigation in our laboratory.
3.6 Self-diffusion coefficient and ionic conductivity
Apparent oxygen self-diffusion coefficients (Ds) were calculated from the measured values of Dchem, using the relationship39| Dchem = γODs | (8) |
 | (9) |
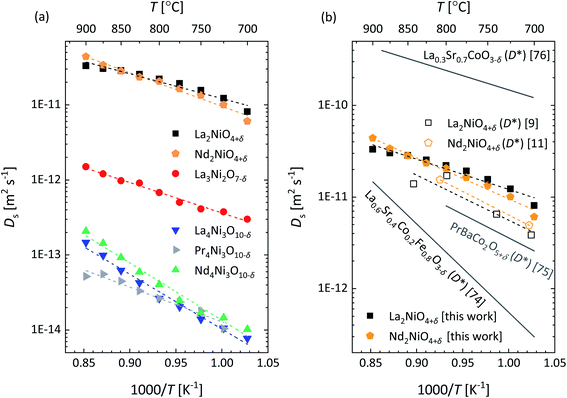
The Arrhenius plots of Ds obtained for the different RP nickelates are given in Fig. 14a. Activation energies obtained from least squares fitting of the plots are listed in Table 5. As seen from Fig. 14a, similar values of Ds are found for La2NiO4+δ and Nd2NiO4+δ. Fig. 14b compares these with those derived from the data of tracer diffusion experiments. Ignoring possible correlation factors, good agreement is noted.9,11 Note further from Fig. 14b that the Ds values obtained for La2NiO4+δ and Nd2NiO4+δ exceed those measured for La0.6Sr0.4Co0.2Fe0.8O3−δ (LSCF)9,74 and PrBaCo2O5+δ,75 but are almost one order of magnitude below those reported for La0.3Sr0.7CoO3−δ.76 Ionic conductivities of the RP nickelates calculated from the apparent values of Ds (Fig. 14a) using the Nernst–Einstein equation are shown in Fig. 15.
| Materials | E a (eV) | R 2 (—) |
|---|---|---|
| La2NiO4+δ | 0.65 ± 0.05 | 0.95 |
| Nd2NiO4+δ | 0.88 ± 0.04 | 0.98 |
| La3Ni2O7−δ | 0.80 ± 0.03 | 0.98 |
| La4Ni3O10−δ | 1.44 ± 0.07 | 0.98 |
| Pr4Ni3O10−δ | 0.91 ± 0.08 | 0.95 |
| Nd4Ni3O10−δ | 1.51 ± 0.07 | 0.98 |
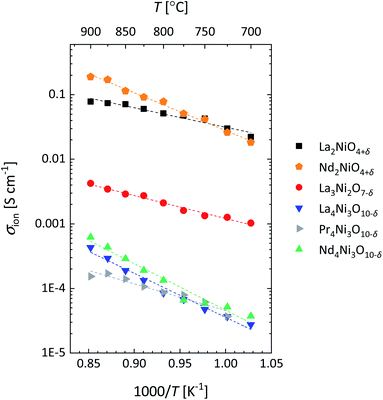 | ||
| Fig. 15 Arrhenius plots of the ionic conductivity (σion) of RP nickelates investigated in this work. Ionic conductivities were calculated from the values of Ds (Fig. 14a) using the Nernst–Einstein equation. | ||
Most notable from Fig. 14a is the sequence of the magnitude of Ds observed for the n = 1, n = 2 and n = 3 members of the RP nickelates, differing by almost one order of magnitude from each other. The highest values are found for Lnn+1NinO3n+1 with Ln = La, Nd and n = 1 and the lowest are found for Ln = La, Pr, Nd and n = 3. To account for this observation, it is recalled that oxygen migration in the RP structures is believed to occur in the rock salt layers via a cooperative interstitialcy mechanism.14,17–19,77–81 The apparent value of Ds reflects an ensemble property, being averaged over all oxygen ions (interstitial, apical and equatorial) in the lattice. As alluded to before, oxygen hyper-stoichiometry (δ > 0) is found for the n = 1 RP nickelates, which is accommodated by oxygen interstitials in the rock salt layers. Higher concentrations of oxygen interstitials will lead to higher values for Ds and the associated ionic conductivity (σion). The n = 2 and n = 3 RP nickelates, on the other hand, exhibit oxygen hypo-stoichiometries (δ < 0). The intrinsic disorder in the RP nickelates is known to be of the anti-Frenkel type, with oxygen vacancies preferably residing on equatorial sites.14,82–84 Due to the oxygen hypo-stoichiometry, the concentration of oxygen interstitials in the n = 2 RP nickelates is expected to be small. Compared to these, the n = 3 members exhibit even higher oxygen hypo-stoichiometries, further reducing the concentration of oxygen interstitials in the rock-salt layers and, hence, the values for Ds and σion. It should be noted that the above analysis ignores that (impurities near) grain boundaries and differences in the spatial distributions of grain orientation and grain size in the polycrystalline samples may exert an influence on the apparent values of Ds and σion.
In a molecular dynamics study of oxygen migration in the acceptor-doped system La2−xSrxCoO4±δ (x > 0.8), Tealdi et al.80 confirmed that oxygen transport in hyper-stoichiometric La0.8Sr1.2CoO4.1 is via an interstitialcy mechanism in the rock salt layer, but that in hypo-stoichiometric La0.8Sr1.2CoO3.9 mainly occurs through the migration of oxygen vacancies within the perovskite layer of the structure. Manthiram et al.85 suggested that oxygen vacancies dominate oxygen transport in the higher order RP phases La0.3Sr2.7CoFeO7−δ (n = 2) and LaSr3Co1.5Fe1.5O10−δ (n = 3), showing about one order of magnitude higher oxygen permeation fluxes than the n = 1 members La0.8Sr1.2CoO4+δ and La0.8Sr1.2FeO4+δ. The results of this study give firm evidence that oxygen migrates predominantly via an interstitialcy mechanism in the undoped RP nickelates Lnn+1NinO3n+1 (Ln = La, Pr and Nd; n = 1, 2 and 3), hence implicitly suggesting a negligible role of oxygen vacancies in determining oxygen transport in the n = 2 and n = 3 members despite their oxygen hypo-stoichiometries (cf.Fig. 7). Finally, it is difficult to account for the lower activation energy of oxygen migration in Pr4Ni3O10−δ compared with the corresponding values found for La4Ni3O10−δ and Nd4Ni3O10−δ (cf. Table 5). It is hypothesized to arise from concomitant Pr valence and, hence, size changes (due to significant Pr 4f and O 2p orbital hybridization) upon oxygen migration in Pr4Ni3O10−δ.86 First-principles density functional theory calculations are required to support this hypothesis.
4. Conclusions
In this work, the thermal evolution of the structure, oxygen nonstoichiometry, electrical conductivity and oxygen transport properties of Ruddlesden–Popper (RP) lanthanide nickelates Lnn+1NinO3n+1 (Ln = La, Pr and Nd; n = 1, 2 and 3) have been investigated. The compositions Pr2NiO4+δ, Pr3Ni2O7−δ and Nd3Ni2O7−δ have been excluded from this work because the material either cannot be prepared in a phase pure form (Pr3Ni2O7−δ and Nd3Ni2O7−δ) or fully decomposes at moderate temperatures (Pr2NiO4+δ). Upon heating in air phase transitions, involving changes in the tilting of the NiO6 octahedra, are observed in several of the materials. Pr4Ni3O10−δ and Nd4Ni3O10−δ remain monoclinic from room temperature up to 1000 °C, showing no observable phase transition.High density ceramic samples were obtained by sintering at 1300 °C and, for the n = 2 and n = 3 members, post-sintering annealing at reduced temperatures. The results of electrical conductivity measurements on these samples support the itinerant behaviour of the charge carriers in the RP nickelates. The increase in the p-type conductivity of the RP phases with the order parameter n can be interpreted in terms of a simple energy band scheme, showing that electron holes are formed in the σx2−y2↑ band upon increasing the oxidation state of Ni.
The RP nickelates display remarkable similarity in their values for the surface exchange coefficient (kchem) despite the differences in the structure and the type of lanthanide ion. The oxygen self-diffusion coefficients (Ds) calculated from the corresponding values of the chemical diffusion coefficient (Dchem), using the data of oxygen non-stoichiometry, are found to decrease profoundly with the order parameter n. While oxygen hyper-stoichiometry (δ > 0) is found in the n = 1 compositions, oxygen hypo-stoichiometry (δ < 0) is found in the n = 2 and n = 3 compositions. The results of this study underpin that oxygen transport in the undoped RP nickelates mainly occurs via an interstitialcy mechanism within the rock-salt layer of the structures.
Conflicts of interest
There are no conflicts to declare.Acknowledgements
Financial support from the Dutch Technology Foundation (STW, now part of NWO; Project Nr. 15325) and the Chinese Scholarship Council (CSC 201406340102) are gratefully acknowledged.References
- G. Amow and S. J. Skinner, J. Solid State Electrochem., 2006, 10, 538–546 CrossRef CAS.
- A. Tarancón, M. Burriel, J. Santiso, S. J. Skinner and J. A. Kilner, J. Mater. Chem., 2010, 20, 3799–3813 RSC.
- R. K. Sharma, M. Burriel, L. Dessemond, J.-M. Bassat and E. Djurado, J. Power Sources, 2016, 325, 337–345 CrossRef CAS.
- V. Vibhu, A. Rougier, C. Nicollet, A. Flura, S. Fourcade, N. Penin, J.-C. Grenier and J.-M. Bassat, J. Power Sources, 2016, 317, 184–193 CrossRef CAS.
- M. A. Yatoo, Z. Du, H. Zhao, A. Aguadero and S. J. Skinner, Solid State Ionics, 2018, 320, 148–151 CrossRef CAS.
- M. A. Yatoo, A. Aguadero and S. J. Skinner, APL Mater., 2019, 7, 013204 CrossRef.
- F. Grimm, N. H. Menzler, P. Lupetin and O. Guillon, ECS Trans., 2019, 91, 1397 CrossRef CAS.
- M. T. Fernández-Díaz, J. L. Martínez and J. Rodríguez-Carvajal, Solid State Ionics, 1993, 63, 902–906 CrossRef.
- S. Skinner and J. Kilner, Solid State Ionics, 2000, 135, 709–712 CrossRef CAS.
- S. J. Skinner, Solid State Sci., 2003, 5, 419–426 CrossRef CAS.
- E. Boehm, J. Bassat, P. Dordor, F. Mauvy, J. Grenier and P. Stevens, Solid State Ionics, 2005, 176, 2717–2725 CrossRef CAS.
- T. Nakamura, K. Yashiro, K. Sato and J. Mizusaki, Mater. Chem. Phys., 2010, 122, 250–258 CrossRef CAS.
- S. Takahashi, S. Nishimoto, M. Matsuda and M. Miyake, J. Am. Ceram. Soc., 2010, 93, 2329–2333 CrossRef CAS.
- L. Minervini, R. W. Grimes, J. A. Kilner and K. E. Sickafus, J. Mater. Chem., 2000, 10, 2349–2354 RSC.
- J.-M. Bassat, Solid State Ionics, 2004, 167, 341–347 CrossRef CAS.
- J.-M. Bassat, M. Burriel, M. Ceretti, P. Veber, J.-C. Grenier, W. Paulus and J. A. Kilner, ECS Trans., 2013, 57, 1753–1760 CrossRef.
- D. Lee and H. N. Lee, Materials, 2017, 10, 368 CrossRef.
- M. Yashima, M. Enoki, T. Wakita, R. Ali, Y. Matsushita, F. Izumi and T. Ishihara, J. Am. Chem. Soc., 2008, 130, 2762–2763 CrossRef CAS.
- A. Chroneos, D. Parfitt, J. A. Kilner and R. W. Grimes, J. Mater. Chem., 2010, 20, 266–270 RSC.
- A. Flura, S. Dru, C. Nicollet, V. Vibhu, S. Fourcade, E. Lebraud, A. Rougier, J.-M. Bassat and J.-C. Grenier, J. Solid State Chem., 2015, 228, 189–198 CrossRef CAS.
- M. J. Escudero, A. Fuerte and L. Daza, J. Power Sources, 2011, 196, 7245–7250 CrossRef CAS.
- E. Dogdibegovic, W. Guan, J. Yan, M. Cheng and X.-D. Zhou, J. Electrochem. Soc., 2016, 163, F1344–F1349 CrossRef CAS.
- S. Saher, J. Song, V. Vibhu, C. Nicollet, A. Flura, J.-M. Bassat and H. J. M. Bouwmeester, J. Mater. Chem. A, 2018, 6, 8331–8339 RSC.
- D. Ning, A. Baki, T. Scherb, J. Song, A. Fantin, X. Liu, G. Schumacher, J. Banhart and H. J. M. Bouwmeester, Solid State Ionics, 2019, 342, 115056 CrossRef CAS.
- V. Vibhu, J.-M. Bassat, A. Flura, C. Nicollet, J.-C. Grenier and A. Rougier, ECS Trans., 2015, 68, 825–835 CrossRef CAS.
- J.-M. Bassat, V. Vibhu, C. Nicollet, A. Flura, S. Fourcade, J.-C. Grenier and A. Rougier, ECS Trans., 2017, 78, 655–665 CrossRef CAS.
- T. Broux, C. Prestipino, M. Bahout, S. Paofai, E. Elkaim, V. Vibhu, J. C. Grenier, A. Rougier, J. M. Bassat and O. Hernandez, Dalton Trans., 2016, 45, 3024–3033 RSC.
- J. Sullivan, D. Buttrey, D. Cox and J. Hriljac, J. Solid State Chem., 1991, 94, 337–351 CrossRef CAS.
- E. Pikalova, A. Kolchugin, N. Bogdanovich, D. Medvedev, J. Lyagaeva, L. Vedmid, M. Ananyev, S. Plaksin and A. Farlenkov, Int. J. Hydrogen Energy, 2020, 45, 13612–13624 CrossRef CAS.
- P. Odier, C. Allançon and J. M. Bassat, J. Solid State Chem., 2000, 153, 381–385 CrossRef CAS.
- A. Egger, Rare Earth Nickelates as Cathodes for Solid Oxide Fuel Cells, PhD thesis, Montanuniversität Leoben, Leoben, Austria, 2013 Search PubMed.
- Z. Zhang and M. Greenblatt, J. Solid State Chem., 1995, 117, 236–246 CrossRef CAS.
- G. Amow, I. Davidson and S. Skinner, Solid State Ionics, 2006, 177, 1205–1210 CrossRef CAS.
- R. J. Woolley and S. J. Skinner, J. Power Sources, 2013, 243, 790–795 CrossRef CAS.
- D. O. Bannikov and V. A. Cherepanov, J. Solid State Chem., 2006, 179, 2721–2727 CrossRef CAS.
- R. K. Sharma, M. Burriel and E. Djurado, J. Mater. Chem. A, 2015, 3, 23833–23843 RSC.
- S. F. P. ten Donkelaar, R. Ruhl, S. A. Veldhuis, A. Nijmeijer, L. Winnubst and H. J. M. Bouwmeester, Ceram. Int., 2015, 41, 13709–13715 CrossRef CAS.
- J. Rodriguezcarvajal, Phys. B, 1993, 192, 55–69 CrossRef CAS.
- J. E. ten Elshof, M. H. R. Lankhorst and H. J. M. Bouwmeester, J. Electrochem. Soc., 1997, 144, 1060–1067 CrossRef.
- M. W. den Otter, H. J. M. Bouwmeester, B. A. Boukamp and H. Verweij, J. Electrochem. Soc., 2001, 148, J1 CrossRef CAS.
- A. Olafsen, H. Fjellvåg and B. C. Hauback, J. Solid State Chem., 2000, 151, 46–55 CrossRef CAS.
- M. Zinkevich and F. Aldinger, J. Alloys Compd., 2004, 375, 147–161 CrossRef CAS.
- M. U. Nagell, W. A. Sławiński, P. Vajeeston, H. Fjellvåg and A. O. Sjåstad, Solid State Ionics, 2017, 305, 7–15 CrossRef CAS.
- M. Ceretti, O. Wahyudi, G. Andre, M. Meven, A. Villesuzanne and W. Paulus, Inorg. Chem., 2018, 57, 4657–4666 CrossRef CAS.
- V. Vibhu, M. R. Suchomel, N. Penin, F. Weill, J. C. Grenier, J. M. Bassat and A. Rougier, Dalton Trans., 2018, 48, 266–277 RSC.
- E. A. Kiselev, P. Gaczynski, G. Eckold, A. Feldhoff, K. D. Becker and V. A. Cherepanov, Chim. Techno Acta, 2019, 6, 51–71 CrossRef CAS.
- J. Zhang, H. Zheng, Y. S. Chen, Y. Ren, M. Yonemura, A. Huq and J. F. Mitchell, 2019, arXiv:1904.10048.
- R. D. Shannon, Acta Crystallogr., Sect. A: Cryst. Phys., Diffr., Theor. Gen. Crystallogr., 1976, 32, 751–767 CrossRef.
- D. Guan, J. Zhou, Y. C. Huang, C. L. Dong, J. Q. Wang, W. Zhou and Z. Shao, Nat. Commun., 2019, 10, 3755 CrossRef.
- D. M. Halat, R. Dervişoğlu, G. Kim, M. T. Dunstan, F. D. R. Blanc, D. S. Middlemiss and C. P. Grey, J. Am. Chem. Soc., 2016, 138, 11958–11969 CrossRef CAS.
- T. Nakamura, K. Yashiro, K. Sato and J. Mizusaki, Solid State Ionics, 2010, 181, 402–411 CrossRef CAS.
- Y. Toyosumi, H. Ishikawa and K. Ishikawa, J. Alloys Compd., 2006, 408–412, 1200–1204 CrossRef CAS.
- A. Aguadero, J. A. Alonso, M. J. Martínez-Lope, M. T. Fernández-Díaz, M. J. Escudero and L. Daza, J. Mater. Chem., 2006, 16, 3402–3408 RSC.
- M. Nagamori, T. Shimonosono, S. Sameshima, Y. Hirata, N. Matsunaga and Y. Sakka, J. Am. Ceram. Soc., 2009, 92, S117–S121 CAS.
- M. Rotan, J. Tolchard, E. Rytter, M.-A. Einarsrud and T. Grande, J. Solid State Chem., 2009, 182, 3412–3415 CrossRef CAS.
- O. Wahyudi, M. Ceretti, I. Weill, A. Cousson, F. Weill, M. Meven, M. Guerre, A. Villesuzanne, J. M. Bassat and W. Paulus, CrystEngComm, 2015, 17, 6278–6285 RSC.
- R. Retoux, J. Rodriguez-Carvajal and P. Lacorre, J. Solid State Chem., 1998, 140, 307–315 CrossRef CAS.
- J. Kilner and C. Shaw, Solid State Ionics, 2002, 154, 523–527 CrossRef.
- J. Zhang, A. S. Botana, J. W. Freeland, D. Phelan, H. Zheng, V. Pardo, M. R. Norman and J. F. Mitchell, Nat. Phys., 2017, 13, 864–869 Search PubMed.
- R. J. Woolley, B. N. Illy, M. P. Ryan and S. J. Skinner, J. Mater. Chem., 2011, 21, 18592–18596 RSC.
- E. N. Naumovich, M. V. Patrakeev, V. V. Kharton, A. A. Yaremchenko, D. I. Logvinovich and F. M. B. Marques, Solid State Sci., 2005, 7, 1353–1362 CrossRef CAS.
- T. Nakamura, K. Yashiro, K. Sato and J. Mizusaki, J. Solid State Chem., 2009, 182, 1533–1537 CrossRef CAS.
- D.-P. Huang, Q. Xu, F. Zhang, W. Chen, H.-x. Liu and J. Zhou, Mater. Lett., 2006, 60, 1892–1895 CrossRef CAS.
- Z. Lou, J. Peng, N. Dai, J. Qiao, Y. Yan, Z. Wang, J. Wang and K. Sun, Electrochem. Commun., 2012, 22, 97–100 CrossRef CAS.
- Z. Lou, N. Dai, Z. Wang, Y. Dai, Y. Yan, J. Qiao, J. Peng, J. Wang and K. Sun, J. Solid State Electrochem., 2013, 17, 2703–2709 CrossRef CAS.
- T. Nakamura, K. Yashiro, K. Sato and J. Mizusaki, Phys. Chem. Chem. Phys., 2009, 11, 3055–3062 RSC.
- J. Bassat, P. Odier and J. Loup, J. Solid State Chem., 1994, 110, 124–135 CrossRef CAS.
- S. Nishiyama, D. Sakaguchi and T. Hattori, Solid State Commun., 1995, 94, 279–282 CrossRef CAS.
- J. B. Goodenough, Mater. Res. Bull., 1973, 8, 423–431 CrossRef CAS.
- J. B. Goodenough and S. Ramasesha, Mater. Res. Bull., 1982, 17, 383–390 CrossRef CAS.
- Z. Zhang, M. Greenblatt and J. Goodenough, J. Solid State Chem., 1994, 108, 402–409 CrossRef CAS.
- P. A. Cox, in Physics and Chemistry of Low-Dimensional Inorganic Conductors, Springer, 1996, pp. 255–270 Search PubMed.
- Z. Li and R. Haugsrud, Solid State Ionics, 2012, 206, 67–71 CrossRef CAS.
- S. Benson, D. Waller and J. Kilner, J. Electrochem. Soc., 1999, 146, 1305–1309 CrossRef CAS.
- M. Burriel, J. Peña-Martínez, R. J. Chater, S. Fearn, A. V. Berenov, S. J. Skinner and J. A. Kilner, Chem. Mater., 2012, 24, 613–621 CrossRef CAS.
- R. E. van Doorn, I. C. Fullarton, R. A. de Souza, J. A. Kilner, H. J. M. Bouwmeester and A. J. Burggraaf, Solid State Ionics, 1997, 96, 1–7 CrossRef CAS.
- M. Yashima, N. Sirikanda and T. Ishihara, J. Am. Chem. Soc., 2010, 132, 2385–2392 CrossRef CAS.
- A. Chroneos, D. Parfitt, R. V. Vovk and I. L. Goulatis, Mod. Phys. Lett. B, 2012, 26, 1250196 CrossRef.
- D. Parfitt, A. Chroneos, J. A. Kilner and R. W. Grimes, Phys. Chem. Chem. Phys., 2010, 12, 6834–6836 RSC.
- C. Tealdi, C. Ferrara, P. Mustarelli and M. S. Islam, J. Mater. Chem., 2012, 22, 8969–8975 RSC.
- A. Kushima, D. Parfitt, A. Chroneos, B. Yildiz, J. A. Kilner and R. W. Grimes, Phys. Chem. Chem. Phys., 2011, 13, 2242–2249 RSC.
- C. Frayret, A. Villesuzanne and M. Pouchard, Chem. Mater., 2005, 17, 6538–6544 CrossRef CAS.
- A. Cleave, J. Kilner, S. Skinner, S. Murphy and R. Grimes, Solid State Ionics, 2008, 179, 823–826 CrossRef CAS.
- A. C. Tomkiewicz, M. Tamimi, A. Huq and S. McIntosh, J. Mater. Chem. A, 2015, 3, 21864–21874 RSC.
- A. Manthiram, F. Prado and T. Armstrong, Solid State Ionics, 2002, 152, 647–655 CrossRef.
- J. Herrero-Martín, J. García-Muñoz, S. Valencia, C. Frontera, J. Blasco, A. Barón-González, G. Subías, R. Abrudan, F. Radu and E. Dudzik, Phys. Rev. B, 2011, 84, 115131 CrossRef.
Footnotes |
| † Electronic supplementary information (ESI) available. See DOI: 10.1039/d0ta06731h |
| ‡ Separation and Conversion Technology, Flemish Institute for Technological Research (VITO), Boeretang 200, Mol 2400, Belgium. |
| § Center for Information Photonics and Energy Materials, Shenzhen Institutes of Advanced Technology, Chinese Academy of Sciences, Shenzhen 518055, P. R. China. |
| This journal is © The Royal Society of Chemistry 2020 |

