 Open Access Article
Creative Commons Attribution 3.0 Unported Licence
Quantifying the impact of disorder on Li-ion and Na-ion transport in perovskite titanate solid electrolytes for solid-state batteries†
Adam R.
Symington
 *a,
John
Purton
 b,
Joel
Statham
a,
Marco
Molinari
 c,
M. Saiful
Islam
 a and
Stephen C.
Parker
 *a
*a
aDepartment of Chemistry, University of Bath, Claverton Down, Bath, BA2 7AY, UK. E-mail: A.R.Symington@bath.ac.uk; S.C.Parker@bath.ac.uk
bScience and Technologies Facilities Council, Daresbury Laboratory, Keckwick Lane, Daresbury, UK
cDepartment of Chemistry, University of Huddersfield, Queensgate, Huddersfield, HD1 3DH, UK
First published on 11th September 2020
Abstract
Solid electrolytes for all-solid-state batteries are generating considerable research interest as a means to improving their safety, stability and performance. Manipulation of structural disorder has a significant impact on solid electrolyte structures, but is often not fully characterised. Here, we present a comprehensive atomistic study that quantifies the effect of structural disorder on ionic transport using the perovskite Li3xLa(2/3)−xTiO3 (0 < x < 0.16) (LLTO) and its sodium analogue Na3xLa(2/3)−xTiO3 (0 < x < 0.16) (NLTO) as model solid electrolytes. We apply large-scale atomistic simulations to analyze the impact of sintering and synthesis conditions on their cation disorder and ion transport behavior. Our results predict that high temperature synthesis imparts high levels of A-site disorder in both electrolytes. The conductivities for disordered LLTO samples are consistently higher than those of ordered systems, indicating the positive correlation between disorder and Li-ion conductivity. This behavior can also be seen in NLTO, but this system suffers from very low conductivity indicating that NLTO would not be a suitable electrolyte. We discuss the role of order–disorder in the context of ionic conductivity and provide guidelines to tailor experimental synthesis conditions that can lead to the optimization of high-performance solid electrolytes.
Introduction
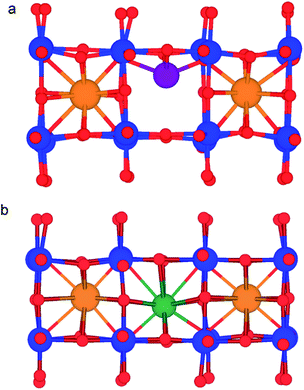
Lithium-ion batteries are currently based on liquid electrolytes, which suffer from safety and life cycling issues as well as poor chemical stability. As a result, significant efforts have been made to replace liquid electrolytes with a solid electrolyte for all-solid-state batteries.1–10 Many potential solid electrolyte materials based on NASICON, LISICON and garnet structures have been investigated, with each presenting its own strengths and weaknesses.11,12 One promising candidate material is the A-site-deficient perovskite, lithium lanthanum titanate Li3xLa(2/3)−xTiO3 (0 < x < 0.16) (LLTO).13–48 Early work found LLTO to have a high bulk lithium ion conductivity of 1.0 × 10⁻³ S cm−1 at room temperature, with an activation energy of 0.4 eV,13 although there are reports of significant grain boundary resistance.13,29,34,36,39,44LLTO adopts the perovskite (ABO3) structure, comprised of alternating layers of lanthanum (La-rich) and lithium (Li-rich) (Fig. 1), with A-site vacancies residing preferentially in the Li-rich layer.25 Li-Ion conductivity depends on the A-site vacancy concentration x13–15,17–22,24,26–28,45–47 and this dependence follows a dome shape, with a peak at x = 0.11 (1 × 10⁻³ S cm−1 at 298 K). The mechanism for Li-ion diffusion involves Li-ions hopping via vacant A-sites.17,18,30,32
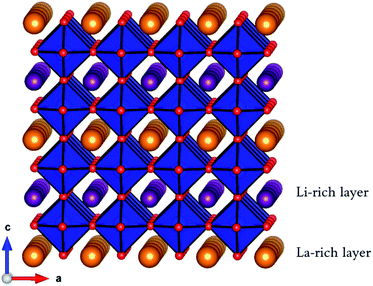 | ||
| Fig. 1 Perovskite structure of A3xLa(2/3)−xTiO3 (0 < x < 0.16) (A = Li+ or Na+) showing corner-sharing TiO6 octahedra (blue), O ions (red), La ions (orange) and Li (or Na) ions (purple). | ||
The degree of ordering of A-site cations (La3+/Li+) and A-site vacancies strongly influences the crystal structure as well as Li-ion conductivity. Fully ordered systems consist of alternating lanthanum (La-rich) and lithium (Li-rich) layers, whereas in disordered systems the A-site cations and vacancies are randomly distributed. Harada et al., showed that the ionic conductivities of disordered LLTO samples were approximately one order of magnitude higher than that of the fully ordered sample.25 Furthermore, it has been shown that the ordering of A-site vacancies has an impact on the dimensionality of Li-ion conductivity. In ordered systems, the absence of vacancies and Li-ions in the La-rich layers restrict Li-ion conductivity to the Li-rich layers, and minimal Li-ion conductivity occurs between these layers (via the La-rich layer).25 In contrast, disordered systems demonstrate three-dimensional Li-ion conductivity due to the random distribution of Li+, La3+ and A-site vacancies which allow transport between layers.22,28,32,49
Controlling A-site cation disorder in Li-ion solid electrolytes is a significant challenge that must be overcome to reach the ionic conductivity required for practical applications.25,50–55 However, A-site disorder and its influence on Li-ion conductivity in LLTO, is not fully characterised, especially at the atomic scale. It is crucial to note that it is not possible to determine whether disorder will be detrimental or beneficial for conduction in a given material and predictive methodologies are crucial to aiding this understanding.
In this work, we investigate the atomistic effects of A-site cation disorder on the Li-ion conductivity of a representative solid electrolyte, Li3xLa(2/3)−xTiO3 (0 < x < 0.16) (LLTO). Furthermore, given the recent interest in sodium ion batteries for grid storage,56,57 we have also studied, for the first time, the sodium analogue, Na3xLa(2/3)−xTiO3 (0 < x < 0.16) (NLTO). Using Monte Carlo calculations, we show that high sintering temperatures cause high levels of A-site disorder in both materials and then, using molecular dynamics simulations we show that this disorder has a significant impact on the conductivity. Our results provide valuable atomic-scale insights into the role of disorder on the transport performance of solid electrolytes and we provide a methodology that can be widely applied to a range of materials.
Methodology
The calculations are based on well-established computational techniques that are widely used to investigate the defect and ion transport properties of ionic solids.The perovskite structure used for both LLTO and NLTO has a P4mm unit cell and lattice constants of a = b = 3.871 Å and c = 7.779 Å.58 An 8 × 8 × 6 expansion of the unit cell was employed for the Monte Carlo and molecular dynamics simulations and simulations cells were ∼4000 atoms in size. Full details of the simulation cells can be found in ESI2.†
Hybrid Monte Carlo (MC) simulations have been used to explore the distribution of A-site cations and molecular dynamics (MD) simulations have been used to calculate transport properties. Previous studies have described MC methods that exchange cation positions in order to sample multiple configurations and calculate the thermodynamic and solubility limits of ionic materials.59–63 However, the sampling of configurations will often be poor for systems such as LLTO/NLTO due to the different size and charge of the Li+, Na+ and La3+ cations. Hence it is normally necessary to undertake some form of relaxation around the species which are interchanged.
The materials studied here are non-stoichiometric and contain varying concentrations of Li+/Na+, La3+ along with charge compensating A-site vacancies. In the current simulations, positions were exchanged between the A-site cations, e.g. Li+/Na+ ↔ La3+, Li+/Na+ ↔ A-site vacancies and La3+ ↔ A-site vacancies (ghost particles were employed to represent vacancies). After each “exchange” the structure was relaxed using the Fast-Inertial Relaxation Engine technique64 (FIRE) so that both the residual forces on the ions were less than 0.001 eV Å−1 and the energy had converged to less 1.0 × 10⁻⁵ eV. This is an established technique that has been used to study the bulk and surface structure of doped ceria.60,63 The internal energy and structural data were monitored over a period of 80![[thin space (1/6-em)]](https://www.rsc.org/images/entities/char_2009.gif) 000 cycles, prior to which an equilibration period of 50
000 cycles, prior to which an equilibration period of 50![[thin space (1/6-em)]](https://www.rsc.org/images/entities/char_2009.gif) 000 cycles was undertaken. The Monte Carlo simulations were carried out across a temperature range of 300–1600 K and thus provide distributions of A-site cations and vacancies at various synthesis and battery operating temperatures.
000 cycles was undertaken. The Monte Carlo simulations were carried out across a temperature range of 300–1600 K and thus provide distributions of A-site cations and vacancies at various synthesis and battery operating temperatures.
Molecular dynamics simulations were carried out on the structures equilibrated with Monte Carlo. The DL_POLY code was used for all molecular dynamics (MD) simulations.65 Long MD runs of 5 ns were completed using a timestep of 1 fs with supercells of ∼3000 atoms. Simulations were carried over a temperature range of 300–1600 K, at intervals of 100 K, using the NPT ensemble with a Nose–Hoover thermostat, for 1 ns to equilibrate the configuration at that temperature. Configurations were then simulated with the NVT ensemble, with a Nose–Hoover thermostat for 5 ns for the collection of self-diffusion data. Self-diffusion data for Li+ and Na+ were obtained from a mean squared displacement (MSD) analysis according to
| ri2(t) = 6DLi/Nat | (1) |
 | (2) |
Results and discussion
A-site disorder
In order to simulate the effect of temperature on the A-site disorder, we have used large scale hybrid Monte Carlo simulations, where A-site cations and vacancies were exchanged. We have quantified the A-site disorder with an order parameter term, calculated according to | (3) |
We have chosen to investigate four different Li3xLa(2/3)−xTiO3 and Na3xLa(2/3)−xTiO3 systems, with x values of 0.115, 0.128, 0.140 and 0.154. In our Monte Carlo simulations, decreasing the x value causes a small increase in volume (Fig. S1†). This agrees with experimental observations which show that the volume decreases with decreasing x due to the removal of large La3+ ions for smaller Li-ions.25 All phases have a positive expansion in the a = b lattice parameter with increasing temperature whereas a negative expansion in the c parameter with increasing temperature, i.e. the material becomes more cubic with increasing disorder and temperature. This has been reported experimentally in LLTO attributed to the elevated temperature.25
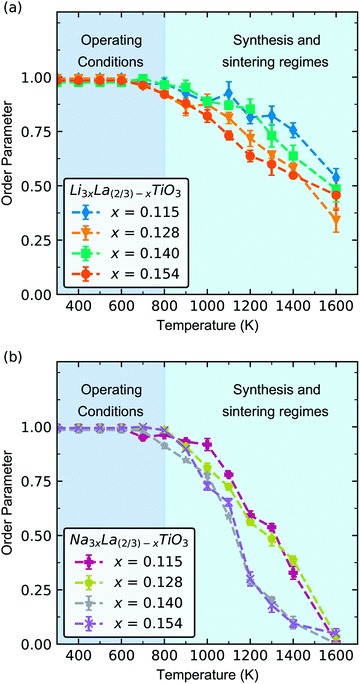
Fig. 2 shows the change in order parameter with increasing temperature for each phase. At lower temperatures (300–800 K), the order parameter tends towards 1, which indicates that there is minimal A-site disorder for all phases of both LLTO and NLTO. In real terms, this means that La-ions are located primarily in the La-rich layers, with minimal La-ions in the Li/Na-rich layers in LLTO and NLTO. A-site vacancies are located primarily in the Li/Na-rich layers in both materials. With increasing temperature there is a decrease in order parameter from 0.95 at 800 K to 0.5 at 1600 K in LLTO, and 0.95 at 800 K to 0.1 at 1600 K in NLTO. At the highest temperature (1600 K) the cations and vacancies are more randomly distributed between the La-rich and Li/Na-rich layers. In other words, the Li/Na-rich and La-rich layers (as shown in Fig. 1) are poorly defined.
Under typical solid-state battery operating conditions, 300–500 K, we predict a highly ordered system with clearly defined La-rich and Li/Na-rich layers, and A-site vacancies localised in the Li/Na-rich layers. In contrast, under sintering conditions (>1000 K) the material will be disordered in both cation and vacancy positions. Thus, our results indicate that freshly made LLTO and NLTO devices will have high levels of A-site disorder. Once in operation (300–600 K), the disorder will decrease over time and tend towards clearly defined, alternating Li/Na-rich and La-rich layers. Previous work has shown that high temperature sintering (∼1500 K) can significantly increase the A-site disorder in LLTO and that this disorder can be reversibly altered with temperature.25 However the reversal is slow and occurs over relatively long timescales, ∼100–200 hours.25
NLTO is far more susceptible to A-site disorder than LLTO, as evidenced by its noticeably lower order parameter at high temperature (Fig. 2b). An order parameter of 0 indicates that there is complete mixing of La-ions, Na/Li-ions and A-site vacancies and that there is no difference between A-sites. There are underlying differences in the behaviour of Li/Na-ions in LLTO and NLTO that explain the difference in order parameter.
At 1600 K, where the order parameters significantly differ, the average Li–O, Na–O and La–O coordination numbers are 7.92 ± 0.03, 11.86 ± 0.02 and 11.87 ± 0.03 respectively and the average Li–O, Na–O and La–O bond lengths are 2.5 ± 0.02 Å, 2.71 ± 0.02 Å and 2.7 ± 0.02 Å respectively. The difference in behaviour of Li-ions and Na-ions in LLTO and NLTO can be seen in the radial distribution function (Fig. 3). These results show that Na-ions in NLTO behave in a similar manner to La-ions in terms of bond lengths and coordination number and we speculate that this is due to the similar size of sodium and lanthanum ions. Swapping an La-ion with an Na-ion will have less of an energetic impact on the local structural environment compared to an Li-ion. This observation is supported by powder XRD measurements and transition electron microscopy studies on mixed (NayLi1−y)3xLa(2/3)−xTiO3 systems which found that the order parameter decreased with increasing concentration of Na.42
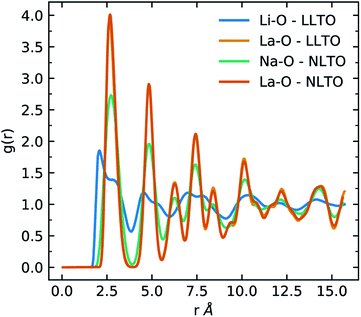 | ||
| Fig. 3 Radial distribution functions (RDFs) of Li–O (blue) and La–O (orange) in LLTO and Na–O (green) and La–O (red) in NLTO at 1600 K. | ||
Li and Na-ion conduction and dynamics
As noted, previous computational studies have not combined Monte Carlo and molecular dynamics to understand disorder and its impact on conductivity in these compounds. The results of the Monte Carlo calculations were used to generate configurations with fully equilibrated distributions of A-site cations and vacancies. Thus, at each temperature studied with MD, the distribution of A-site cations is fully equilibrated to that temperature. It is important to note that the distributions of A-site cations and A-site vacancies taken from the Monte Carlo simulations did not change during the molecular dynamics simulations, highlighting that the distributions generated from the Monte Carlo simulations are representative of the equilibrium distribution.The Li+ and Na+ diffusion coefficients were evaluated from the mean squared displacement data (Fig. S4†) and then converted to ionic conductivities using the Nernst–Einstein equation (eqn (2)). Fig. 4a shows the Arrhenius plot for calculated Li-ion conductivity for the different LLTO and NLTO phases, as well as some experimental data. The values for LLTO are in agreement with experimental and theoretical reports in the literature.13,21,71,72 The conductivity is highest for the x = 0.115 phase and lowest for the x = 0.154 phase. There is a two orders of magnitude difference between the lowest conductivity (6 × 10⁻⁵ S cm−1 at x = 0.154) and highest (1 × 10⁻³ S cm−1 at x = 0.115) at 300 K. This is in keeping with ac impedance experiments, which show that Li-ion conductivity decreases with increasing x value from a maximum value of x ∼ 0.115.13,19
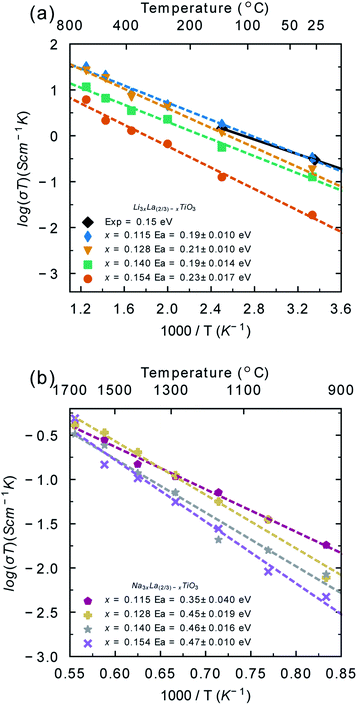 | ||
| Fig. 4 Li+ (a) and Na+ (b) temperature-dependent conductivities (σT) and activation energies (Ea) for each bulk phase of LLTO and NLTO. The experimental room temperature conductivity calculated from electrochemical impedance spectroscopy for the x = 0.113 phase of LLTO (black diamonds) has been included for comparison.13 | ||
The calculated activation energies for Li-ion conductivity are also given in Fig. 4a, with generally low values (∼0.2 eV) for all systems. These values are in agreement with electrochemical impedance spectroscopy studies on single crystals,13 but lower than polycrystalline measurements. This difference is due to the strong grain boundary resistance that has been reported in LLTO.13,29,39,73
Fig. 4b shows the Arrhenius plot for Na-ion conductivity in the different NLTO phases. Under typical solid-state battery operating conditions (300–500 K) minimal Na+ diffusion was recorded (<1 × 10⁻⁶). Na+ diffusion occurs at temperatures exceeding 900 K. The calculated conductivities at 900 K are very low (5 × 10⁻⁶ S cm−1) and the activation energies are high (0.35–0.47 eV in the temperature range 900–1800 K). Taken together, this highlights the poor predicted performance of NLTO as a solid electrolyte. NLTO has not been previously studied in the context of solid electrolytes and so there is no experimental study for direct comparison. Mixed Li/Na lanthanum titanate systems have been studied previously and while Na ion diffusion was not studied, it was found that the introduction of sodium decreased the Li-ion conductivity and increased the activation energy for Li-ion conduction relative to the Li-ion system,74,75 in line with our results. Hence, our findings indicate that NLTO is not a suitable candidate for sodium-based solid electrolytes.
There is no significant difference between the volume of LLTO and NLTO (Fig. S1†), despite the different sizes of A-site cations due to the lanthanum titanate framework controlling the cell dimensions. As the volume does not significantly change, the larger size of Na-ions is likely to be responsible for the poor conductivity. Li-Ions in LLTO can be accommodated into the structure without significantly reducing the volume, as evidenced by the similar volume of NLTO (despite the larger Na-ions). The difference in conductivity between the two materials is thus due to the different size of Li-ions and Na-ions which have to diffuse within similarly sized diffusion channels. In the previous section it was shown that Na-ions behave in a similar way to La-ions in terms of coordination number and bond lengths. It can be inferred from the coordination number and bond lengths that Na-ions sit at the centre of the A-site and remain highly coordinated, much like the La-ions. In contrast, Li-ions in LLTO have much shorter bond lengths and smaller coordination numbers, which indicates that they are much more mobile within the A-site (Fig. 5).
The activation energy and conductivities (Fig. 4) have been calculated using a fully equilibrated distribution of A-site cations at each temperature. In reality the redistribution of cations occurs over long timescales. For example, in LLTO, the transition from fully disordered A-sites to fully ordered A-sites occurs over 100–200 hours.25 This is in agreement with our calculated La3+ diffusion coefficients, which are very small, indicating that La3+ redistribution will take place slowly. Based upon our Monte Carlo simulations we predict that LLTO will be highly disordered following high temperature synthesis (1000–1600 K) but ordered under battery operating conditions (300–800 K). Electrolyte materials are synthesised at high temperatures and then used at comparatively low temperatures in devices. Taken together, we predict that LLTO samples, sintered at high temperature, will be disordered when fabricated and become ordered over time as they are cycled at low temperatures. Thus, if the properties of the material (particularly ionic conductivity) are influenced by the A-site cation distributions, they will change over the course of the device's lifetime.
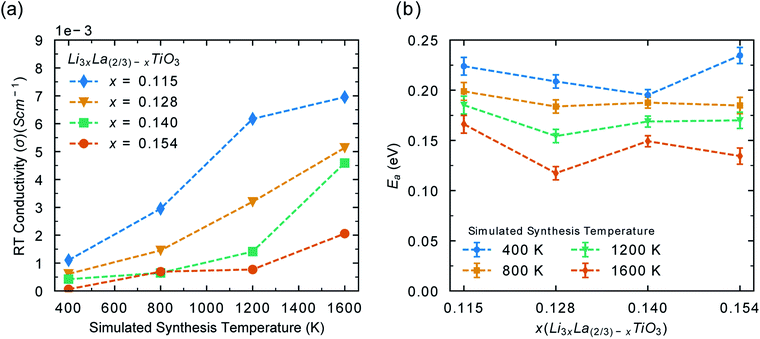
In order to explore the full life cycle of LLTO devices (disordered to ordered) it is necessary to consider configurations with different levels of disorder at battery operating conditions. For example, a configuration generated from Monte Carlo simulations at 1600 K has an A-site cation distribution typical of samples synthesised at 1600 K. If this sample was quench cooled and fabricated into a battery, how would that device perform over time? We have taken structural configurations with different order parameters (Fig. 2), generated from Monte Carlo simulations at 400, 800, 1200 and 1600 K and simulated their conductivities with MD between 300–1000 K. Thus, we have calculated how disorder, introduced by synthesis conditions, effects the conductivity and activation energy of the material. Due to the poor conductivity displayed by NLTO, we have not included the Na system in this part of the study.
Fig. 6a shows the effect of synthesis temperatures on the room temperature conductivity. As the synthesis temperature (and disorder) increases, the room temperature conductivity increases significantly (∼5 × 10⁻³ S cm−1). This is in good agreement with previous experimental work on disordered LLTO which have shown that the level of disorder can alter the conductivity by up to an order of magnitude,25,36,75,76 although such a range of x values has not been explored. These results show that LLTO, sintered at high temperatures will display excellent conductivity at the start of its lifespan. However, the conductivity will decrease with time as it is cycled at low battery operating temperatures. Maintaining high levels of disorder is necessary in order to maintain the high Li− ion conductivity. High temperature applications are therefore a viable option for the use of LLTO. Fig. 6b shows the calculated activation energy for Li-ion conductivity for each phase, based upon A-site disorder generated from Monte Carlo simulations. For all phases, as the disorder (synthesis temperature) increases, the activation energy decreases. The difference in activation energy for each phase in Fig. 6b can be explained by looking at the order parameter (Fig. 2a) for each configuration in Fig. 6b, which follows a similar trend shown in Fig. S5.† This further highlights that the electrolyte performance will decrease over time if sintered at high temperature and operated at low temperature. It is important to note that battery materials sintered at high temperature can suffer from lithium loss, which is undesirable in terms of ionic conductivity.1 Strategies to minimise the impact of Li loss during synthesis have been studied in LLTO′ for example, Geng et al. found that a non-flowing atmosphere was more favourable that a flowing atmosphere during sintering when it comes to Li content evaporation.77
Li-Ion conduction pathways – order vs. disorder
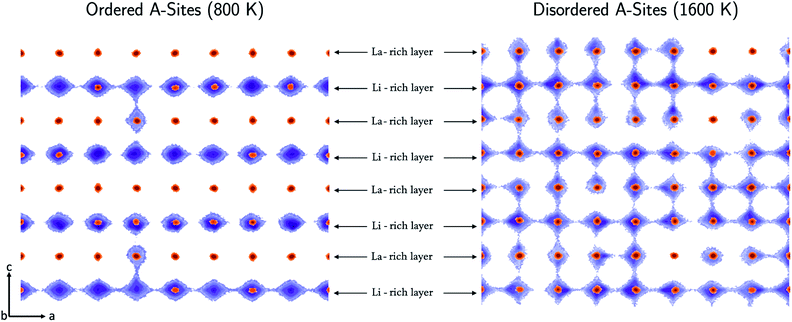
The directional dependence of the Li-ion conductivity can be found by analysing the Li-ion trajectories of the simulations to produce Li-ion density maps as shown in Fig. 7. The conductivity in the configurations annealed at 800 K is restricted primarily to two dimensions in the ab plane, with very little transport occurring between the Li-rich layers via the La-rich layer. In contrast, the conductivity in the configurations annealed at 1600 K is three dimensional and there is significant transport in the ab plane as well as the c direction.Li-Ion conduction is dependent on the concentration of A-site vacancies. When the system is ordered, there are clearly defined Li-rich and La-rich layers, which limits transport to the Li-rich layers, with vacancies residing primarily in the Li-rich layers. Conductivity is limited to the Li-rich layers because there is a small concentration of vacancies in the La-rich layers to allow transport between layers. In contrast, in the configurations annealed at high temperature A-site vacancies are distributed relatively uniformly in both La-rich and Li- rich layers along with Li-ions, resulting in significant transport between layers.
We can also quantify these effects by calculating the activation energy for Li-ion conductivity within the Li-rich layers and between layers. Fig. 8 shows the difference in activation energy for Li-ion conductivity in the c direction (Eca) (between La-rich and Li-rich layers) and the activation energy for Li-ion conductivity in the ab plane (Eaba) (within Li-rich layers). The values are all positive indicating that activation energies are always higher in the c direction compared to the ab plane. Following low temperature synthesis, the structure is ordered and there are minimal vacancies in the La-rich layer and the La-rich layers effectively block Li-ion conductivity in the c direction. For example, following synthesis at 400 K there is a difference between (Eca) and (Eaba) for all systems indicating anistropic Li-ion conduction pathways. At high temperature there is significant disorder and the La-rich layer is occupied with Li-ions and vacancies. Thus, at 1600 K the difference between (Eca) and (Eaba) now tends towards zero, indicating isotropic 3D conduction at high temperature.
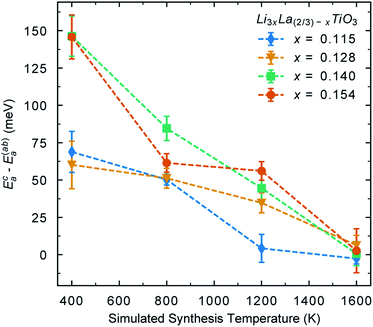 | ||
| Fig. 8 Difference between activation energy for Li-ion conductivity in the c direction (Eca) (between La-rich and Li-rich layers) and the a = b plane (Eaba) (within layers). | ||
Conclusions
The effect of A-site disorder is important to fully understand the transport properties of the perovskite titanate solid electrolytes for all-solid-state batteries at operating and synthesis conditions. In this study, we have quantified the impact of A-site disorder in the solid electrolyte material, Li3xLa(2/3)−xTiO3 (LLTO), and its sodium analogue Na3xLa(2/3)−xTiO3 (NLTO), using a combination of large-scale Monte Carlo and molecular dynamics simulations. The results reveal the following key features:(a) There is a large difference in the degree of A-site disorder in both LLTO and NLTO depending on the sintering and synthesis conditions. Our results suggest that LLTO and NLTO solid electrolytes will exhibit high levels of A-site disorder as a result of the fabrication process and that this disorder will decrease over time as the materials are used at battery operating conditions.
(b) The ratio between Li-ions, La-ions and A-site vacancies has a significant impact on ion diffusion, with an optimal value of x = 0.115 in Li3xLa(2/3)−xTiO3. A-site cation ordering has a large effect on the Li-ion conductivity and activation energy of LLTO. Increasing the disorder of the material (altering the order parameter from 1 to 0.5) by increasing the synthesis temperature, can increase the room temperature conductivity by an order of magnitude. The disordered systems demonstrate isotropic 3D Li-ion conductivity due to the random distribution of Li-ions, La-ions and A-site vacancies, which allow transport between layers.
(c) NLTO is not a suitable candidate for a sodium-based solid-state electrolyte due to its very low Na-ion conductivity at typical operating conditions.
These findings will contribute towards developing strategies for the optimization of the synthesis and operation of promising perovskite-type solid electrolytes for solid-state batteries.
Conflicts of interest
There are no conflicts to declare.Acknowledgements
This work was supported by the Faraday institution (FIRG016) and EPSRC (EP/P007821/1, EP/R010366/1, EP/R023603/1). Computations were run on Balena HPC facility at the University of Bath and the ARCHER UK National Supercomputing Service via our membership of the UKs HEC Materials Chemistry Consortium (HEC MCC) funded by the EPSRC (EP/L000202, EP/R029431). We are grateful to the UK Materials and Molecular Modelling Hub for computational resources, which is partially funded by the EPSRC (EP/P020194/1). The Monte Carlo calculations used computing resources provided by STFC Scientific Computing Department's SCARF cluster.Notes and references
- T. Famprikis, P. Canepa, J. A. Dawson, M. S. Islam and C. Masquelier, Nat. Mater., 2019, 18, 1278–1291 CrossRef CAS.
- A. Manthiram, X. Yu and S. Wang, Nat. Rev. Mater., 2017, 2, 16103 CrossRef CAS.
- C. Ma and M. Chi, Frontiers in Energy Research, 2016, 4, 23 CrossRef.
- M. D. Tikekar, S. Choudhury, Z. Tu and L. A. Archer, Nat. Energy, 2016, 1, 16114 CrossRef CAS.
- J. Janek and W. G. Zeier, Nat. Energy, 2016, 1, 16141 CrossRef.
- J. C. Bachman, S. Muy, A. Grimaud, H.-H. Chang, N. Pour, S. F. Lux, O. Paschos, F. Maglia, S. Lupart, P. Lamp, L. Giordano and Y. Shao-Horn, Chem. Rev., 2016, 116, 140–162 CrossRef CAS.
- J. Li, C. Ma, M. Chi, C. Liang and N. J. Dudney, Adv. Energy Mater., 2015, 5, 1401408 CrossRef.
- Y. Wang, W. D. Richards, S. P. Ong, L. J. Miara, J. C. Kim, Y. Mo and G. Ceder, Nat. Mater., 2015, 14, 1026–1031 CrossRef CAS.
- C. Masquelier, Nat. Mater., 2011, 10, 649–650 CrossRef CAS.
- N. Kamaya, K. Homma, Y. Yamakawa, M. Hirayama, R. Kanno, M. Yonemura, T. Kamiyama, Y. Kato, S. Hama, K. Kawamoto and A. Mitsui, Nat. Mater., 2011, 10, 682–686 CrossRef CAS.
- J. B. Goodenough, H. Y. P. Hong and J. A. Kafalas, Mater. Res. Bull., 1976, 11, 203–220 CrossRef CAS.
- P. G. Bruce and A. R. West, J. Electrochem. Soc., 1983, 130, 662–669 CrossRef CAS.
- Y. Inaguma, C. Liquan, M. Itoh, T. Nakamura, T. Uchida, H. Ikuta and M. Wakihara, Solid State Commun., 1993, 86, 689–693 CrossRef CAS.
- H. Kawai and J. Kuwano, J. Electrochem. Soc., 1994, 141, L78–L79 CrossRef CAS.
- M. Itoh, Y. Inaguma, W.-H. Jung, L. Chen and T. Nakamura, Solid State Ionics, 1994, 70–71, 203–207 CrossRef CAS.
- Y. Inaguma, L. Chen, M. Itoh and T. Nakamura, Solid State Ionics, 1994, 70–71, 196–202 CrossRef CAS.
- Y. J. Shan, Y. Inaguma and M. Itoh, Solid State Ionics, 1995, 79, 245–251 CrossRef CAS.
- Y. Inaguma, J. Yu, Y. J. Shan, M. Itoh and T. Nakamuraa, J. Electrochem. Soc., 1995, 142, L8–L11 CrossRef CAS.
- Y. Inaguma and M. Itoh, Solid State Ionics, 1996, 86–88, 257–260 CrossRef CAS.
- A. G. Belous, Solid State Ionics, 1996, 90, 193–196 CrossRef CAS.
- T. Katsumata, Y. Matsui, Y. Inaguma and M. Itoh, Solid State Ionics, 1996, 86–88, 165–169 CrossRef CAS.
- J. Emery, J. Y. Buzare, O. Bohnke and J. L. Fourquet, Solid State Ionics, 1997, 99, 41–51 CrossRef CAS.
- Y. Harada, T. Ishigaki, H. Kawai and J. Kuwano, Solid State Ionics, 1998, 108, 407–413 CrossRef CAS.
- A. I. Ruiz, M. L. López, M. L. Veiga and C. Pico, Solid State Ionics, 1998, 112, 291–297 CrossRef CAS.
- Y. Harada, Y. Hirakoso, H. Kawai and J. Kuwano, Solid State Ionics, 1999, 121, 245–251 CrossRef CAS.
- J. Ibarra, A. Várez, C. León, J. Santamaría, L. M. Torres-Martínez and J. Sanz, Solid State Ionics, 2000, 134, 219–228 CrossRef CAS.
- G. X. Wang, P. Yao, D. H. Bradhurst, S. X. Dou and H. K. Liu, J. Mater. Sci., 2000, 35, 4289–4291 CrossRef CAS.
- O. Bohnke, C. Bohnke, J. Ould Sid'Ahmed, M. P. Crosnier-Lopez, H. Duroy, F. Le Berre and J. L. Fourquet, Chem. Mater., 2001, 13, 1593–1599 CrossRef CAS.
- C. W. Ban and G. M. Choi, Solid State Ionics, 2001, 140, 285–292 CrossRef CAS.
- S. Stramare, V. Thangadurai and W. Weppner, Chem. Mater., 2003, 15, 3974–3990 CrossRef CAS.
- A. Morata-Orrantia, S. García-Martín and M. Á. Alario-Franco, Chem. Mater., 2003, 15, 363–367 CrossRef CAS.
- M. Yashima, M. Itoh, Y. Inaguma and Y. Morii, J. Am. Chem. Soc., 2005, 127, 3491–3495 CrossRef CAS.
- M. Catti, Chem. Mater., 2007, 19, 3963–3972 CrossRef CAS.
- K.-Y. Yang, J.-W. Wang and K.-Z. Fung, J. Alloys Compd., 2008, 458, 415–424 CrossRef CAS.
- K. Ohara, Y. Kawakita, L. Pusztai, L. Temleitner, S. Kohara, N. Inoue and S. Takeda, J. Phys.: Condens. Matter, 2010, 22, 404203 CrossRef CAS.
- M. D. Green, A. C. Sutorik, C. Cooper and J. Wolfenstine, J. Mater. Sci., 2012, 47, 6992–7002 CrossRef.
- A. G. Belous, G. Y. Kolbasov, E. I. Boldyrev and L. L. Kovalenko, Russ. J. Electrochem., 2015, 51, 1162–1167 CrossRef CAS.
- K. P. Abhilash, P. Christopher Selvin, B. Nalini, K. Somasundaram, P. Sivaraj and A. Chandra Bose, J. Phys. Chem. Solids, 2016, 91, 114–121 CrossRef CAS.
- C. Uhlmann, P. Braun, J. Illig, A. Weber and E. Ivers-Tiffée, J. Power Sources, 2016, 307, 578–586 CrossRef CAS.
- X. Hu, G. Yan, X. Cheng, J. Malzbender, W. Qiang and B. Huang, J. Am. Ceram. Soc., 2019, 102, 1953–1960 CAS.
- Y. Sun, P. Guan, Y. Liu, H. Xu, S. Li and D. Chu, Crit. Rev. Solid State Mater. Sci., 2019, 44, 265–282 CrossRef CAS.
- E. Smith and R. Ubic, J. Am. Ceram. Soc., 2019, 102, 3019–3031 CAS.
- R. B. de Oliveira, M. R. B. Andreeta, D. M. P. F. de Souza, J. E. F. S. Rodrigues and P. S. Pizani, Cryst. Growth Des., 2019, 19, 4897–4901 CrossRef CAS.
- S. Sasano, R. Ishikawa, K. Kawahara, T. Kimura, Y. H. Ikuhara, N. Shibata and Y. Ikuhara, Appl. Phys. Lett., 2020, 116, 043901 CrossRef CAS.
- M. J. Wang, J. B. Wolfenstine and J. Sakamoto, Adv. Funct. Mater., 2020, 30, 1909140 CrossRef CAS.
- M. e. Ling, Y. Jiang, Y. Huang, Y. Zhou and X. Zhu, J. Mater. Sci., 2020, 55, 3750–3759 CrossRef CAS.
- J. Liu, X. Gao, G. O. Hartley, G. J. Rees, C. Gong, F. H. Richter, J. Janek, Y. Xia, A. W. Robertson, L. R. Johnson and P. G. Bruce, Joule, 2020, 4, 101–108 CrossRef CAS.
- F. Zhu, M. S. Islam, L. Zhou, Z. Gu, T. Liu, X. Wang, J. Luo, C.-W. Nan, Y. Mo and C. Ma, Nat. Commun., 2020, 11, 1828 CrossRef CAS.
- A. Boulant, J. Emery, A. Jouanneaux, J.-Y. Buzaré and J.-F. Bardeau, J. Phys. Chem. C, 2011, 115, 15575–15585 CrossRef CAS.
- A. Symington, M. Molinari, J. Statham, J. Wu and S. C. Parker, J. Phys.: Energy, 2019, 042005 Search PubMed.
- A. R. Symington, M. Molinari, N. A. Brincat, N. R. Williams and S. C. Parker, Philos. Trans. R. Soc., A, 2019, 377, 20190026 CrossRef CAS.
- Z. Gao, H. Sun, L. Fu, F. Ye, Y. Zhang, W. Luo and Y. Huang, Adv. Mater., 2018, 30, 1705702 CrossRef.
- Z. Zhang, Y. Shao, B. Lotsch, Y.-S. Hu, H. Li, J. Janek, L. F. Nazar, C.-W. Nan, J. Maier, M. Armand and L. Chen, Energy Environ. Sci., 2018, 11, 1945–1976 RSC.
- G. King and P. M. Woodward, J. Mater. Chem., 2010, 20, 5785–5796 RSC.
- K. Kim and D. J. Siegel, J. Mater. Chem. A, 2019, 7, 3216–3227 RSC.
- L. Li, Y. Zheng, S. Zhang, J. Yang, Z. Shao and Z. Guo, Energy Environ. Sci., 2018, 11, 2310–2340 RSC.
- C. Vaalma, D. Buchholz, M. Weil and S. Passerini, Nat. Rev. Mater., 2018, 3, 18013 CrossRef.
- Y. Zhang and Y. Chen, Ionics, 2006, 12, 63–67 CrossRef CAS.
- J. A. Purton, Phys. Chem. Chem. Phys., 2019, 21, 9802–9809 RSC.
- D. S. D. Gunn, J. A. Purton and S. Metz, Solid State Ionics, 2018, 324, 128–137 CrossRef CAS.
- J. A. Purton, N. L. Allan and D. S. D. Gunn, Solid State Ionics, 2017, 299, 32–37 CrossRef CAS.
- J. A. Purton, A. Archer, N. L. Allan and D. S. D. Gunn, J. Mater. Chem. A, 2016, 4, 4592–4602 RSC.
- J. A. Purton and N. L. Allan, Comput. Mater. Sci., 2015, 103, 244–249 CrossRef CAS.
- Y. Zhou, M. Moseler and M. H. Müser, Phys. Rev. B, 2019, 99, 144103 CrossRef CAS.
- W. Smith and T. R. Forester, J. Mol. Graphics, 1996, 14, 136–141 CrossRef CAS.
- A. Pedone, G. Malavasi, M. C. Menziani, A. N. Cormack and U. Segre, J. Phys. Chem. B, 2006, 110, 11780–11795 CrossRef CAS.
- J. A. Dawson, P. Canepa, M. J. Clarke, T. Famprikis, D. Ghosh and M. S. Islam, Chem. Mater., 2019, 31, 5296–5304 CrossRef CAS.
- J. A. Dawson, P. Canepa, T. Famprikis, C. Masquelier and M. S. Islam, J. Am. Chem. Soc., 2018, 140, 362–368 CrossRef CAS.
- Y. Deng, C. Eames, L. H. B. Nguyen, O. Pecher, K. J. Griffith, M. Courty, B. Fleutot, J.-N. Chotard, C. P. Grey, M. S. Islam and C. Masquelier, Chem. Mater., 2018, 30, 2618–2630 CrossRef CAS.
- Y. Deng, C. Eames, B. Fleutot, R. David, J.-N. Chotard, E. Suard, C. Masquelier and M. S. Islam, ACS Appl. Mater. Interfaces, 2017, 9, 7050–7058 CrossRef CAS.
- E. E. Jay, M. J. D. Rushton, A. Chroneos, R. W. Grimes and J. A. Kilner, Phys. Chem. Chem. Phys., 2015, 17, 178–183 RSC.
- C.-h. Chen and J. Du, J. Am. Ceram. Soc., 2015, 98, 534–542 CrossRef CAS.
- A. Mei, X.-L. Wang, J.-L. Lan, Y.-C. Feng, H.-X. Geng, Y.-H. Lin and C.-W. Nan, Electrochim. Acta, 2010, 55, 2958–2963 CrossRef CAS.
- R. Jimenez, A. Varez and J. Sanz, Solid State Ionics, 2008, 179, 495–502 CrossRef CAS.
- A. Rivera, C. León, J. Santamaría, A. Várez, O. V'Yunov, A. G. Belous, J. A. Alonso and J. Sanz, Chem. Mater., 2002, 14, 5148–5152 CrossRef CAS.
- X. Gao, C. A. J. Fisher, T. Kimura, Y. H. Ikuhara, H. Moriwake, A. Kuwabara, H. Oki, T. Tojigamori, R. Huang and Y. Ikuhara, Chem. Mater., 2013, 25, 1607–1614 CrossRef CAS.
- H. Geng, A. Mei, Y. Lin and C. Nan, Mater. Sci. Eng., B, 2009, 164, 91–95 CrossRef CAS.
Footnote |
| † Electronic supplementary information (ESI) available. See DOI: 10.1039/d0ta05343k |
| This journal is © The Royal Society of Chemistry 2020 |

