
Unexpected trends in the enhanced Ce3+ surface concentration in ceria–zirconia catalyst materials†
Weizi
Yuan
 a,
Qing
Ma
b,
Yangang
Liang
c,
Chengjun
Sun
d,
K. V. L. V.
Narayanachari
a,
Michael J.
Bedzyk
a,
Ichiro
Takeuchi
c and
Sossina M.
Haile
*a
a,
Qing
Ma
b,
Yangang
Liang
c,
Chengjun
Sun
d,
K. V. L. V.
Narayanachari
a,
Michael J.
Bedzyk
a,
Ichiro
Takeuchi
c and
Sossina M.
Haile
*a
aDepartment of Materials Science and Engineering, Northwestern University, Illinois 60208, USA. E-mail: sossina.haile@northwestern.edu
bDND-CAT, Northwestern Synchrotron Research Center at the Advanced Photon Source, Argonne, Illinois 60439, USA
cDepartment of Materials Science and Engineering, University of Maryland, College Park, Maryland 20742, USA
dAdvanced Photon Source, Argonne National Laboratory, Argonne, Illinois 60439, USA
First published on 30th April 2020
Abstract
Despite the immense importance of ceria–zirconia solid solutions in heterogeneous catalysis, and the growing consensus that catalytic activity correlates with the concentration of reduced Ce3+ species and accompanying oxygen vacancies, the extent of reduction at the surfaces of these materials, where catalysis occurs, is unknown. Using angle-resolved X-ray Absorption Near Edge Spectroscopy (XANES), we quantify under technologically relevant conditions the Ce3+ concentration in the surface (2–3 nm) and bulk regions of ceria–zirconia films grown on single crystal yttria-stabilized zirconia, YSZ (001). In all circumstances, we observe substantial Ce3+ enrichment at the surface relative to the bulk. Surprisingly, the degree of enhancement is highest in the absence of Zr. This behavior stands in direct contrast to that of the bulk in which the Ce3+ concentration monotonically increases with increasing Zr content. These results suggest that while Zr enhances the oxygen storage capacity in ceria, undoped ceria may have higher surface catalytic activity. They further urge caution in the use of bulk properties as surrogate descriptors for surface characteristics and hence catalytic activity.
Introduction
Ceria (CeO2−δ) and ceria–zirconia (Ce1−xZrxO2−δ) solid solutions are important catalytic materials, either serving directly as catalysts themselves, or serving as supports for metal nanoparticle catalysts.1–4 The ease with which Ce undergoes changes in oxidation state is believed to account for the buffering capacity of ceria, which in turn is associated with its high catalytic activity.5 Introduction of zirconium increases the reducibility of the material,2,6–9 as has been quantified in recent measurements which reveal the relationship between bulk oxidation state, bulk vacancy concentration and environmental conditions.10–12 This behavior is quite distinct from that of rare-earth doping of ceria, which largely leaves the bulk thermodynamic properties unchanged from those of undoped ceria.13 Arguably, however, the redox properties of the surfaces are likely to be more important to the catalytic characteristics than those of the bulk. Here, quantitative data are scarce, particularly with respect to operando (experimental) observations. Computational studies of the ceria–zirconia system suggest enhanced surface vacancy concentrations relative to the bulk.4,5,14–20 In particular, Balducci et al. have predicted that oxygen vacancy segregation to the surface increases with Zr content and is more pronounced in the sequence (310) > (110) > (111), in accord with the sequence of stability of these surfaces.15 In a series of studies of CeO2 and Ce0.75Zr0.25O2, Yang et al.17–19 found (110) and (111) surface vacancy formation energies in all cases to be lower than those of the bulk, but in contrast to Balducci,15 they observed no trend in this differential with chemistry. Experimentally, direct detection of oxygen vacancies is challenging, particularly in comparison to the detection of Ce3+. For reasons of electroneutrality, the concentrations of these two types of species are expected to be correlated21 (although other charge compensation modes cannot be entirely ruled out), and thus most experimental work, including the present study, focuses on the detection of reduced trivalent cerium. A number of experimental investigations have shown that the surfaces of undoped22–26 or rare-earth doped27 ceria are more reduced than the bulk, in agreement with computational results. The sole study focused on ceria–zirconia appears to be the work of Zhao et al.28 These authors inferred the Ce3+ concentration on CeO2 and Ce0.5Zr0.5O2 from microkinetic analysis of the measured rate of CO oxidation over reduced powders of the oxides. The results indicated that the vacancy concentration on ceria is almost twice that on Ce0.5Zr0.5O2, suggesting that Zr suppresses the vacancy formation on the oxide surface, in contrast to its vacancy-enhancing influence on the bulk. Beyond this work, limited to the comparison of two specific compositions and without control of surface termination, no other studies have been directed towards the critically important ceria–zirconia system. The present work addresses this gap. Using angle-resolved X-ray Absorption Near Edge Spectroscopy (XANES), we probe both the surface and bulk regions of thin-film ceria–zirconia solid solutions. We show that the surfaces are indeed far more reduced than the bulk, but that contrary to the bulk (and in agreement with the proposal by Zhao for Ce0.5Zr0.5O2), the extent of reduction on the surface decreases with increasing Zr content.We study here (001)-oriented Ce1−xZrxO2−δ films (hereafter CZOxx%, where xx is the Zr content), obtained by growth on yttria-stabilized zirconia (YSZ) of the same orientation. The (001) surface is selected because of the high activity and high surface vacancy concentration of this face relative to the more stable (110) and (111) faces.3,29–32 XANES is selected as the method of characterization because it benefits from facile compatibility with environmental chambers for in situ experiments and because the X-ray penetration depth can be readily varied by changing the angle of incidence, permitting access to both near-surface and bulk regions of a material. Specifically, by fixing the angle of incidence of the incoming X-rays to a value below the critical angle at which total reflection occurs, sensitivity is limited to the top 2–3 nanometers of the material, while use of larger X-ray incident angles provides access to the entire film. Furthermore, quantification of the relative Ce3+ concentration is generally possible by simple linear combination of the spectra of reference materials33 in which the Ce is either fully in the 3+ or 4+ oxidation state. The negligible role of substrate–film interactions on surface redox chemistry is established here by preparing and characterizing a (001)-oriented film of CZO28 on r-sapphire. As shown below, the surface characteristics of this sample were indistinguishable from those of CZO28 grown on YSZ. In addition to the ceria–zirconia films, a film of CeAlO3 was measured to generate XANES Ce3+ reference spectra. This perovskite-structured oxide presents Ce3+ in a 12-fold oxygen coordinated environment, reasonably similar to that of the 8-fold coordination in the fluorite structure.
Film growth
Films, either with a uniform fixed composition (x = 0, 0.15, 0.28 and 0.48) or with a lateral gradient from x = 0.0425 to 0.48, were grown by pulsed laser deposition (PLD). The composition space examined spans the solubility range of Zr into ceria (known to extend to about 50 mol% Zr34,35). The film thickness was fixed at 220 nm such that growth strain at the film surface was fully relaxed,36 yet self-absorption effects in the XANES measurements, which can become severe in thick samples, were negligible.37 To minimize the number of targets required, in most cases films were grown from the end-members CeO2 and CZO48, with intermediate compositions obtained using an alternating, monolayer-by-monolayer approach.38 The CeO2 target was synthesized from commercial powder (99.9% purity, Sigma Aldrich #211575). The powder was compacted under uniaxial pressure and sintered at 1500 °C for 10 h in still air. CZO48 and CZO28 powders were prepared by a wet chemical route. Stoichiometric amounts of Ce(NO3)3·5.90H2O (Alfa Aesar, 99.5% purity) and ZrO(NO3)2·5.98H2O (Alfa Aesar, 99.9% purity) were dissolved in dilute HNO3 and then added to distilled water. Ethylenediaminetetraacetic acid (EDTA) and citric acid were subsequently added to the solution as chelating agents. Ammonium hydroxide was then introduced dropwise to bring the pH of the mixture to ∼10. The solution was heated to 80 °C and held at this temperature under constant stirring until the liquid content was significantly reduced and a thick, reddish gel remained. The products were briefly heat treated at 350 °C in air, and then fully calcined at 700 °C for 8 h. Sintering was carried out by heat treatment of pressed compacts at 1500 °C for 8 h in still air. The intended compositions of the CZO materials were 25 and 45 mol% ZrO2; the quoted compositions of 28 and 48% are based on post-synthesis electron dispersive X-ray spectroscopy (EDS) and X-ray fluorescence (XRF) chemical analyses.Films of CeO2−δ and CZO28 were grown using a PVD PLD/MBE 2300 instrument (KrF 248 nm excimer laser, 1.75 J cm−2 laser energy, 10 Hz repetition rate). The temperature of the substrate, single crystal Y0.16Zr0.84O1.92 (YSZ) (001) (MTI Corp.) or r-cut Al2O3 (MTI Corp.), was fixed at 650 °C in the growth step, and the atmosphere was fixed at 30 mTorr of oxygen. At the conclusion of the deposition, the film was cooled at a rate of 10 °C min−1. Compositionally graded films, as well as films of CZO15 and CZO48, were grown using a custom-built PLD/Laser-MBE System (Pascal Co., Ltd.) equipped with a KrF 248 nm excimer laser (Lambda COMPex Pro, 0.51 J cm−2 laser energy, 5 Hz repetition rate) and the capabilities for monolayer-by-monolayer compositional control.38 During growth, the temperature of the Y0.16Zr0.84O1.92 (YSZ) (001) single crystal substrates (MTI Corp.) was fixed at 640 °C, and the atmosphere was again fixed at 30 mTorr of oxygen. After deposition was complete, the films were cooled at a rate of 5 °C min−1.
A 490 nm film of CeAlO3 was grown using a target prepared from powders synthesized by solid state reaction as follows. Stoichiometric amounts of CeO2 (99.9% purity, Sigma Aldrich) and Al2O3 (99.98% purity, Alfa Aesar CAS# 1334-28-1) were mixed by ball milling for 2 days. The resulting powder was heat-treated at 950 °C in still air for 12 h. Sintering was carried out at 1550 °C under flowing 3% H2/Ar for 50 h. The film growth conditions were identical to those employed for CeO2 and CZO28 with the exception of the use of vacuum as the atmosphere. After deposition and removal from the chamber, the CeAlO3 film was annealed in flowing 3% H2/Ar at 1600 °C for 12 h to ensure that the Ce was fully reduced, as subsequently verified by X-ray diffraction (no other phases were present) and X-ray photoelectron spectroscopy (XPS) about the Ce3d region.
The compositionally graded film was patterned into strips to facilitate the positioning of the X-ray beam for XANES measurements. The pattern of 19 strips (240 μm in width and separated by a spacing of 160 μm) was created using photolithography and ion milling. Specifically, the sample was coated with a photoresist (Shipley 1813) by spin coating (4000 rpm for 50 s), which was then baked at 100 °C for 2 min to drive off solvents and to solidify the film. Following exposure to UV radiation for 12 s through a photomask, the photoresist was developed (Shipley 352) for 40 s. The sample then underwent ion milling for 40 min, removing 230 nm of oxide.
Structural and chemical characterization
X-ray diffraction (Rigaku ATXG, Cu Kα) was used to confirm phase formation of target materials (not shown) and to characterize the crystallographic features of the films. Specular θ–2θ scans, azimuthal ϕ scans, and rocking curve measurements of the non-graded films were collected using this same instrument (Rigaku ATXG, Cu Kα). Micro-area X-ray diffraction patterns of the graded sample were measured using a Rigaku SmartLab diffractometer (Cu Kα) equipped with polycapillary focusing optics (CBO-f unit). The X-ray line source was focused to a spot 400 μm in diameter with an angular divergence of 0.4°. The composition gradient was aligned parallel to the goniometer axis to minimize the range of compositions detected. A Ni filter was placed in front of the detector to absorb Cu Kβ radiation. Atomic force micrographs were recorded using a Bruker Dimension FastScan in tapping mode. The surface roughness of the observed features in the atomic force microscopy (AFM) images was extracted by post image analysis using Nanoscope Analysis software.39As is typical of ceria films on YSZ,40,41 all ceria–zirconia films prepared here were found to grow epitaxially. The specular θ–2θ scans of the non-graded films, Fig. S1(a),† contained only the (00L) peaks permitted of a FCC lattice, whereas the ϕ azimuthal scans, collected for the non-graded films about the surface normal c axis with in-plane 2θ fixed at the (200) geometry, Fig. S1(b),† showed the expected four-fold symmetry. The lattice parameter mismatch between the films and the substrate results in measurable broadening in the rocking curves, Fig. S1(c and d),† particularly at low zirconium content. Nevertheless, the in-plane domain sizes are large, Table S1,† and the root-mean-square surface roughness, as measured by AFM, remained below 0.5 nm (Fig. S2†). In the compositionally graded film, a shift in peak position to higher angle with increasing Zr content was observed, Fig. 1, reflecting the incorporation of the smaller zirconium ions into the CeO2 structure. The positions of the (00L) peaks and the correlation between the lattice parameter and composition reported by Laguna et al.42 were used to infer the composition profile.
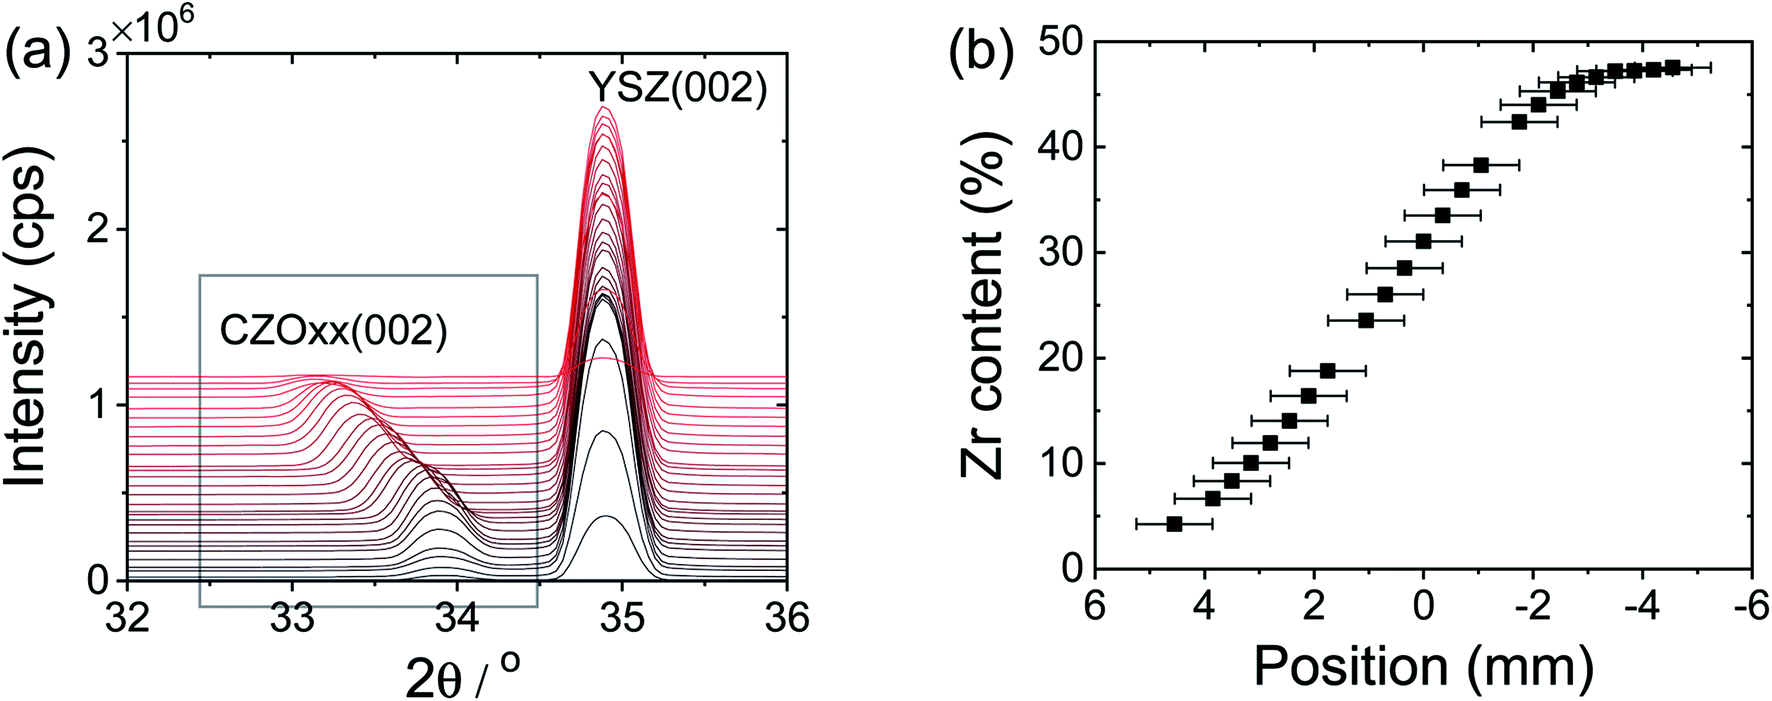 | ||
| Fig. 1 X-ray diffraction study of graded ceria–zirconia film deposited on YSZ (001): (a) specular θ–2θ scan, zoomed in to the region in the vicinity of the (002) peak; and (b) composition inferred from the refined lattice parameter. | ||
The chemical composition along the film thickness of the non-graded films was measured by angle-resolved XRF using synchrotron radiation at an excitation energy of 20480 eV, which is above the Zr K edge. Data were collected at the DuPont-Northwestern-Dow Collaborative Access Team (DND-CAT) 5BM-D station at the Advanced Photon Source (APS), Argonne National Laboratory, using an X-ray beam with a 15 μm (vertical) by 4 mm (horizontal) incident beam size. A Vortex-ME4 silicon drift detector was used to collect the fluorescence signal, where the critical angle was found to be 0.14°. The exit angle was fixed at ≈22° and the incident angle varied between 0.11 and 0.175°, providing access to film depths in the range from ≈3 to ≈80 nm. The penetration depth changes somewhat with the dopant level for a given incident angle, but the measurement nevertheless directly provides depth-resolved composition information for each film. By limiting the maximum penetration depth to ≈85 nm, attenuation of the fluorescence signal as it travels out of the film due to self-absorption was avoided. In all cases, the film composition was uniform along the thickness direction, Fig. S3,† with average compositions of 14.5 ± 0.3, 28.4 ± 1.1 and 47.5 ± 0.8 mol% ZrO2, respectively, for films of target compositions 15, 28 and 48%.
Methods for oxidation state determination by XANES
Using these fully characterized films, we carried out XANES measurements at the Ce L3 edge (2p-to-5d transition) in the fluorescence mode under five sets of conditions: in ambient air at room temperature, 800 °C, and 1100 °C; upon exposure to vacuum at 1100 °C; and upon exposure to hydrogen at 800 °C, as summarized in Table 1. Data from the non-graded films were collected at the DND-CAT 5BM-D station at the APS using a Si (111) double crystal monochromator with an energy resolution of ΔE/E = 1.4 × 10⁻⁴. The incident X-ray beam size was 0.05 (vertical) × 5 (horizontal) mm2. The graded film was measured at the undulator beamline 20-ID-C at the APS using linear polarized X-rays and a Si (111) monochromator with resolution ΔE/E = 1.3 × 10⁻⁴. The full width at half maximum (FWHM) of the X-ray beam was ∼6 μm in both horizontal and vertical directions, focused using KB mirrors. Details of the beamline optics and instrumentation can be found elsewhere.43 In both sets of experiments, the incident X-ray beam intensity was monitored using an ion chamber. For measurements at 5BM-D, the intensity was detuned to 60% of the maximum. The fluorescence signal was measured using Vortex-ME4 silicon drift detectors, set at 90° relative to the incident X-ray beam direction (2 detectors at 5BM-D, 1 detector at 20-ID-C). The X-ray incidence angle α was aligned to a precision better than 0.03° using a set of slits (0.05 × 12 mm2) placed behind the sample. Positioning of the 19 CZO strips of the graded film was accomplished by setting the incident angle to ∼1° and the incident beam energy to 6000 eV, and moving the stage along the gradient direction. XANES spectra, both surface and bulk, were then collected sequentially at each position of interest before moving to the next. The intensity of the Ce fluorescence signal was used to establish the beam position (Fig. S4†). Due to time constraints, only 10 of 19 strips could be studied.| Temp/atm (pO2) | 160 Torr (air) | ∼2.3 mTorr (vacuum) | 7.4 × 10⁻¹⁴ mTorr (“hydrogen”) |
|---|---|---|---|
| a Negligible Ce3+ in the bulk, at all compositions. b Increasing Ce3+ content in the bulk with increasing Zr content.10 | |||
| 25 °C | Gradeda, non-gradeda | ||
| 800 °C | Gradeda, CeO2−δ non-gradeda | Gradedb, CeO2−δ non-gradeda | |
| 1100 °C | Non-gradeda | Non-gradedb | |
To achieve surface sensitivity, XANES spectra were collected using an incidence angle that is smaller than the critical angle, θc, below which X-ray total reflection occurs. The measurement geometry was controlled by placement of the sample on a Huber goniometer mounted onto a 2-circle Huber stage (Fig. S5†). The excitation X-ray photon energy was set at 5733 eV for the non-graded films, and 6000 eV for the compositionally graded film, or 10 and 77 eV, respectively, above the Ce L3 edge (5723 eV). At these excitation energies, the critical angle for the CZO compositions studied is ≈0.45°, as confirmed experimentally (Fig. S6†). At the incidence angle of α ≈ 0.23° used for surface-sensitive measurements, the penetration depths are estimated to be 2–3 nm, and the change in penetration depth on passing through the absorption edge is no more than about 1 nm.37 Bulk sensitivity was achieved by setting α = 10°, at which the penetration depth exceeds the 220 nm thickness of the films. Hereafter, spectra at these two angles are respectively referred to as surface and bulk spectra, although it is to be noted that the ‘bulk’ measurement includes the surface region.
Environmental conditions were controlled using an Anton Paar (DHS1100) dome apparatus. Vacuum conditions were achieved using a turbo pump (Pfeiffer D-35614 Asslar); the oxygen partial pressure is estimated to be 2.3 mTorr on the basis of a residual gas analysis measurement (RGA 200, Stanford Research Systems) of the exhaust stream from the dome apparatus. The measurement under hydrogen was performed using a mixture of 3.5% H2 (balance He), bubbled through H2O (held at 15 °C) so as to achieve an oxygen partial pressure of 7.4 × 10⁻¹⁴ mTorr, as implied by equilibrium between H2O, H2 and O2. It is known that the bulk Ce3+ concentration in CeO2 is negligible under all five of the conditions evaluated.44 The bulk Ce3+ concentration is also negligible for all compositions for the measurements in air.12 Under high temperature, and either vacuum or hydrogen, however, the Ce3+ concentration in the bulk increases with Zr content.12 Thus, the five conditions provide access to a range of bulk oxidation states, the impacts of which on surface characteristics could then be explored.
The Ce3+ concentration was quantified by a linear combination routine using Ce3+ and Ce4+ reference spectra collected here as standards. All analyses were carried out using the Athena45 software package. Each spectrum was normalized to unity by the edge height and the linear background removed. Example reference spectra, specifically from CeAlO3 and CeO2 films measured under ambient conditions and at α = 10°, are shown in Fig. 2. The intense peak at 5725 eV in the CeAlO3 spectrum (ref. 46) is typical of materials bearing the Ce3+ ion including Ce(NO3)3 (ref. 47), Ce(OH)3,48 CePO4,49 Ce2S3,9 and CeF3.50 The XPS measurements (Fig. S7†) similarly revealed only the presence of Ce3+. The CeO2 spectrum is composed of four elemental features: A, B, C, and D. All four features of this complex spectrum have been accounted for satisfactorily by Soldatov et al. as characteristics of fully oxidized CeO2 using a full multiple-scattering approach.51 Even the controversial C feature,9,52,53 though frequently attributed to the presence of Ce3+, has been proven experimentally by high resolution X-ray emission spectroscopy to be a spectral characteristic associated with the Ce4+ cation.54 Upon exposure to high temperature (800 and 1100 °C), the reference spectra are changed as a result of thermal broadening (Fig. S8†). In the case of ceria, the broadening has the apparent effect, at first glance, of increasing the intensity of the C feature, suggesting some thermal reduction and the generation of Ce3+ species. However, the integrated peak intensity associated with this feature (Table S2†) is statistically unchanged in response to the temperature changes, consistent with the thermogravimetric measurements that reveal that the Ce3+ concentration in bulk CeO2 is negligible up to at least 1100 °C in air.44
 | ||
| Fig. 2 Normalized Ce L3 edge XANES spectra of the bulk regions of CeO2 and CeAlO3 films (as indicated), collected under ambient temperature and pressure. | ||
Meaningful implementation of linear combination fitting (LCF) methods for quantitative analysis required measurement of reference spectra for all compositions at the temperatures of interest in order to account for thermal effects. The bulk XANES spectra of CZO films as measured in air at room temperature, at 800 °C, and at 1100 °C are shown in Fig. S9.† The general features of the Zr-bearing films are similar to those of CeO2, with peaks A–D all visible. The heights of peaks A and B increase slightly with increasing Zr content. In addition, the high temperature exposure causes a dampening of features similar to that observed for CeO2, with minimal changes to relative integrated peak intensities. Accordingly, we conclude that high-temperature induced spectral changes again result from thermal vibrations in the structures, without changes in oxidation state, in agreement with bulk thermogravimetric behavior.12 Thus, these high temperature spectra serve as appropriate references for Ce in the 4+ oxidation state for the CZO composition of interest. With this understanding established, the spectra were represented according to
| I(T, CZOxx, condition) = f1 × I(T, CZOxx, air, bulk) + f2 × I(T, CeAlO3, bulk) | (1) |
 | (2) |
Results and discussion
Two pairs of representative spectra comparing bulk and surface-dominated regions of CeO2−δ and CZO4.25 are presented in Fig. 3. The differences between bulk and surface regions are striking. The most intense feature in the surface spectra appears near 5725 eV, which coincides with the intense peak measured for CeAlO3, while peaks A and B become markedly diminished relative to the analogous bulk spectra. The LCF analyses indicate a remarkable 10-fold enhancement of the Ce3+ concentration in the near-surface region relative to that in the bulk. This dramatic difference between surface and bulk reduction is in fact reflected under all of the measurement conditions and for all of the compositions, as summarized in Fig. 4. The complete set of spectra upon which this result is based are provided in Fig. S10 and S11† for the non-graded and graded films, respectively.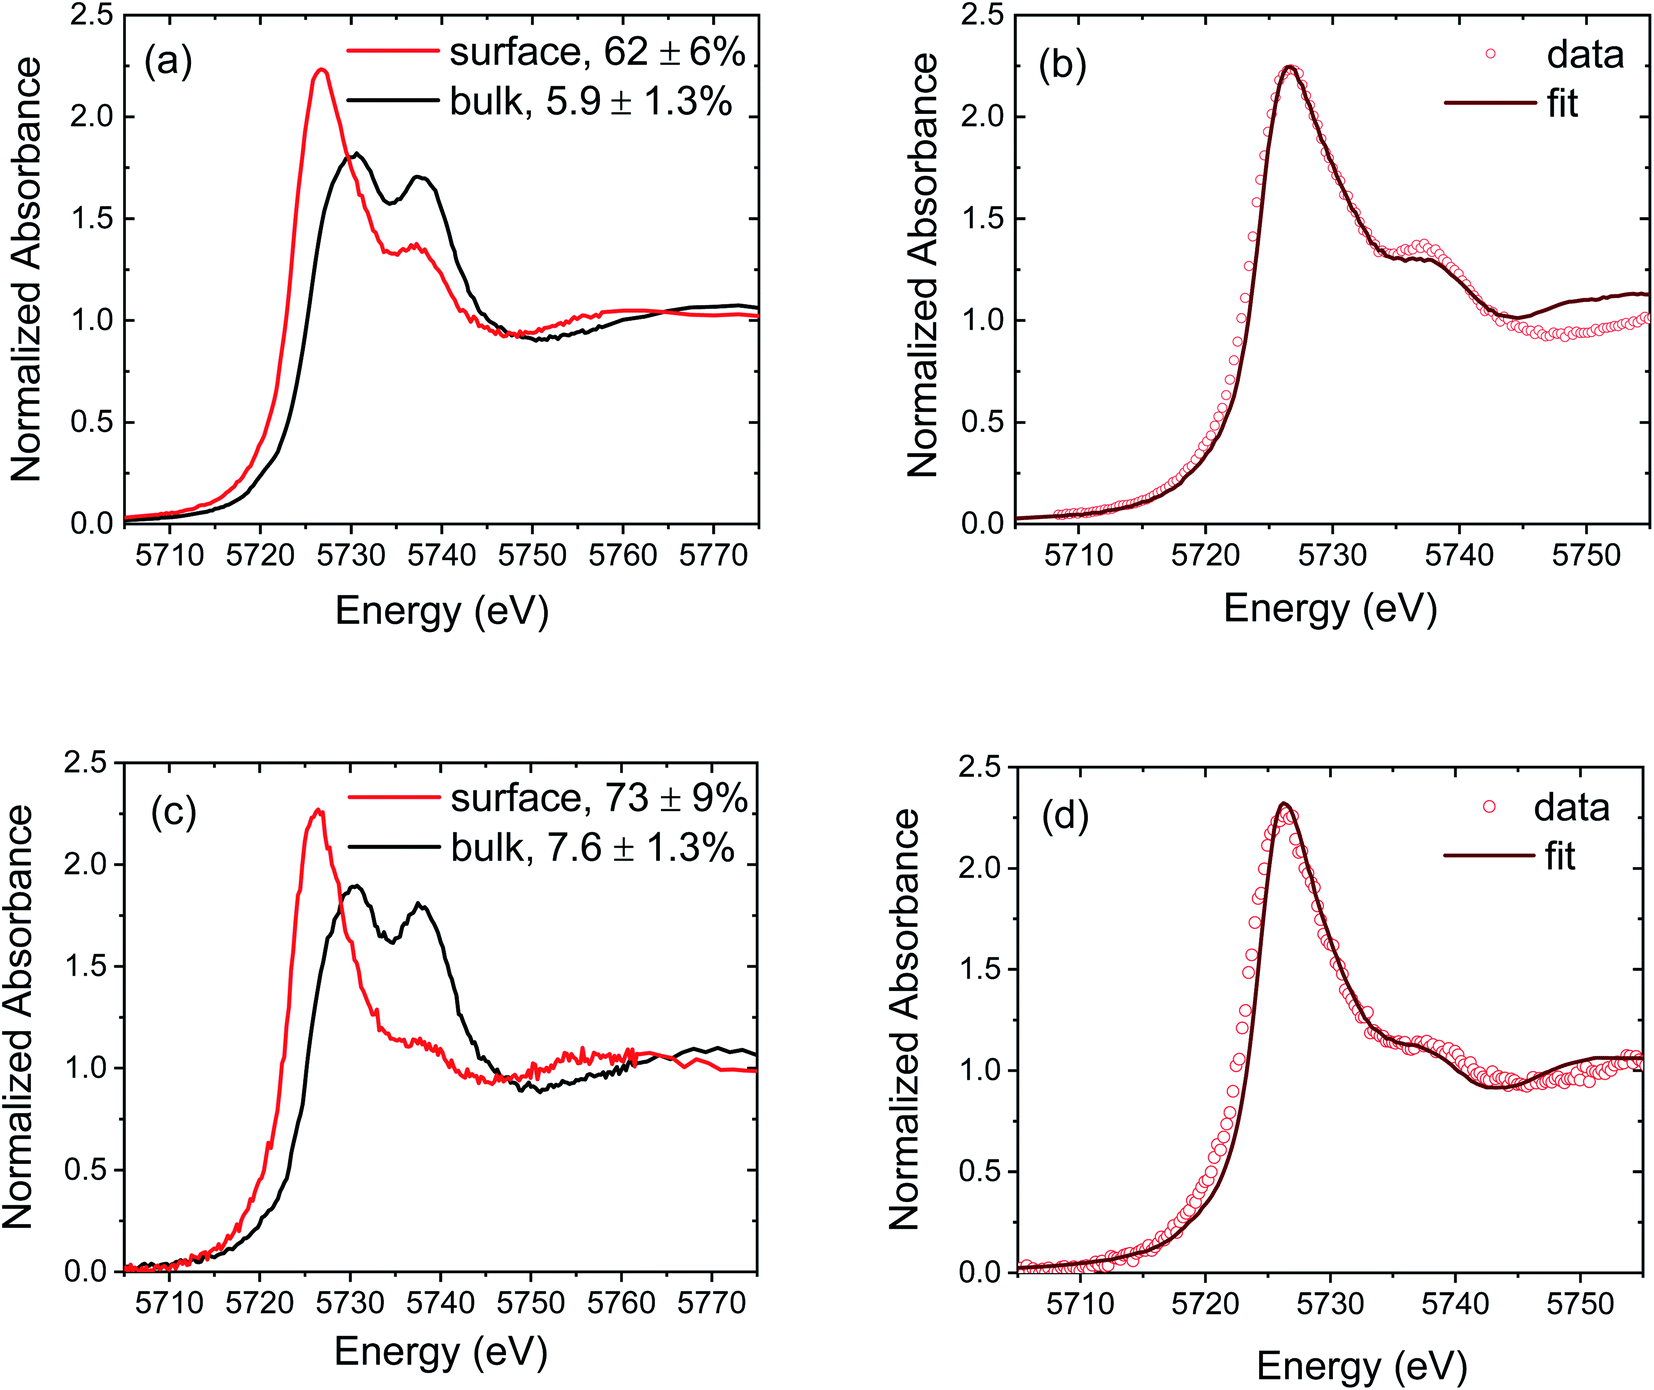 | ||
| Fig. 3 Representative normalized Ce L3 edge XANES spectra of ceria-based films: (a) comparison of the bulk and surface spectra of CeO2−δ measured at 1100 °C under vacuum, (b) linear combination fitting result of the surface spectrum of (a) according to eqn (1), (c) comparison of the bulk and surface spectra of CZO4.25 measured at 800 °C under H2/He, and (d) linear combination fitting result of the surface spectrum of (c) according to eqn (1). In (a) and (c), the concentration of Ce3+, relative to the total Ce content, obtained from the LCF analysis is given in the legend. | ||
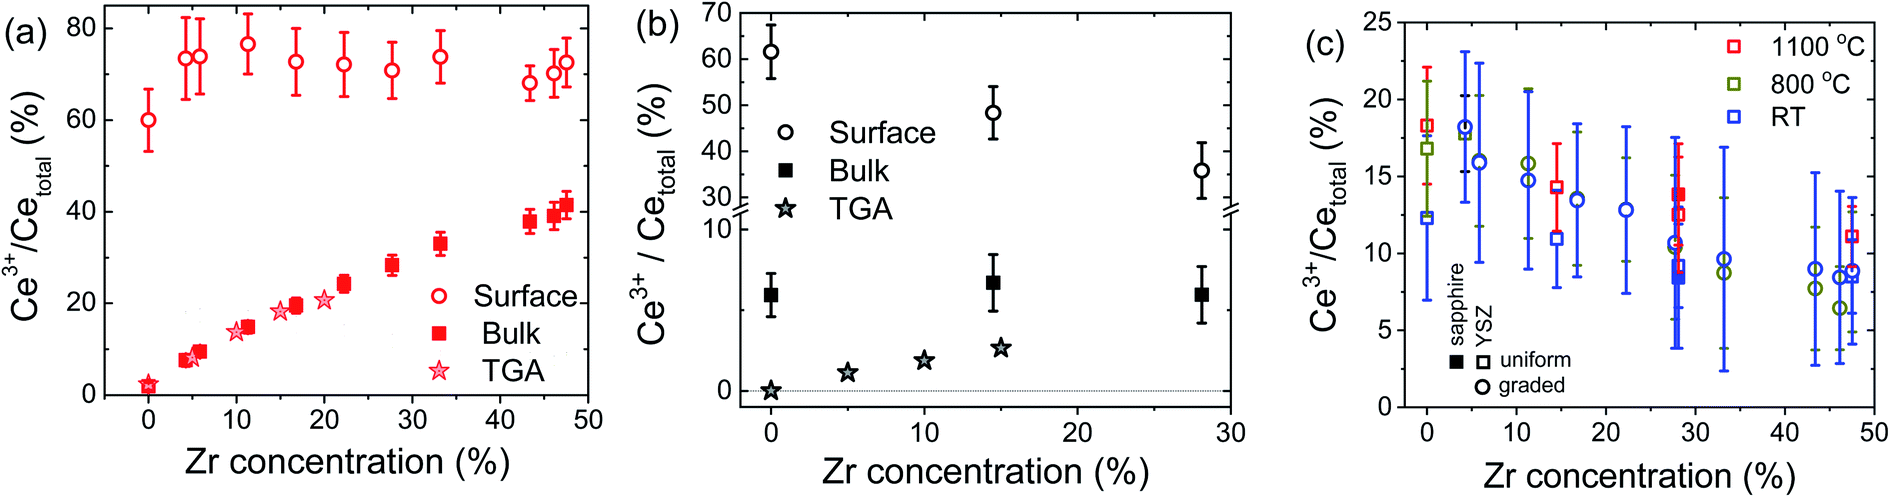 | ||
| Fig. 4 Percentage of Ce in the 3+ oxidation state as a function of zirconium concentration: (a) at the surface and in the bulk as measured at 800 °C under H2 and compared to the bulk TGA12 prediction, (b) at the surface and in the bulk as measured at 1100 °C under vacuum (pO2 ≈ 2.3 mTorr), and compared to the bulk TGA12 prediction; and (c) at the surface as measured in air at the temperatures indicated. The bulk Ce3+ concentrations in air, at all measurement temperatures, are taken to be zero (and provide the reference spectra for the LCF analysis). | ||
Several important trends are evident from Fig. 4. First, at 800 °C and under H2, Fig. 4(a), the bulk Ce3+ concentration is in excellent quantitative agreement with that obtained from bulk thermogravimetric measurements of the oxygen non-stoichiometry.12 The agreement not only gives confidence in the LCF methodology, but also implies that the surface-reduced region does not, within experimental uncertainty, extend beyond the 2–3 nm detected by XANES at α ≈ 0.23°. Second, ∼75% of the Ce in the near-surface region exists as Ce3+ under these conditions, irrespective of film composition. Accordingly, the almost 10-fold enhancement at low Zr content falls to less than a 2-fold enhancement at 48% Zr. In short, the enhanced reducibility of the bulk with increasing Zr content does not translate into an enhanced reducibility at the surface.
Turning to the 1100 °C measurements under vacuum, Fig. 4(b), the XANES measurement indicates a composition independent Ce3+ bulk concentration of ∼6%. Both the magnitude of the bulk Ce3+ concentration and its independence of Zr concentration are unexpected. Under these conditions, the bulk Ce3+ concentration is expected to be negligible for ceria and increase to only ∼5% for CZO28 (from an extrapolation of the reported behavior of up to 20% Zr12). At the same time, the surface Ce3+ concentration determined by XANES falls steeply with Zr content, precisely the opposite of what one expects from the enhanced bulk reducibility. Again, bulk behavior cannot be assumed to describe surface trends.
The disagreement between bulk TGA and bulk XANES results at 1100 °C under vacuum conditions warrants some discussion. The possibility that the discrepancy arises from errors in thermogravimetry is considered small. Taking specifically the ceria film, the XANES result of 5.9% Ce3+ and an assumption that these species are fully charge-compensated by oxygen vacancies imply a CeO1.97 stoichiometry. A change in oxygen content from CeO2 to CeO1.97 would be accompanied by a change in mass of 0.28%, a value routinely detected by gravimetry. Similarly, because of the agreement between the LCF analysis and the TGA results under H2 at 800 °C, even for compositions with low Ce3+ concentrations, we consider the likelihood of the disagreement arising from artifacts of the XANES analysis methodology to be small. An alternative possibility that is also immediately ruled out is a strain-induced discrepancy. Because the lattice constants of the films are larger than those of YSZ, particularly at low Zr content, one might expect the films to be under compressive strain in the near vicinity of the substrate. Reduction, however, induces chemical expansion,55 and therefore any compression would be expected to decrease the extent of film reduction, not increase it beyond the expected thermodynamic value, as is observed. With these possibilities ruled out, we suggest that at 1100 °C, in contrast to the behavior at 800 °C, the surface-reduced region may extend somewhat into the bulk, contributing to the Ce3+ signal detected at an incident angle of 10°. Extension of the reduced region to a depth of just 15–20 nm would yield film-averaged Ce3+ concentrations that are consistent with the bulk TGA results. Convolution of bulk and extended surface contributions, with opposite dependences on Zr content, could thus account for the relative insensitivity of the Ce3+ concentration to composition in the bulk-dominated results.
Turning to the surface reduction in air, Fig. 4(c), the trends here are as surprising as the results under more strongly reducing conditions. As already noted, in air the bulk has negligible Ce3+ content, irrespective of Zr concentration and temperature,12 and the bulk spectra were used to establish the Ce4+ reference spectra at the three measurement temperatures. The surface Ce3+ concentration in air is found to be significant at all temperatures, reaching almost 20% for ceria. Furthermore, the surface reduction decreases with increasing Zr content, similar to the behavior under vacuum at 1100 °C, demonstrating yet again that the surface trends are precisely the opposite of what might be anticipated based on bulk reducibility. Another highly unexpected result is the rather slight sensitivity to temperature. There is no statistical difference between measurements at ambient temperature and 800 °C (graded film), while there is a slight increase in surface reduction on increasing the temperature from 25 to 1100 °C (uniform composition films). Shown in Fig. 4(c) are also results from selected measurements performed using CZO28 on r-sapphire, from which it is apparent that the nature of the substrate has a negligible impact on the measured surface characteristics.
The changes in oxidation state in the films due to the changes in environmental conditions were found to be reversible, as evidenced for example, from the behavior of the uniform-composition CZO48 film (Fig. S12†). The spectra measured at the initiation of the experiment under ambient conditions (25 °C, air) and again after exposure to high temperature, vacuum conditions were identical to one another, for both the surface and bulk regions of the film. The absence of beam-induced film damage, already implied by the reversibility, was directly ascertained by comparing the sequence of spectra measured to generate the integrated spectra used in the analysis. The results, for example from CeO2−δ measured at 1100 °C under vacuum (Fig. S13†), reveal the absence of any temporal evolution.
The enhanced reduction of bulk CZO over ceria has been attributed to the smaller coordination number of Zr relative to that of Ce, with 7-fold coordination of the Zr4+ cation being globally accommodated by a decrease in the Ce oxidation state from 4+ to 3+.11 In the surface region, it is plausible that the disruption to the crystalline structure inherently accommodates 7-fold coordination of Zr4+ without requiring as great a loss of oxygen and thus without requiring as great a change in the Ce oxidation state. If catalytic activity is correlated with the concentration of surface oxygen vacancies, as many have proposed,4,29,30 and Ce3+ surface concentration is indeed proportional to the vacancy concentration, these results suggest that activity decreases with increasing Zr content. To date, there has been no systematic report describing the surface catalytic activity of Ce1−xZrxO2 materials as a function of composition in the absence of convoluting microstructural effects (see, for example, the studies of Aneggi et al.,56 Bulfin et al.,57 and Piumetti et al.58). Hence, it is unknown whether introducing Zr, which is desirable for increasing the thermal stability and bulk oxygen storage capacity, has a detrimental impact on area-specific catalytic reaction rates.
Summary and conclusions
Using XANES measurements in combination with a thin film geometry, the surface and bulk Ce3+ concentrations in a series of Ce1−xZrxO2 materials have been quantified under a range of operationally relevant conditions. The findings are summarized as follows:• Under highly reducing conditions (800 °C, 3.5% H2), the bulk Ce3+ concentration is in quantitative agreement with prior literature values determined from thermogravimetric analysis. Specifically, the Ce3+ concentration (relative to the amount of Ce) increases from 0 to ∼41% with an increase in Zr content from 0 to 48 mol%.
• Under these same conditions, the surface is highly reduced. The Ce3+ concentration is ∼75% and is approximately independent of Zr concentration. Thus, the enhanced bulk reducibility imparted to ceria by Zr is not reflected in the surface properties.
• Under less extreme atmospheric conditions (1100 °C in a vacuum; 1100 °C, 800 °C, and RT in air), the surface is again substantially more reduced than the bulk. Remarkably, the surface Ce3+ concentration decreases with increasing Zr content, in opposition to the trend in the bulk.
• Because all XANES results reported here are those obtained after equilibrium has been achieved, both the surface and bulk concentrations are thermodynamic values, free of any kinetic effects.
• Possible artifacts such as beam damage, or a through-plane gradient in Zr content, or residual stress in the films have all been experimentally ruled out as possible explanations for these results.
Significantly, these findings stand in direct contrast to computational predictions of enhanced surface reducibility in Ce1−xZrxO2 with increasing Zr content. Uncovering the connection, if any, between the surface redox state and catalytic activity in this material class will be the subject of future studies. Beyond the ceria–zirconia system, this work cautions against the use of bulk descriptors, in particular, bulk defect concentrations, as predictors of catalytic activity. Furthermore, the methodology developed here opens up new possibilities for directly measuring and quantifying surface characteristics of redox active oxides under technologically relevant conditions in conjunction with a high-throughput configuration.
Conflicts of interest
There are no conflicts to declare.Acknowledgements
This work was supported primarily by NSF DMR-1505103, with additional partial support provided by the Institute for Catalysis in Energy Processes at Northwestern University under DOE Grant DE-FG02-03ER15457 and MRSEC under NSF Grant DMR-1720139. The XANES and XRF experiments of uniform films were performed at the DuPont-Northwestern-Dow Collaborative Access Team (DND-CAT) located at Sector 5 of the Advanced Photon Source (APS). DND-CAT is supported by Northwestern University, E.I. DuPont de Nemours & Co., and The Dow Chemical Company. This research used resources of the Advanced Photon Source, a U.S. Department of Energy (DOE) Office of Science User Facility operated for the DOE Office of Science by Argonne National Laboratory under Contract No. DE-AC02-06CH11357. Sector 20 operations are supported by the US Department of Energy and the Canadian Light Source. Part of this work made use of the Pulsed Laser Deposition Shared Facility and the X-ray Diffraction Facility at the Materials Research Center at Northwestern University, supported by the National Science Foundation MRSEC program (DMR-1720139) and the Soft and Hybrid Nanotechnology Experimental (SHyNE) Resource (NSF ECCS-1542205).References
- A. Trovarelli, Catal. Rev., 1996, 38, 439–520 CrossRef CAS.
- R. Di Monte and J. Kaspar, Catal. Today, 2005, 100, 27–35 CrossRef CAS.
- S. Liu, X. Wu, D. Weng and R. Ran, J. Rare Earths, 2015, 33, 567–590 CrossRef CAS.
- J. Paier, C. Penschke and J. Sauer, Chem. Rev., 2013, 113, 3949–3985 CrossRef CAS PubMed.
- T. X. T. Sayle, S. C. Parker and C. R. A. Catlow, Surf. Sci., 1994, 316, 329–336 CrossRef CAS.
- E. Mamontov, T. Egami, R. Brezny, M. Koranne and S. Tyagi, J. Phys. Chem. B, 2000, 104, 11110–11116 CrossRef CAS.
- P. Fornasiero, G. Balducci, R. DiMonte, J. Kaspar, V. Sergo, G. Gubitosa, A. Ferrero and M. Graziani, J. Catal., 1996, 164, 173–183 CrossRef CAS.
- C. E. Hori, H. Permana, K. Y. S. Ng, A. Brenner, K. More, K. M. Rahmoeller and D. Belton, Appl. Catal., B, 1998, 16, 105–117 CrossRef CAS.
- F. Zhang, C.-H. Chen, J. M. Raitano, J. C. Hanson, W. A. Caliebe, S. Khalid and S.-W. Chan, J. Appl. Phys., 2006, 99, 084313 CrossRef.
- T. Kim, J. M. Vohs and R. J. Gorte, Ind. Eng. Chem. Res., 2006, 45, 5561–5565 CrossRef CAS.
- M. Kuhn, S. R. Bishop, J. L. M. Rupp and H. L. Tuller, Acta Mater., 2013, 61, 4277–4288 CrossRef CAS.
- Y. Hao, C.-K. Yang and S. M. Haile, Chem. Mater., 2014, 26, 6073–6082 CrossRef CAS.
- J. R. Scheffe and A. Steinfeld, Energy Fuels, 2012, 26, 1928–1936 CrossRef CAS.
- J. C. Conesa, Surf. Sci., 1995, 339, 337–352 CrossRef CAS.
- G. Balducci, J. Kašpar, P. Fornasiero, M. Graziani and M. S. Islam, J. Phys. Chem. B, 1998, 102, 557–561 CrossRef CAS.
- Z. Yang, T. K. Woo, M. Baudin and K. Hermansson, J. Chem. Phys., 2004, 120, 7741–7749 CrossRef CAS PubMed.
- Z. X. Yang, Y. W. Wei, Z. M. Fu, Z. S. Lu and K. Hermansson, Surf. Sci., 2008, 602, 1199–1206 CrossRef CAS.
- Z. X. Yang, Z. M. Fu, Y. W. Wei and K. Hermansson, Chem. Phys. Lett., 2008, 450, 286–291 CrossRef CAS.
- Z. Yang, T. K. Woo and K. Hermansson, J. Chem. Phys., 2006, 124, 7 Search PubMed.
- M. Nolan, S. C. Parker and G. W. Watson, Surf. Sci., 2005, 595, 223–232 CrossRef CAS.
- Z. A. Feng, F. El Gabaly, X. Ye, Z.-X. Shen and W. C. Chueh, Nat. Commun., 2014, 5, 4374 CrossRef CAS PubMed.
- F. Zhang, P. Wang, J. Koberstein, S. Khalid and S. W. Chan, Surf. Sci., 2004, 563, 74–82 CrossRef CAS.
- S. Deshpande, S. Patil, S. Kuchibhatla and S. Seal, Appl. Phys. Lett., 2005, 87, 3 CrossRef.
- P. Dutta, S. Pal, M. S. Seehra, Y. Shi, E. M. Eyring and R. D. Ernst, Chem. Mater., 2006, 18, 5144–5146 CrossRef CAS.
- S. Kim, R. Merkle and J. Maier, Surf. Sci., 2004, 549, 196–202 CrossRef CAS.
- S. C. DeCaluwe, M. E. Grass, C. Zhang, F. E. Gabaly, H. Bluhm, Z. Liu, G. S. Jackson, A. H. McDaniel, K. F. McCarty, R. L. Farrow, M. A. Linne, Z. Hussain and B. W. Eichhorn, J. Phys. Chem. C, 2010, 114, 19853–19861 CrossRef CAS.
- W. C. Chueh, A. H. McDaniel, M. E. Grass, Y. Hao, N. Jabeen, Z. Liu, S. M. Haile, K. F. McCarty, H. Bluhm and F. El Gabaly, Chem. Mater., 2012, 24, 1876–1882 CrossRef CAS.
- Z. L. Zhao, M. Uddi, N. Tsvetkov, B. Yildiz and A. F. Ghoniem, Phys. Chem. Chem. Phys., 2017, 19, 25774–25785 RSC.
- Z. X. Yang, T. K. Woo, M. Baudin and K. Hermansson, J. Chem. Phys., 2004, 120, 7741–7749 CrossRef CAS PubMed.
- E. Aneggi, J. Llorca, M. Boaro and A. Trovarelli, J. Catal., 2005, 234, 88–95 CrossRef CAS.
- A. Trovarelli and J. Llorca, ACS Catal., 2017, 7, 4716–4735 CrossRef CAS.
- V. K. Paidi, L. Savereide, D. J. Childers, J. M. Notestein, C. A. Roberts and J. van Lierop, ACS Appl. Mater. Interfaces, 2017, 9, 30670–30678 CrossRef CAS PubMed.
- G. Bunker, Introduction to XAFS. A Practical Guide to X-ray Absorption Fine Structure Spectroscopy, Cambridge University Press, 2010 Search PubMed.
- A. I. Kozlov, D. H. Kim, A. Yezerets, P. Andersen, H. H. Kung and M. C. Kung, J. Catal., 2002, 209, 417–426 CrossRef CAS.
- P. Duran, M. Gonzalez, C. Moure, J. R. Jurado and C. Pascual, J. Mater. Sci., 1990, 25, 5001–5006 CrossRef CAS.
- A. Fluri, D. Pergolesi, A. Wokaun and T. Lippert, Phys. Rev. B, 2018, 97, 125412 CrossRef CAS.
- M. Birkholz, Thin Film Analysis by X-ray Scattering, Wiley-VCH, 2006 Search PubMed.
- H. Koinuma and I. Takeuchi, Nat. Mater., 2004, 3, 429 CrossRef CAS PubMed.
- M. Charnley, J. Gilbert, O. G. Jones and N. P. Reynolds, Bio-Protoc., 2018, 8, 2732 Search PubMed.
- W. C. Chueh, Y. Hao, W. Jung and S. M. Haile, Nat. Mater., 2012, 11, 155–161 CrossRef CAS PubMed.
- W. C. Chueh and S. M. Haile, Phys. Chem. Chem. Phys., 2009, 11, 8144–8148 RSC.
- O. H. Laguna, A. Perez, M. A. Centeno and J. A. Odriozola, Appl. Catal., B, 2015, 176, 385–395 CrossRef.
- S. M. Heald, J. O. Cross, D. L. Brewe and R. A. Gordon, Nucl. Instrum. Methods Phys. Res., Sect. A, 2007, 582, 215–217 CrossRef CAS.
- R. J. Panlener, R. N. Blumenthal and J. E. Garnier, J. Phys. Chem. Solids, 1975, 36, 1213–1222 CrossRef CAS.
- B. Ravel and M. Newville, J. Synchrotron Radiat., 2005, 12, 537–541 CrossRef CAS PubMed.
- A. Martínez-Arias, M. Fernández-García, L. N. Salamanca, R. X. Valenzuela, J. C. Conesa and J. Soria, J. Phys. Chem. B, 2000, 104, 4038–4046 CrossRef.
- J. Zhang, Z. Y. Wu, T. Liu, T. D. Hu, Z. H. Wu and X. Ju, J. Synchrotron Radiat., 2001, 8, 531–532 CrossRef CAS PubMed.
- J. El Fallah, S. Boujana, H. Dexpert, A. Kiennemann, J. Majerus, O. Touret, F. Villain and F. Lenormand, J. Phys. Chem., 1994, 98, 5522–5533 CrossRef CAS.
- A. Bianconi, A. Marcelli, M. Tomellini and I. Davoli, J. Magn. Magn. Mater., 1985, 47–48, 209–211 CrossRef CAS.
- G. Kaindl, G. K. Wertheim, G. Schmiester and E. V. Sampathkumaran, Phys. Rev. Lett., 1987, 58, 606–609 CrossRef CAS PubMed.
- A. V. Soldatov, T. S. Ivanchenko, S. Della Longa, A. Kotani, Y. Iwamoto and A. Bianconi, Phys. Rev. B: Condens. Matter Mater. Phys., 1994, 50, 5074–5080 CrossRef CAS PubMed.
- G. Kaindl, G. Schmiester, E. V. Sampathkumaran and P. Wachter, Phys. Rev. B: Condens. Matter Mater. Phys., 1988, 38, 10174–10177 CrossRef CAS PubMed.
- P. Nachimuthu, W. C. Shih, R. S. Liu, L. Y. Jang and J. M. Chen, J. Solid State Chem., 2000, 149, 408–413 CrossRef CAS.
- G. Gasperi, L. Amidani, F. Benedetti, F. Boscherini, P. Glatzel, S. Valeri and P. Luches, Phys. Chem. Chem. Phys., 2016, 18, 20511–20517 RSC.
- D. Marrocchelli, S. R. Bishop, H. L. Tuller and B. Yildiz, Adv. Funct. Mater., 2012, 22, 1958–1965 CrossRef CAS.
- E. Aneggi, C. de Leitenburg, J. Llorca and A. Trovarelli, Catal. Today, 2012, 197, 119–126 CrossRef CAS.
- B. Bulfin, F. Call, J. Vieten, M. Roeb, C. Sattler and I. V. Shvets, J. Phys. Chem. C, 2016, 120, 2027–2035 CrossRef CAS.
- M. Piumetti, S. Bensaid, D. Fino and N. Russo, Appl. Catal., B, 2016, 197, 35–46 CrossRef CAS.
Footnote |
| † Electronic supplementary information (ESI) available. See DOI: 10.1039/d0ta02762f |
| This journal is © The Royal Society of Chemistry 2020 |