 Open Access Article
Creative Commons Attribution 3.0 Unported Licence
Investigation of the swollen state of Carbopol molecules in non-aqueous solvents through rheological characterization†
Simona
Migliozzi
,
Giovanni
Meridiano
 ,
Panagiota
Angeli
 * and
Luca
Mazzei
 *
*
Department of Chemical Engineering, University College London, Torrington Place, London WC1E 7JE, UK. E-mail: l.mazzei@ucl.ac.uk; p.angeli@ucl.ac.uk
First published on 28th September 2020
Abstract
We explore how different types of solvent influence the rheological properties of non-aqueous Carbopol dispersions from the dilute to the jammed state. In novel non-aqueous formulations, polar solvents are used more and more frequently, because they can form Carbopol microgels without the need of any neutralizing agents. However, the swelling behaviour of Carbopol molecules in the absence of water, when ionic forces are weak, is still poorly understood. To this end, we study the swelling behaviour of Carbopol 974P NF in different polar solvents, i.e. glycerol, PEG400 and mixtures of the two solvents, by mapping the rheological behaviour of Carbopol suspensions from very dilute to highly concentrated conditions. The rheological study reveals that the onset of the jamming transition occurs at different critical polymer concentrations depending on the solvents used. Nevertheless, once the jammed state is reached, both elastic and yielding behaviours are scalable with the particle volume fraction. These results suggest that the type of solvent influences the final volume of the single Carbopol particles but does not alter the interactions between the particles. The final radius of the swollen particles is estimated from shear rheology measurements in dilute conditions, showing a decrease of the final swelling ratio of Carbopol molecules of almost 50% for PEG400 solutions, a result that confirms the shift to higher values of the critical jamming concentration obtained from linear viscoelasticity for the same solutions.
1 Introduction
In the past decades, the scientific and technological relevance of microgel suspensions has motivated extensive experimental and theoretical research.1,2 These systems are formed by crosslinked polymeric molecules, usually of colloidal dimension, which swell when dispersed in an appropriate solvent, creating a suspension of soft elastic particles. As a result of this polymer-colloid duality, microgel suspensions present a unique phenomenology that unifies the rheological behaviour of hard colloidal spheres and polymeric macrogels,3,4 a characteristic that makes them extremely valuable in a wide range of industrial and scientific applications. In the study of these suspensions, there has been great interest in particle–particle interactions5–8 and in the properties of the individual polymer particles9–12 (i.e., chemistry and crosslinking structure), because both influence the macroscopic behaviour of microgel suspensions and can potentially provide a path towards the design of novel formulations.Microgels that have received special attention owing to their wide industrial use are carbomers, also known with the commercial name of Carbopol. These molecules are high molecular weight polymers of polyacrylic acid crosslinked with polyalkenyl ethers or divinyl glycol.13 Because of their nontoxicity, stability, high thickening properties and transparency, these polymers have been widely employed in cosmetics and pharmaceutical applications14,15 as well as model yield stress fluids in academia.16–19
In the vast majority of applications, Carbopol preparations are water-based. In water, the molecule swelling is induced by the dissociation of acrylic acid, which constitutes the monomeric unit of Carbopol. Typically, a base is added during the preparation to neutralise the acidic groups, a process that causes the ionization of the carboxylate groups. Similar to most polyelectrolytes, the final swollen configuration depends on the internal density of uncompensated ions on the polymer backbone: the larger the density of these ions, the higher the difference in osmotic pressure between the internal crosslinked network and the external environment. This imbalance promotes the diffusion of solvent molecules inside the coiled Carbopol molecule, a process that makes the particles swell.20 The final system results in a clear suspension of soft elastic particles, whose final dimensions are controlled by the pH of the solution.21–23
The rheological properties of water-based Carbopol microgels in the concentrated regime have been investigated extensively for many types of Carbopol molecules,17,20,24,25 showing a typical soft glass behaviour, which can be described macroscopically by the Herschel–Bulkley constitutive equation.17,23,26 Nonetheless, some discrepancies, mainly in the form of thixotropic behaviour,27–29 were observed for systems that experienced different preparations, showing that the yielding behaviour of these systems is strongly influenced by changes in the internal microstructure,19,21,30 changes that can be induced by different preparation protocols or by the presence of additives.13,31,32 This aspect becomes particularly relevant in the development of novel non-aqueous formulations, where the combined effect of different solvents is difficult to predict.
Specifically, the use of organic solvents, instead of water, is important for various pharmaceutical applications that require addition of water-insoluble drugs or of active components which require in situ activation via water.33 The swelling behaviour of Carbopol molecules in the absence of water, when ionic forces are weak, is still poorly understood. It is known that some polar solvents, such as glycerol and poly(ethylene glycols) of low molecular weight, can initiate the swelling without the use of neutralising agents.34,35 This suggests that (i) polar solvents dissociate part of the carboxyl groups constituting the Carbopol backbone, thus unbalancing the osmotic pressure between the inside and the outside of the macromolecule and initiating the swelling process; (ii) compared to water, the organic nature of the solvents ensures a greater affinity with the Carbopol network, which promotes the internal diffusion of the solvent molecules even at low degree of dissociation. In these cases, the dimensions of the solvent molecules and their affinity with the carbomer structure can affect the final swollen conformation and alter the strength of colloidal interactions between microgel particles. The effect of co-solvents on the final properties of Carbopol dispersions has been investigated by some authors,15,34,36 showing differences in the viscoelastic response of the material, yet no coherent analysis has been made in terms of how different solvents affect the swelling of Carbopol molecules and their interactions and how the rheological properties can be scaled accordingly.
In this work we seek to investigate the effect of polar solvents on the swelling and mutual interaction of Carbopol molecules and understand how these phenomena might impact the rheological design of novel non-aqueous formulations employing co-solvents. To this end, we study the rheology of dispersions of Carbopol 974P NF (C974P NF) in three different media, (i) poly(ethylene glycol) MW = 400, (ii) glycerol and (iii) a 50/50 wt% mixture of the two solvents, by mapping the behaviour from dilute to highly concentrated conditions. Thanks to the high crosslinking density of C974P NF, the molecules are expected to maintain a well defined particle identity even when they are swollen, an attribute that allows rationalizing the rheological properties of the dispersions in the framework of soft particle suspensions. For all solvents, we conducted small-amplitude oscillatory tests to characterise the onset of the jamming transition in the three different media. These were followed by large-amplitude sweeps and steady shear tests to investigate the changes in the particle–particle interactions that different solvents might induce on the yielding of the suspensions. Studying the yielding behaviour of microgel systems has proven to be extremely valuable for identifying the driving mechanism of their liquid-to-solid transition, distinguishing between a purely cage-driven process, typical of repulsive glasses,37,38 and a bond-driven process, triggered by particle–particle attractions.39–41 In the absence of free ionic charges and polymer additives, the solvent type can affect the interparticle interactions in different ways, e.g., altering the repulsion between electric double layers, through a change of the dielectric constant of the solvent or affecting the steric stabilisation of the particles through the strength of solvation.42 In the case of commercial molecules such as Carbopols, predicting or characterizing rigorously how different solvents affect the interparticle interactions is arduous. Hence, we limited our study to finding evidence of changes in the interparticle interactions which could significantly alter the liquid-to-solid transition of C974P NF molecules dispersed in different solvents. Finally, the dimensions of swollen Carbopol particles in each medium were estimated from viscosity measurements conducted in dilute conditions and compared with direct observations of swollen unconfined Carbopol molecules through fluorescence confocal imaging.
The paper is structured as follows: in Section 2 materials and descriptions of samples preparation are first presented, followed by details of the experimental methods. In Section 3 all the rheological results are shown and discussed. Conclusions are given in Section 4.
2 Experimental methods
2.1 Materials and samples preparation
Carbopol 974P NF (C974P NF, Lubrizol Limited), the compound used in this study, is generally classified as a polymer of acrylic acid highly crosslinked with allyl pentaerythritol.13 Carbopol dispersions in the range of polymer mass fractions between 0.15% and 8% were prepared in each of the three solvents mentioned: (i) poly(ethylene glycol) (PEG MW = 400 Da, Sigma-Aldrich, UK), (ii) glycerol (purity > 99%, Sigma-Aldrich, UK) and (iii) a 50/50 wt% mixture of the two solvents.The densities and viscosities of the solvents at ambient temperature (T = 25 °C) are reported in Table 1 together with the apparent density ρp and the hydrodynamic diameter RIN of the unswollen Carbopol particles. ρp was detrmined by picnometry in hexane (Reagent grade ≥ 99%, Honeywell) to preserve the internal dry state of the unswollen particles,20 whilst RIN was determined through dynamic light scattering (DLS) measurements, performed using a DelsaMax-Pro DLS analyzer (Beckman Coulter, Brea, CA, USA) at 25 °C. For these tests, Carbopol was dispersed in isopropanol (Certified AR for analysis, Fischer Chemical) to prevent particle aggregation and consequent settling for the duration of the test and at the same time prevent any swelling. In fact, alcohols can swell Carbopol molecules only in the presence of a neutralising agent.34 Tests repeated on the same sample after one week confirmed the particle dimensions obtained in the first instance, corroborating the absence of any swelling.
Carbopol molecules can swell in the absence of a neutralizing agent in all three solvents chosen; therefore, to ensure samples were reproducible, it was crucial to disperse the polymer homogeneously into the liquid phase before significant swelling occurred. Since Carbopol swells more slowly in PEG400,35 the polymer powder was first dispersed in PEG400 at a controlled temperature of 20 °C, using a high-shear mixer (Silverson, L5 Series) working at 7000 rpm for approximately five minutes; then, the concentrated dispersions were diluted with PEG400 or PEG400/glycerol mixtures to reach the final concentrations required. After dilution, the solutions were gently mixed with a magnetic stirrer in small batches of 20 g until they fully homogenized (∼10 s). The vials were then left overnight in an ultrasonic bath (SciQuip Ultrasonic bath, heated, 150 W) at 50 °C. Given the quick swelling response of Carbopol in glycerol, a different approach was required to prepare the samples in pure glycerol. First the glycerol was heated up with a stirred hot plate to reduce its viscosity and form a central vortex; at this point, the required amount of Carbopol was poured gradually to avoid lumps. Once all the Carbopol had been added, the magnetic stirrer was switched off and the solution was stirred with a mechanical stirrer at 800 rpm for 15 minutes and then left overnight at 150 rpm. At the end of the process the samples were perfectly clear and uniform. For the most diluted samples, a stock solution at 0.7 wt% of Carbopol in glycerol was prepared, as explained above, and then further diluted with glycerol to obtain the final samples with the correct Carbopol content. All samples were usually left at rest for a minimum of three days before conducting any rheological tests. For brevity from here on we refer to the final Carbopol dispersions in the three different solvents as P (PEG), G (glycerol) and PG (50/50 wt% PEG/glycerol) dispersions.
2.2 Rheological measurements
All rheological measurements were performed with an Anton Paar MCR302 stress-controlled rotational rheometer. The instrument was equipped with a Peltier plate to precisely control the operating temperature and a parallel plate geometry (OD: 40 mm) with sand blasted surfaces (surface roughness of 2 μm) to avoid slip effects. All tests were carried out with a gap of 900 μm at a constant temperature of 25 °C. To avoid solvent evaporation, sample menisci were sealed with silicon oil, which enabled reliable measurements on the same sample for more than 10 hours. We performed three different rheological tests: (i) small-amplitude oscillatory shear (SAOS) tests, (ii) large-amplitude oscillatory shear (LAOS) tests and (iii) steady shear tests. Before all tests, samples were pre-sheared at a constant shear rate of 100 1/s for 60 s and left to rest for 900 s, which we verified to be sufficient to remove any mechanical history and obtain reproducible data for all tests (see S1, ESI†).SAOS experiments were carried out to obtain insights into the changes of the sample microstructure induced by different Carbopol concentrations and to find the characteristic concentration at which the liquid-to-solid transition takes place for the different solvents used. To this end, the viscoelastic response of the samples to a sinusoidal deformation with fixed amplitude in the linear regime (i.e., γ = 0.6%) was recorded in the range of angular frequencies ω = 0.01–100 rad s−1 and the corresponding values of the storage (G′) and loss (G′′) moduli were measured. All samples showing a readable elastic response were then tested through oscillatory amplitude sweeps experiments to investigate their yielding behaviour. LAOS tests were performed with fresh samples at a constant angular frequency of 1 rad s−1 in the range of amplitudes γ = 0.001–1000%. To complete the analysis of the rheological properties in the limit of non-linear deformations, we performed steady shear experiments, applying constant shear rates ![[small gamma, Greek, dot above]](https://www.rsc.org/images/entities/i_char_e0a2.gif) from 0.001 to 1000 1/s and recording the shear stress σ once steady state was reached. Data gathered from the most diluted samples were used to estimate the dimensions of the swollen particles in the three media. Note that, since we used a parallel-plate geometry, all the steady shear rheological data presented in the following sections represent the true values of stress and viscosity obtained by applying the Weissenberg–Rabinowitsch correction to the raw experimental data.
from 0.001 to 1000 1/s and recording the shear stress σ once steady state was reached. Data gathered from the most diluted samples were used to estimate the dimensions of the swollen particles in the three media. Note that, since we used a parallel-plate geometry, all the steady shear rheological data presented in the following sections represent the true values of stress and viscosity obtained by applying the Weissenberg–Rabinowitsch correction to the raw experimental data.
2.3 Confocal fluorescence microscopy
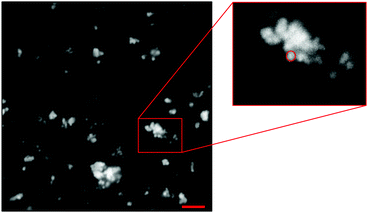
Confocal fluorescence microscopy was implemented to obtain direct images of swollen Carbopol particles in unconfined conditions and compare the results with the rheological findings. To this end, diluted dispersions at 0.1 wt% of labelled Carbopol were prepared following the same procedure described in Section 2.1. Carbopol particles were chemically labelled with rhodamine-123 (R123 mitochondrial specific fluorescent dye, Sigma Aldrich, UK). The labelling reaction is based on the method described by Laguecir et al.43 for uncrosslinked polyacrylic acid molecules. The method involves attaching two intermediaries, n-hydroxysulfisuccinimide sodium salt (Sigma Aldrich, UK) and 1-[3-(dimethylamino)-propyl]-3-ethylcarbodiimide (Sigma Aldrich, UK), to the C974P NF monomeric units. The intermediaries are then substituted by R123. The solution is then purified via dialysis and freeze dried.44 The final labelled powder was provided by the group of Prof. Paul Bartlett (School of Chemistry, University of Bristol, UK). The use of labelled Carbopol particles as opposed to the addition of a fluorescent dye in solution13,22,45 allows distinguishing single particles and therefore measuring the average particle diameter of the swollen molecules. The diluted solutions were placed on a glass bottom dish (X20, Fischer Scientific, UK) and examined with a LSM 710 (Zeiss) confocal microscope equipped with an oil immersion objective (Plan-Apochromat 63x/1.4 Oil DIC M27, Zeiss). Samples were illuminated with an Argon laser (λ = 512 nm) with collected fluorescence bandwidth set to [519–682 nm]. A sample image obtained from Confocal microscopy is shown in Fig. 1. For all samples at 0.1 wt% of Carbopol, we observed a sparse particle phase where individual particles can be distinguished. Particles appear aggregated in small clusters, well dispersed in solution, showing an acceptable efficiency of the dispersion step (further images are shown in S2, ESI†). Confocal images reported by other authors at similar Carbopol concentrations in water with adjusted pH13,22,28 are generally denser and in some cases present large connected areas. Besides the different protocol we used to tag the Carbopol molecules, as explained above, the dissimilar results may be due to a difference in the effective volume fraction of Carbopol in our samples, which is significantly lower than those reported in the literature. This is related to the smaller swelling degree obtained when Carbopol is not completely neutralised, as it is in our case, as opposed to the cases reported above, where an optimal amount of neutralising agent was always added in solution to reach the maximum swollen dimension attainable by the specific Carbopol molecule.The images were analysed with Fiji-ImageJ software. Particles were identified manually, the areas (i.e., the number of pixels occupied by each particle) were collected, and the radii, calculated as the radius of the equivalent circle that occupies the same area (Fig. 1), were used to create particle size distributions for different solutions. Particle sizes are at the limit commonly associated with colloidal particles (≈1 μm)46 and close to what is typically indicated by the manufacturer21 or by other authors for C974P NF.13 The average particle radii, estimated on a sample of 100 particles per solvent type, is of 660 ± 39 nm and 654 ± 26 nm for G and PG solutions, respectively. Within their standard deviations, the values are equal. A lower particle radius is found for P solutions (around 563 ± 15 nm). This result is based on a lower number of particles (around 20), given the higher difficulty to individuate single particles in this sample. These results suggest a reduction of the swollen particle dimension when only PEG400 is used, even though final conclusions cannot be drawn simply from this difference, which is too close to the limits of resolution of the images.
The swollen particle sizes obtained from the confocal images can be taken as a first particle size reference and used to evaluate the apparent particle volume fractions of the samples investigated. A table summarising all mass fractions implemented in the rheological investigations and corresponding apparent volume fractions can be found in the ESI† (S2). Given the uncertainties related to the particle dimensions and the great sensitivity to volume fraction of the rheological response of these systems, especially in the denser regimes, all data will be presented as a function of mass fractions and values of the corresponding apparent volume fractions ϕ will be given only as a gross indication of the extent of particle confinement.
3 Results and discussion
3.1 Linear viscoelastic properties – SAOS
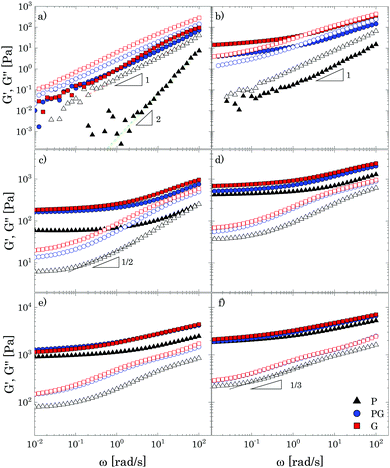
Oscillatory tests at small amplitudes show a clear transition in the structural behaviour of the solutions upon increasing the amount of Carbopol (Fig. 2). For polymer mass fractions lower than 0.2 wt%, all suspensions present a purely viscous behaviour, with the loss modulus linearly proportional to the solvent viscosity (i.e., G′′ ∝ ωηs) and the storage modulus undetectable (i.e., G′ = 0) in the entire range of frequencies tested. This indicates that below 0.2 wt% particle interactions are negligible and the macroscopic elastic properties of the suspensions are related solely to the elasticity and the thermal energy of the single particles.4 This contribution is extremely small and can hardly be measured, resulting in a purely viscous behaviour. As the polymer concentration increases to mass fractions of 0.4 wt%, while P solutions still present a purely viscous behaviour, for G and PG solutions, which approximately have a particle volume fraction of 0.4 (see Table S2.2, ESI†), the particles contribution becomes more appreciable and the macroscopic elastic properties of the suspension can be detected. In this regime, particle interactions and confinements appear still negligible and the suspensions display the typical behaviour observed for a Maxwell fluid in the viscous limit (also referred to as terminal viscous regime), with G′ ∝ ω2 and G′′ ∝ ω. This indicates that the longest relaxation time of the solutions is far smaller than the reciprocal of the highest frequency tested (i.e., Demax ≡ λmaxωmax ≪ 1, where De is the Deborah number).For a further increase of mass fraction to 0.7 wt% (Fig. 2a), P solutions present the same terminal viscous regime observed for G and PG solutions at 0.4 wt%, whilst the G and PG solutions deviate from it, with the storage and loss moduli having a similar slope of 1 in the window of frequencies sampled. The viscous components are still higher than their elastic counterparts, but an anomalous power law of the storage modulus (1 instead of 2) is observed. The same behaviour is shown by P solutions at 1 wt% (Fig. 2b). The indicative apparent volume fractions associated with these conditions are between 0.6 and 0.7, indicating significant particle confinement; this entails a more complex response to linear deformations, because a local rearrangement of particles can propagate and cause a second rearrangement elsewhere in the material and so on. This leads to a distribution of relaxation times resulting in an anomalous macroscopic rheological response,47 as seen in Fig. 2a.
At a Carbopol mass fraction of 1 wt%, G and PG solutions start to show a plateau of G′ at low frequencies followed by a crossover where G′′ slightly overtakes G′. This behaviour suggests that particle confinement is more significant than in P solutions, the G and PG solutions being closer to a disordered arrested state where particles are caged by their neighbours. As the G and PG solutions approach this state, their macroscopic elastic response becomes gradually controlled by the elasticity of the whole network of particles; consequently, the storage modulus gradually increases and the frequency interval in which it is constant widens. On the other hand, the viscous response is controlled by the viscous dissipation in the solvent, which arises from the superposition of the dissipation induced in the liquid by the particle motion and the dissipation induced in the liquid by the deformation applied to the sample externally. While the second contribution increases with the frequency monotonically, independently of the particle concentration, the first is significant only in a (low) range of frequencies related to the characteristic distribution of relaxation times Hc(λ), which, in turn, is associated with the particles mobility. In particular, the dissipation induced by the particle motion is important when λminω ≪ 1, where λmin is the lowest value for which Hc(λ) is significant. As particles are increasingly confined, their movements are more and more restricted and the contribution to the total viscous dissipation induced by particle motion becomes more significant. This entails that, in comparison with the purely viscous case, the total viscous dissipation in the solutions increases at lower frequencies, as observed by comparing the trend of G′′ for G and PG solutions in Fig. 2a and b.
In a generic repulsive system of Brownian particles, by further increasing particle confinement, the system eventually reaches the onset of the glass transition, where particles are trapped in metastable cages formed by their neighbours. In these conditions, each particle can move in the cage with a characteristic time related to its Brownian motion, but it will only be able to escape its position for times exceeding those experimentally observable.1 Hence, the viscous response in the glassy regime is dominated by the “outside the cage” motion (α-relaxation) at very low frequencies, usually unattainable in the range of experimental frequencies achievable, by the “in-cage” motion (β-relaxation) at intermediate frequencies (λminω ≪ 1), and by the viscous dissipation induced in the solvent by the external deformation at higher frequencies. This physical picture translates in a specific viscous response, which is typically characterised by the appearance of a minimum for G′′ in the range of frequencies experimentally accessible, associated with the characteristic relaxation time of the in-cage motion, followed by a power law increase with ω, where G′′ gradually reaches G′. As the particle concentration is further increased, the in-cage motion is limited by the increased confinement of the particles, which are forced to contact, and the minimum shifts to lower frequencies. Hence, in the range of experimental frequencies, the profile of G′′ flattens in the low-frequency region of the range (as G′′ approaches the minimum) and the region dominated by the viscous dissipation caused by the externally-applied deformations extends. This marks the onset of the jamming transition, which, from the data depicted in Fig. 2c, appears to happen between Carbopol mass fractions of 1 and 2 wt% for all solutions. At 2 wt%, the plateau of G′ extends to higher frequencies, whilst G′′ tends to a shallow minimum at low frequencies (the first derivative of G′′ is reported in S3.1, ESI†). Moving away from the minimum as the frequency is increased, G′′ rises monotonically following a power law with a slope of 0.5. This trend, typical of randomly packed emulsions48 and observed also for microgels close to the jamming transition,10,49,50 is associated with the presence of regions where slip happens between loosely packed particles, which increases the viscous dissipation in the solvent at higher frequencies. This slip also implies the presence of a distribution of relaxation times, which, for randomly distributed dispersions,48 yields a power law dependence of the loss modulus of ω1/2. A clear distinction between the glass transition and the jamming transition is not observed from the trends of G′ and G′′ versus frequency in the range of concentrations investigated. This is likely to occur, because a clear distinction between the two phenomena can be attained only if the characteristic time of the test (which for SAOS experiments corresponds to the reciprocal of the frequency of oscillation, i.e. 1/ω) is longer than the characteristic time of Brownian motion,51 which can be evaluated as:
 | (1) |
Moving towards more concentrated samples, for all solvents the viscoelastic properties show the typical features of a densely packed system of soft particles. The storage modulus is nearly constant over the range of frequencies sampled, with a mild increase at high frequencies, and the gap between the P and G/PG solutions gradually decreases, their respective curves almost overlapping at the highest concentration considered (i.e. 8 wt%; Fig. 2f). This behaviour reflects the ability of these microgel particles to deform when highly compressed. As the particle density increases, the space occupied by the solvent is gradually filled with polymer. In these conditions, the elastic response is controlled by the particle elastic modulus Gp, which primarily depends on the chemistry of the crosslinked system,52 thus yielding (in a log scale plot) close values of G′ for the three solutions. As the interstitial spaces between particles decrease, G′ and G′′ increase, the ratio G′/G′′ increases, and the power law dependence of G′′ at higher frequencies reduces to ω1/3. The decrease of the power law exponent agrees with studies on microgels systems above the jamming transition10,50,53 and could reflect the ability of soft polymer particles to deform and partially interpenetrate when compressed, a behaviour that promotes frictional effects between sliding particles.50,53 Although direct observations of the compressed state of the system are unavailable, for all solutions a non-monotonic variation of the loss tangent is observed with an increase of Carbopol concentration at a fixed frequency, a finding that agrees with what is reported in the work of Conley et al.50(see S4, ESI†): the loss tangent motonotically decreases with an increase of microgel concentration until reaching a minimum at the onset of the compressed state, after which it increases moderately approaching a plateau. The authors observed that the anomalous large losses scaled with the degree of interpenetration of the microgels, thus possibly associating the altered scaling behaviour of G′′ with the presence of frictional forces between the compressed dangling ends of the microgels.
Based on the results discussed so far, the use of PEG400, in contrast to the other two solvents, clearly induces a shift of the characteristic polymer mass fraction at which the liquid-to-solid transition occurs (close to 2 wt% for the P solutions and between 1% and 2% for the G and PG solutions), albeit no significant differences in the viscoelastic properties are observed once the dispersions become densely packed. This suggests that the solvent might influence mainly the final dimension of the swollen Carbopol particles.
A figure summarising the evolution of G′ and G′′ with Carbopol concentration can be found in the ESI† (S3.2).
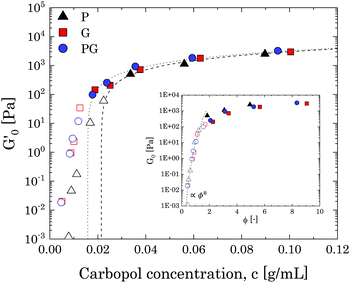
To obtain a clearer picture of the liquid-to-solid transition and how it is influenced by solvent type, we considered the values of G′ at a fixed frequency of 1 rad s−1 (G0′) and plotted them against the mass concentration of Carbopol per volume of suspension. The results are reported in Fig. 3, starting from Carbopol concentrations equivalent to a mass fraction of 0.4 wt% for G/PG and 0.7 wt% for P solutions (at 0.4 wt% the signal of G′ for P solutions is significantly scattered at a frequency of 1 rad s−1); at these low mass fractions, the values of G0′ are very low, in line with the viscous behaviour observed in Fig. 2. At intermediate concentrations (from 0.7 wt% to 1.5 wt% for G and PG solutions and 1 wt% to 2 wt% for P solutions), G0′ increases steeply for all solutions (hollow symbols in Fig. 3). Interestingly, values for PG and G solutions clearly overlap in the entire window, while the values for P solutions are shifted to higher Carbopol concentrations.
The rapid increase of the storage modulus is reported for a variety of colloidal and soft systems, from colloidal suspensions of hard spheres12,54,55 and packed emulsions56 to microgel systems,4,8,10,12,50,57–59 and is typically associated with the presence of a soft interaction potential between neighbouring particles, which appears to control the elastic behaviour of the system as this increasingly concentrates. Scheffold and co-workers57 showed that soft microgels can be modelled considering the microgel particles as dense cores decorated with polymer brushlike coronas. Following this picture, the origin of the soft interactions can be attributed to brushlike interactions between close microgels, which strongly depend on the ratio between the particle diameter and the extension of the thickness of the coronas. This approach yields a distinct scaling behaviour for a specific microgel system, which can be approximated to a power law in a limited range of volume fractions. Although in this specific case a quantitative assessment is not feasible given the limited number of points in the range of interest, we notice that the data points in this intermediate regime can be collapsed for all solutions by simply using the apparent volume fraction evaluated from the confocal images. The results can be observed in the inset of Fig. 3 and show a common scaling which approximates a power law of 8, thus suggesting that the delay observed in the P solutions is ascribable to the smaller swollen dimension of the particles.
As the solutions concentrate further (from 1.5 wt% for G and PG solutions and from 2 wt% for P solutions), a smooth transition of G0′ is observed from the steep power law trend to an asymptotic linear increase with polymer concentration. This is commonly observed for microgel systems above the jamming transition and its physical interpretation from dynamic data is not unique.60 The most common scenario considers the ability of soft particles to deform and adapt their shape as they are forced by the steric constraint of the other particles. In these conditions, particles form a dense, packed system, where the elastic behaviour is controlled by the physical properties of the microgel core.4,10,50 In this regime, the plateau of the storage modulus is predicted to increase linearly with the particle volume fraction,61G0′ = Gp(ϕ − ϕc), Gp being the particle elastic modulus, ϕ the particle volume fraction and ϕc the characteristic volume fraction corresponding to close packing. Assuming as a rough approximation a linear relation between the particle volume fraction ϕ and the mass concentration c (i.e. ϕ ≈ kMc, where kM is a proportionality constant) the equation above translates into G0′ = Kp(c − cc), where cc is the close packing concentration, which marks the onset of a densely packed regime (i.e. regime in which particle deformations start to become significant and the onset of the linear behaviour is observed50) and Kp is a proportionality constant, independent of the solvent considered, related to the particle elastic modulus Gp by the relation Kp = kMGp. The estimated values of Kp and cc can be obtained by linear regression of the data at the highest concentrations (closed symbols in Fig. 3), yielding a value of 38 m2 s−2 for Kp and values of the characteristic concentration cc of 0.0158 g mL−1 for G and PG solutions and of 0.0214 g mL−1 for P solutions, corresponding to Carbopol mass fractions of 1.25%, 1.3% and 1.9% for G, PG and P solutions, respectively, in line with what is shown in Fig. 2. Thus, the use of different solvents does not alter the interparticle interactions in the limit of small deformations, but it clearly influences the swelling behaviour of the Carbopol molecules, an outcome reflected in a shift in the P solutions to a higher cc.
Note that the critical concentration cc does not indicate the typical onset of the jamming transition, which by definition is the point at which a suspension of particles reaches the random packing volume fraction ϕJ, but indicates the point at which significant particle deformation and contacts occur. The corresponding mass fraction at which the jamming transition happens cannot be clearly defined from linear viscoelasticity for a system of soft particles, where the actual volume fraction is not precisely defined. From the data obtained and based on the apparent volume fractions reported in the ESI† (S2.2), we can simply say that we expect the jamming transition to occur at mass concentrations between 1 wt% and cc. We also point out that, based on the data obtained so far and on the rough estimates of the apparent volume fractions, the transition to a solid arrested state seems to be mainly “cage” driven for all solutions.
3.2 Rheological response to non-linear deformations – LAOS
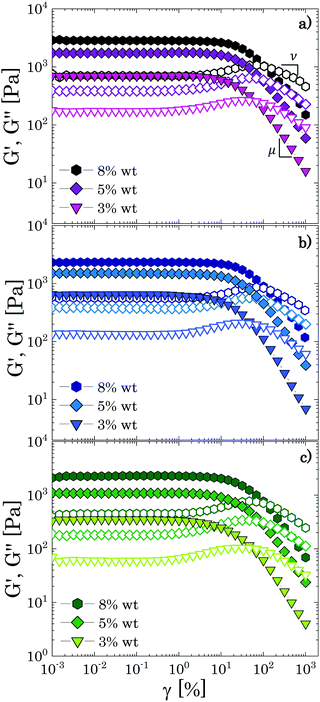
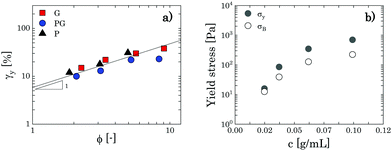
To further examine the influence of solvent quality on the soft interactions between Carbopol particles and on the nature of the transition observed in the linear viscoelastic regime, we tested the response to non-linear deformations of different samples through large amplitude oscillatory sweeps (LAOS) and steady shear rheology. The yielding response of microgel systems strongly depends on the nature of the interparticle interactions and on the particle volume fraction; thus, the results obtained from both tests for samples that are significantly beyond the densely packed regime (i.e. all concentrations clearly belonging to the linear region in Fig. 3, c ≥ 3 wt%) and below this threshold, will be discussed together to highlight possible differences induced in the particle–particle interactions by the solvents used.All samples exhibit the main features described above, independently of the solvent used, thus confirming the results obtained in the linear regime. Specifically, we found a mean value of the ratio/equal to 2.3 ± 0.2, a result that agrees with the value expected for soft glassy materials.4,37,41 The values of the characteristic yield strain amplitude γy can be found from the analysis of stress (amplitude) vs. strain (amplitude) curves as the values at which the stress deviates from the linear elastic regime (σ = Gγ) to a sublinear regime of the type σ ∼ γm with 0 < m < 1 (see S5 ESI†). The data obtained for all samples are collected in Table 2 together with the estimated values of the yield stress σy = G0′γy, and the characteristic power law exponents μ,ν and m.
| w c (%) | γ y (%) | σ y (Pa) | m (−) | μ (−) | ν (−) | G 0′ (Pa) | σ B (Pa) | k n (Pa snB) | n B (−) | |
|---|---|---|---|---|---|---|---|---|---|---|
| 8 | G | 38 | 903 | 0.48 | 1.16 | 0.44 | 2834 | 259 | 1102 | 0.46 |
| PG | 23 | 699 | 0.42 | 0.93 | 0.46 | 2332 | 223 | 916 | 0.54 | |
| P | 31 | 624 | 0.42 | 1.08 | 0.55 | 2279 | 197 | 671 | 0.44 | |
| 5 | G | 30 | 527 | 0.46 | 1.13 | 0.47 | 1732 | 131 | 544 | 0.47 |
| PG | 22 | 346 | 0.42 | 1.04 | 0.49 | 1503 | 127 | 496 | 0.44 | |
| P | 18 | 202 | 0.43 | 1.13 | 0.51 | 1087 | 87 | 158 | 0.51 | |
| 3 | G | 22 | 155 | 0.45 | 1.25 | 0.53 | 696 | 55 | 166 | 0.51 |
| PG | 13 | 85 | 0.46 | 1.15 | 0.49 | 648 | 39 | 163 | 0.48 | |
| P | 12 | 44 | 0.46 | 1.22 | 0.52 | 351 | 29 | 61 | 0.51 | |
The values of yield strain and consequently of yield stress obtained from the LAOS tests should not be considered as absolute thresholds between flow and no-flow conditions. As highlighted in the literature,29,63,64 the yielding process of soft materials is not discontinuous, but a smooth transition from a completely structured to a completely unstructured state. As a consequence, various ways have been proposed to calculate the yield point from LAOS (at least five29,63), which give yield stress values that can differ significantly, thus highlighting the challenge of defining unambiguously the yield point from these tests.
As expected for a jammed glass, the exponent m remains constant with an average value of 0.45 ± 0.02 and the yield strain increases mildly with the polymer concentration, maintaining values between 10–30%, which is in the range found for various soft jammed systems in the densely packed regime.38,41,60 Note that the high values observed at the highest mass fractions (5 wt% and 8 wt%) might highlight that the yielding behaviour in this regime is dominated by the elastic forces exerted at the particle facets, rather than by the elasticity of the particle cages.38 By plotting the values found for γy as a function of the apparent volume fraction (Fig. 5a), we can also observe qualitatively a unique trend for all solutions where γy increases almost linearly with the volume fraction, an outcome consistent with the predictions for jammed Hertzian elastic particles.65
The typical yielding behaviour of jammed glasses is also recovered through steady shear measurements, as can be observed from Fig. 6, where stress vs. shear rate curves are presented for the same samples discussed above. All flow curves can be modelled with the Herschel–Bulkley (HB) constitutive equation:
σ = σB + kn![[small gamma, Greek, dot above]](https://www.rsc.org/images/entities/i_char_e0a2.gif) nB nB | (2) |
Hence, from all the results above, it can be concluded that the use of different solvents does not influence the qualitative behaviour of the flow properties of the suspensions when these are densely packed, thus confirming that, in this regime, particle interactions are mainly elastic and flow results from an interplay between the elastic interaction between particles in direct contact and structural rearrangements. In these conditions, any mild attractive force induced by a specific solvent is overwhelmed by the elastic interaction. Therefore, it is necessary to analyse the nonlinear response of less concentrated samples before drawing conclusions on the effect of the different solvents on the liquid-to-solid transition of Carbopol dispersions.
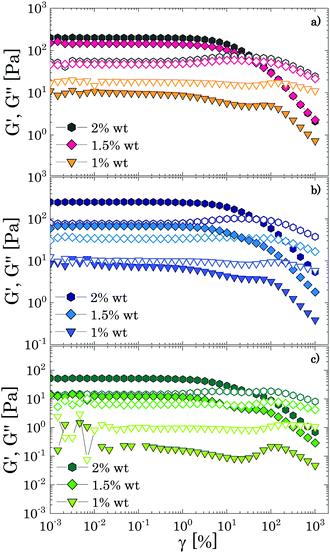
We replotted the data in Fig. 7 by normalizing G′ and G′′ with their corresponding plateau values at γ → 0 to better reveal the presence of the peaks; the results are shown in Fig. 8. For all different solvents, the same qualitative behaviour is observed. As the mass fraction of Carbopol decreases to the limit of the critical concentration cc, i.e. 2 wt% for P solutions and 1.5 wt% for G and PG solutions, the normalized storage modulus maintains the same shape and monotonically decreases following a smooth sigmoidal trend, whilst the magnitude of the peaks of G′′ decreases, and the initial peak observed for densely packed regimes is replaced by a first peak occurring at γ = γc1 ≈ 10% and by a second peak at γ = γc2 ≈ 100%, which appears more or less pronounced in the three different solvents.
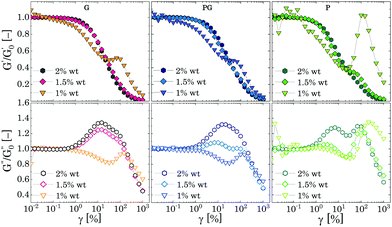 | ||
| Fig. 8 Normalised G′ (upper row graphs) and G′′ (lower row graphs) as function of the strain amplitude for the three different solvents. | ||
Nonetheless, as the Carbopol concentration is reduced to 1 wt%, at the frequency tested the elastic contribution becomes lower than the viscous one in the entire range of strains. For G and PG solutions, G′′ shows a local depression just after γ ≈ γc1 followed by a temporary recovery at γ ≈ γc2, readily followed by a mild shear thinning decrease. On the other hand, G′ decreases almost linearly up to a characteristic strain, slightly lower than γc2, at which a peak shows, before reaching the viscous terminal behaviour. A similar behaviour is observed for P solutions, although the gap between the magnitude of G′′ and G′ is more significant and the normalised peaks are more pronounced, as can be observed from Fig. 8.
Steady shear tests applied to the same sample concentrations reveal the presence of a yield stress for all G and PG solutions with Carbopol concentration equal or above 1 wt%, whilst for P solutions the stress plateau has already disappeared for solutions at 1 wt% (Fig. 9). Just above the critical concentration cc (i.e. G and PG solutions at 2 wt%), all samples present a yield stress and the shear stress can be fitted with the HB model, giving a shear-thinning index nB still close to 0.5. As the samples move away from a densely packed condition, nB further increases and the flow curves are better fitted with a modified version of the HB model,4,71 which includes a second power law regime at lower shear rates:
σ = σB + kn![[small gamma, Greek, dot above]](https://www.rsc.org/images/entities/i_char_e0a2.gif) nB + kp nB + kp![[small gamma, Greek, dot above]](https://www.rsc.org/images/entities/i_char_e0a2.gif) np np | (3) |
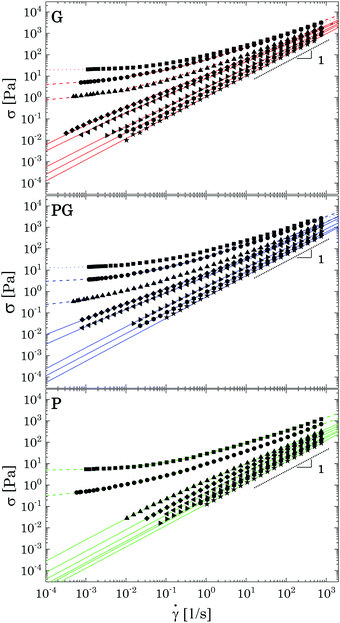 | ||
| Fig. 9 Flow curves of the samples for decreasing Carbopol mass fraction in three different solvents. For each plot from top to bottom: (2 wt%, 1.5 wt%, 1 wt%, 0.8 wt%, 0.7 wt%, 0.5 wt%, 0.4 wt% and 0.2 wt%). Coloured dotted lines represent fitting of the experimental data with the Herschel–Bulkley model (eqn (2)); dashed lines fitting with the modified HB model (eqn (3)), continuous lines fitting with the Carreau-Yasuda model. | ||
| w c (%) | σ B (Pa) | k n (Pa snB) | n B (−) | k p (Pa snp) | n p (−) | |
|---|---|---|---|---|---|---|
| 2 | G | 19.3 | 70 | 0.57 | — | — |
| PG | 12.5 | 66 | 0.54 | — | — | |
| P | 4.9 | 3.7 | 0.76 | 20 | 0.52 | |
| 1.5 | G | 2.4 | 37.3 | 0.68 | 16.7 | 0.25 |
| PG | 2.3 | 29.8 | 0.67 | 8.4 | 0.28 | |
| P | 0.19 | 5.7 | 0.71 | 3.5 | 0.37 | |
| 1 | G | 0.43 | 19.7 | 0.68 | 5 | 0.3 |
| PG | 0.16 | 5.7 | 0.81 | 7.9 | 0.49 | |
| P | — | — | — | — | — | |
As the Carbopol concentration is further decreased, the yield stress disappears and a Newtonian behaviour is observed for ![[small gamma, Greek, dot above]](https://www.rsc.org/images/entities/i_char_e0a2.gif) → 0, i.e., the stress curves reach an asymptotic slope equal to 1 (Fig. 9), marking the transition from a glassy arrested state to a viscous solution. The transition happens in the range of Carbopol concentrations 1–0.8 wt% for G and PG solutions and 1.5–1 wt% for P solutions, which is consistent with the linear viscoelastic behaviour described in Section 3.1. Note that these ranges of concentrations correspond to apparent volume fractions not lower than 0.62 (which is the value for P solutions at 1 wt%, see Table S2.2 in the ESI†). The flow curves in this regime can be fitted with the Carreau-Yasuda model (see S7 ESI† for fitting parameters). All solutions behave as shear-thinning fluids, with shear-thinning indexes that increase with decreasing Carbopol concentration until the Newtonian behaviour is reached in the complete range of shear rates tested.
→ 0, i.e., the stress curves reach an asymptotic slope equal to 1 (Fig. 9), marking the transition from a glassy arrested state to a viscous solution. The transition happens in the range of Carbopol concentrations 1–0.8 wt% for G and PG solutions and 1.5–1 wt% for P solutions, which is consistent with the linear viscoelastic behaviour described in Section 3.1. Note that these ranges of concentrations correspond to apparent volume fractions not lower than 0.62 (which is the value for P solutions at 1 wt%, see Table S2.2 in the ESI†). The flow curves in this regime can be fitted with the Carreau-Yasuda model (see S7 ESI† for fitting parameters). All solutions behave as shear-thinning fluids, with shear-thinning indexes that increase with decreasing Carbopol concentration until the Newtonian behaviour is reached in the complete range of shear rates tested.
Overall, the results obtained from LAOS and steady shear measurements indicate that for all solutions a loss of solid-like behaviour is observed as soon as the particle confinement is lost, which is typically observed in soft repulsive systems undergoing a glass transition.4,51 However, close to the jamming transition, the yielding behaviour is not characterised by a single peak but instead the loss modulus shows two peaks, indicating a more complex particle escaping mechanism. This behaviour suggests the presence of short-range interparticle attractions (e.g. van der Waals interactions), which can form disordered particle clusters only when particles are in close contact. At higher particle concentrations, these contacts can extend between clusters, forming larger aggregates that are usually sensitive to the specific shear protocol applied.
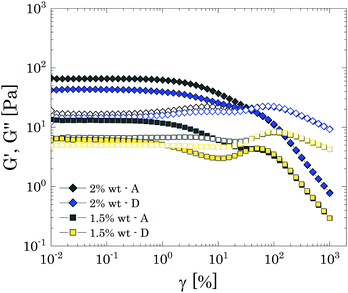
To verify this picture, we further investigated the reversibility of the yielding behaviour of samples close to and just below cc by performing consecutive ascending and descending amplitude sweeps at a fixed frequency of 1 rad s−1. Before each ramp, samples were conditioned by applying a pre-shear at 100 s−1 for 60 s, followed by a rest period of 900 s.
In the presence of repulsive particle interactions, the response to nonlinear deformations is expected to be perfectly reversible because there is no significant interconnection between particles and the suspension yields simply by a 'cage' escape mechanism, meaning that, as the deformation is reduced, the initial microstructure is recovered as particles are confined again in the cages, thus showing the same plateau values of G′ and G′′. By contrast, for attractive particle interactions, the yielding behaviour is extremely sensitive to the shear history that the sample has experienced because of the significant de-structuring that the initial microstructure, characterized by connectivity between single particles, undergoes under flow.31 In fact, in an ascending amplitude sweep the initial particle network will be progressively broken into smaller clusters until ideally reaching a dispersion of single particles, whilst in a descending ramp, the original strongly interconnected structure will be unable to reform in the time of the experimental ramp, thus causing a reduction of the linear elastic plateau, which can be of one or more orders of magnitude.
For brevity, we report only the results obtained for P solutions at 2 wt% (i.e., close to cc) and 1.5 wt% (i.e., just below cc) of Carbopol in Fig. 10, which better highlight the effect of mild particle–particle attractions on the reversibility of the yielding behaviour at the tested frequency. The response to nonlinear deformations is perfectly reversible for both samples only for high strain amplitudes (i.e., γ > γc2), where the sample is completely yielded and the initial structure has been broken. At lower strains, the linear plateaus of G′′ and G′ obtained with the descending sweeps for the sample close to the jamming transition (i.e., 2 wt% in Fig. 10) remain in the same order of magnitude, reducing only by a factor of 1.1 and 1.5, respectively. The same results were found for all samples close to the jamming transition, independently of the solvent used (see S8 ESI†).
This modest decrease reveals that, although the initial microstructure is mainly maintained by the topological confinement of the particles, as happens for repulsive systems, there is a small component related to particle–particle interactions, which alters the structure reorganisation in the descending ramp. This is better highlighted at lower particles concentrations, just below the jamming transition (i.e. 1.5 wt% in Fig. 10), for which the descending sweep displays a clear loss of the original structure, which is partially recovered at lower strains. These observations resemble what has been already reported by other authors for similar systems.31 In this previous study, the loss of reversibility was attributed to an increase of the characteristic size of the smallest clusters achievable, which entailed a reduction of the cluster-cluster contacts and therefore of the network strength, resulting in a drop of the elastic plateau of one order of magnitude. In the present case, the results obtained from LAOS experiments indicate a similar mechanism, showing that once the sample has been destructed, it cannot fully recover its initial configuration within the experimental time.
As particle concentration reduces just below the jamming threshold, particle caging begins to fade until solutions no longer present a stress plateau. Nonetheless, since particle concentration is still significant, random clusters can still form in the bulk of the solution between particles that are at close distance, thus explaining the behaviour observed with the LAOS tests for P solutions at 1 wt%, which do not show a yield stress in steady shear tests: as a shear deformation is applied, particle clusters can interact with each other forming bigger aggregates and deform under shear more freely without breaking up. At smaller amplitude strains, the movement of these aggregates will create local pockets of solvent, which cause the local decrease observed in the loss modulus. As the amplitude of the strain applied increases, the aggregates deform up to a certain point at which eventually they break again into smaller clusters.
Just before the breaking point, the aggregates have reached the maximum deformed configuration; in this condition the system is able to accumulate the stress applied as elastic energy, hence showing a peak in the storage modulus, which is then abruptly dissipated after rupture. The interactions between clusters in this regime happen randomly when particles are forced to contact under flow and the absence of a solid-like behaviour at low strains (i.e. absence of a yield stress) suggests the lack of a strong interconnected structure spanning the whole bulk of the suspensions.
We conclude that, although the results obtained from LAOS experiments indicate the presence of some interparticle attractions, which influences the yielding mechanism near random packing concentrations, all suspensions undergo a transition from a viscous solution to a glassy state induced by a “cage effect”, independently of the solvent used. This confirms that the use of different solvents mainly influences the final swollen state of Carbopol particles and therefore the rheological behaviour of all solutions should be scalable with the particle volume fraction. We point out that, in the range of shear rates investigated, we cannot distinguish clearly a glass transition from the flow curves for the solutions studied; this is likely because, given the limit in the range of shear rates, the flow behaviour of the solutions is sampled in the athermal regime51(τT > 1/![[small gamma, Greek, dot above]](https://www.rsc.org/images/entities/i_char_e0a2.gif) min, for all solutions), where any effect related to the thermal energy of the particles is suppressed.
min, for all solutions), where any effect related to the thermal energy of the particles is suppressed.
The nature of the interparticle attractions responsible for the rheological behaviour observed is unclear and difficult to predict. Considering their efficacy only at concentrated regimes, they are probably related to van der Waals potentials between swollen particles, which dominate over the repulsive electrostatic and steric interactions only at close particle contact. The qualitative effect on the bulk rheological properties appears to be independent of the solvent, although P solutions show a more noticeable difference in the magnitude of the peaks compared to the other two solvents, as shown in Fig. 8. This could indicate stronger attractive forces in the sole presence of PEG400 molecules, which are, however, difficult to explain at this stage. The difference could be related to various aspects, from a worse degree of solvation of the external polymer chains, which would reduce the steric repulsion between particles, to a decrease of the electric double layer due to the worse dielectric properties of PEG400 compared to glycerol, which would in turn also partially affect the van der Waals interactions through the Hamaker constant.42 Further investigations, which are beyond the scope of this work, would be of great interest to understand more deeply the specific interactions responsible for the rheological observations.
| ζ = kMc | (4) |
 | (5) |
| RSW = RIN(ρpkM)1/3 | (6) |
 | (7) |
 | (8) |
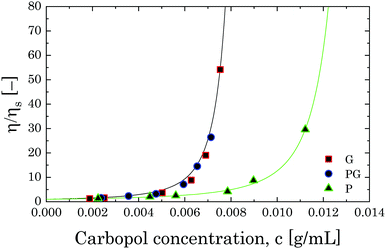 | ||
| Fig. 11 Relative viscosity as a function of Carbopol concentration for G, PG and P solutions in the semi-dilute regime. The solid lines represent the fitting with eqn (8). | ||
If we assume that the final value of λ depends only on the polydispersity of the Carbopol particles in the dry state, the same value should be assumed for all solutions and data can be fitted together to obtain the optimal values of λ, k(G/PG)M and kPM (for details about the fitting procedure see S9, ESI†). The data in Fig. 11 can be replotted as a function of the apparent volume fraction ζ (following eqn (4)). The outcome is displayed in Fig. 12, which shows an efficient rescaling of the zero-shear viscosity up to ζ ∼ 0.5. Note that the majority of the data are at intermediate volume fractions, where other relations commonly used for dilute dispersions do not apply. For reference, the Batchelor equation73 (i.e. ηr = 1 + 2.5ζ + 6.2ζ2) is also reported in Fig. 12, clearly showing a significant deviation from Mooney's prediction beyond its limit of validity (i.e. around ζ ∼ 0.2) (inset in Fig. 12). The final values of the fitting parameters are reported in Table 4, with the corresponding final radii obtained from eqn (6) and the values of the swelling ratio QS defined as:
 | (9) |
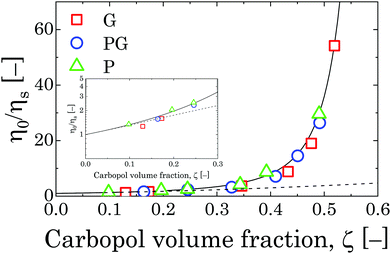 | ||
| Fig. 12 Relative viscosity rescaled with Carbopol volume fraction ζ for G, PG and P solutions in the semi-dilute regime. The solid line represents the fitting with Mooney's equation,72 whilst the dashed line is the Batchelor equation.73 The inset shows the point at which the Batchelor equation starts to deviate from Mooney's. | ||
| λ (−) | k M (mL g−1) | R SW (nm) | Q S (−) | G p (Pa) | τ T (s) | c J (g mL−1) | w J (%) | |
|---|---|---|---|---|---|---|---|---|
| G | 68.9 | 603 | 8.4 | 554 | 3.3 × 10+3 | 0.011 | 0.89 | |
| PG | 1.3 | 1.4 × 10+3 | 0.94 | |||||
| P | 43.7 | 518 | 5.3 | 873 | 2.4 × 10+2 | 0.0176 | 1.57 |
The values of RSW agree with those found from confocal microscopy (reported previously in Section 2.3). In pure glycerol, Carbopol 974NF can swell up to more than 8 times from its initial size, whilst in PEG the swelling is reduced to 5 times. This difference can be attributed to the different degree of ionization that the two solvents induce on Carbopol molecules. For linear chains of uncrosslinked polyacrylic acid, the final conformation of the molecules in a solvent is reported to strongly depend on the density of the dissociated carboxyl groups distributed along the backbone of the molecule, which alter the conformation due to electrostatic repulsions.43 In a crosslinked structure, such as that of Carbopol molecules, although the presence of electrostatic repulsions might play a role in inducing an initial unravelling of the collapsed structure, the final swelling degree is controlled by the osmotic pressure between the internal charged environment and the external solvent. In the absence of any neutralizing agent, the effect of each pure solvent is mild but still quite distinguishable, as highlighted by the rheological measurements. Thanks to the higher density in OH groups, glycerol molecules can induce a higher degree of ionization compared to polyethylene glycol thus promoting a more pronounced swelling. Interestingly, when the two solvents are combined, the outcome is equal to what is observed in the sole presence of glycerol.
These findings highlight that the kinetic aspect of the swelling process is critical to the final swollen state achieved. As reported in a previous work,35 the swelling kinetics of these systems is diffusion-controlled, meaning that smaller molecules with a better affinity with the polymer and a higher capability of transporting charges will preferentially move inside the crosslinked structure of Carbopol. Hence, if the amount of glycerol in solution is enough to swell the majority of the particles, the final swollen average dimension will be equal to that obtained in the pure solvent.
The values found through the rheological measurements are estimated on the assumption that eqn (4) is still valid in the semi-dilute regime (for 0.25 < ζ < 0.5) and particles can fully swell to their final equilibrium dimension. Although a reduction of the final particle dimensions surely happens for samples above the jamming transition for steric effects, the predictions of the critical mass fraction wJ at which the jamming transition happens for all solvents (obtained from the volume fraction ζJ at which the relative zero-shear viscosity diverges, i.e. ζJ ≈ 1/λ = 0.769) are within the ranges expected from the analysis of the flow curves at higher concentrations, as previously reported in Section 3.2.2. This suggests that our assumption is acceptable in the range of concentration used to fit the Mooney equation. The values of wJ are reported in Table 4 for all solutions.
Determining precisely the particle radius in microgel systems such as Carbopol above the semi-dilute regime can be quite challenging because of their ability to de-swell and deform to accommodate a higher number of particles, thus altering their original dimension and the actual particle volume fraction, which should be used to scale all the rheological properties.
Despite the lack of accuracy of eqn (4) above the semi-dilute regime, it is possible to use the fitting parameter kM to estimate the particle elastic modulus Gp (which can be calculated from the parameter Kp found in Section 3.1, i.e. Gp = Kp/kM) and the apparent volume fraction ζ (i.e., ζ = kMc) and verify that the flow behaviour for all solutions follows the same scaling laws predicted for athermal suspensions of soft elastic particles with no significant attractive forces in all the regimes investigated.
Close to the jamming point, all flow curves can be collapsed on two separate branches, one above and the other below the jamming transition, by scaling the shear stress σ and the shear rate ![[small gamma, Greek, dot above]](https://www.rsc.org/images/entities/i_char_e0a2.gif) as σ/(E|ζ − ζJ|Δ) and ηs
as σ/(E|ζ − ζJ|Δ) and ηs![[small gamma, Greek, dot above]](https://www.rsc.org/images/entities/i_char_e0a2.gif) /(E|ζ − ζJ|Γ), respectively.2,51,65,74 In the scaling relations, E represents the elasticity of the particulate material (i.e., Gp) and Δ and Γ are power law parameters that for Hertzian particles theoretically have the values of 2 and 4,65 respectively.
/(E|ζ − ζJ|Γ), respectively.2,51,65,74 In the scaling relations, E represents the elasticity of the particulate material (i.e., Gp) and Δ and Γ are power law parameters that for Hertzian particles theoretically have the values of 2 and 4,65 respectively.
Hence, all data presented in Fig. 9 with concentrations close to the jamming transitions (i.e. for % mass fractions 0.7% < w < 2 wt% for G and PG solutions and 1 wt% < w < 2 wt%) can be replotted by applying the scaling laws above (see Table 4 for a summary of the parameters used for scaling). The outcome is shown in Fig. 13. Independently of the solvent used, it is possible to collapse all flow curves close to the jamming point in two separate branches, one above and the other below jamming, thus confirming that the nature of the liquid-to-solid transition is mainly dominated by a jamming dynamics and that different solvents mainly influence the final swollen dimensions of the polymer particles.
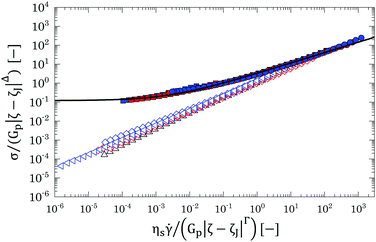 | ||
| Fig. 13 Scaled version of Fig. 9 for G (red), PG (blue) and P (black) solutions, down to concentrations of 0.7 wt% for G and PG solutions and of 1 wt% for P solutions. All concentrations above the jamming transition (i.e. with % mass fractions w > wJ) are reported in closed symbols, whilst below the jamming point are reported in hollow symbols. The dashed line is the theoretical HB fitting with power law exponent equal to 0.53. | ||
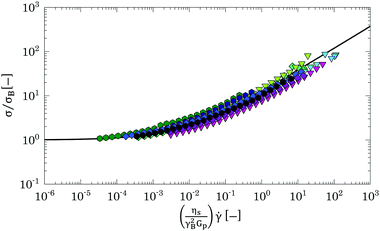
The scaling above derives from the specific nature of the jamming transition and does not hold far above or below the jamming point. Hence the flow curves obtained in a densely packed regime, which are far above this point, should be collapsed considering a different scaling. At these high volume fractions, the flow behaviour is controlled by the competition between the elastic restoring force and the viscous forces between particle facets.67,75 This physical picture is well captured by a micromechanical model developed by Seth and co-workers,67 for athermal suspensions of soft elastic particles, which incorporates the effects of elastic interactions with the hydrodynamic contributions resulting from particles sliding. The model predicts a constitutive equation for the flow curve of a packed dispersion of elastic particles, with particle contact modulus E*, dispersed in a solvent of viscosity ηs, of the HB type:
 | (10) |
![[small gamma, Greek, dot above]](https://www.rsc.org/images/entities/i_char_e0a2.gif) ηs/E*γB2, where γB is calculated from the HB yield stress (i.e. γB = σB/G0′) and E* = Gp. The result of the scaling is shown in Fig. 14. The curves overlap independently of the solvent used and collapse (within an error <20%) on the theoretical prediction (black line), thus showing that all samples behave as suspensions of jammed soft spherical particles and, independently of the real dimension and degree of deformation of the Carbopol particles, their flow behaviour can be scaled with the particle elastic modulus Gp obtained from the estimated parameter kM.
ηs/E*γB2, where γB is calculated from the HB yield stress (i.e. γB = σB/G0′) and E* = Gp. The result of the scaling is shown in Fig. 14. The curves overlap independently of the solvent used and collapse (within an error <20%) on the theoretical prediction (black line), thus showing that all samples behave as suspensions of jammed soft spherical particles and, independently of the real dimension and degree of deformation of the Carbopol particles, their flow behaviour can be scaled with the particle elastic modulus Gp obtained from the estimated parameter kM.
4 Conclusions
The effect of non-aqueous solvents on the swelling behaviour and mutual interactions of Carbopol particles has been investigated to understand better how these phenomena impact the rheological design of non-aqueous formulations.The rheological properties of dispersions of a highly crosslinked Carbopol polymer (Carbopol 974P NF) in glycerol (G), PEG400 (P) and a mixture of the two (PG) are mapped from the dilute to the densely packed regime. At increasing Carbopol concentration, all solutions display the typical viscoelastic properties of mildly attractive soft particle suspensions. A clear shift in the onset of the jamming transition occurs when pure PEG400 is used as solvent, whilst the liquid-to-solid transition is the same for G and PG dispersions. Nevertheless, once the jammed state is reached, the elastic modulus is simply scalable with the polymer mass fraction, regardless of the solvent used. These results suggest that the use of different solvents clearly influences the swelling behaviour of Carbopol molecules, which is reflected in a higher characteristic jamming concentration for P solutions, yet without altering the interparticle interactions in the limit of small deformations.
The typical behaviour of a fully packed suspension of soft particles is also confirmed by the response to non-linear deformations from both LAOS and steady shear experiments. Above the close packing regime, when particles are significantly deformed against their neighbours, all dispersions behave as a packed dispersion of elastic deformable particles and the flow behaviour is mainly regulated by the interplay between the elastic interaction between particles in direct contact and hydrodynamic interactions originating from particles sliding. Below the close packing concentration, LAOS experiments reveal the presence of short-range attractive forces between Carbopol particles, which are highlighted by the two-step yielding mechanism of the loss modulus at increasing shear deformations. Nonetheless, the loss of a yield stress just below the jamming transition suggests that the attractions are only significant when particles are in close contact and the liquid-to-solid transition for all solvents considered is mainly “cage” driven. Carbopol particles swell up to more than 8 times their initial size in G and PG dispersions, whilst in PEG the swelling is reduced to 5 times. These findings, confirmed also by confocal microscopy, highlight that, even in the absence of water, the main driving mechanism that controls the final swollen conformation is the degree of ionization induced by the solvent on Carbopol molecules. Furthermore, in the presence of co-solvents the kinetic aspect of the swelling process is critical to the final swollen state achieved, as highlighted by the equal swelling degree obtained for G and PG dispersions. The swelling kinetics of these systems are diffusion-controlled, thus if one of the solvents presents better permeability in the carbomer network and is present in amount sufficient to swell the majority of the particles, the final swollen average dimension of the particle is equal to what is obtained in the presence of that solvent alone.
Once the average particle dimension is known, the flow properties above and below jamming can be scaled for all solvents simply with an apparent particle volume fraction, showing a flow behaviour consistent with soft particle systems in the athermal regime, with some anomalies observed at significantly high particle concentrations. These results highlight that, even if typically the morphology of Carbopol molecules is described as quite irregular, thanks to its high crosslinking degree, Carbopol 974P NF, as opposed to other types with a lower crosslinking degree, can be well approximated to a soft spherical particle until densely packed regimes are reached. In these regimes, the rheological behaviour becomes more sensitive to particles irregularities (e.g. presence of dangling ends, possible uneven distribution of the crosslinking density or of functional groups), which influences the interactions between the particles when they are forced to close contact. These effects are complex to clearly address, given the commercial nature of the material, and further investigations would be of great interest to elucidate the anomalies observed at high particle concentrations.
Conflicts of interest
There are no conflicts to declare.Acknowledgements
The authors would like to acknowledge Ollie Hughes and Prof. Paul Bartlett from the School of Chemistry of the University of Bristol (UK) for providing the labelled Carbopol for the confocal imaging and GlaxoSmithKline Consumer Healthcare and the EPSRC Future formulations grant CORAL (EP/N024915/1) for the financial support given to this project.References
- D. Vlassopoulos and M. Cloitre, Curr. Opin. Colloid Interface Sci., 2014, 19, 561–574 CrossRef CAS.
- D. Bonn, M. M. Denn, L. Berthier, T. Divoux and S. Manneville, Rev. Mod. Phys., 2017, 89, 1–40 CrossRef.
- L. A. Lyon and A. Fernandez-Nieves, Annu. Rev. Phys. Chem., 2012, 63, 25–43 CrossRef CAS.
- C. Pellet and M. Cloitre, Soft Matter, 2016, 12, 3710–3720 RSC.
- P. H. T. Uhlherr, J. Guo, C. Tiu, X. M. Zhang, J. Z. Q. Zhou and T. N. Fang, J. Nonnewton. Fluid Mech., 2005, 125, 101–119 CrossRef CAS.
- C. J. Dibble, M. Kogan and M. J. Solomon, Phys. Rev. E: Stat., Nonlinear, Soft Matter Phys., 2006, 74, 1–11 CrossRef.
- T. Eckert and E. Bartsch, Phys. Rev. Lett., 2002, 89, 20–23 CrossRef.
- V. Prasad, V. Trappe, A. D. Dinsmore, P. N. Segre, L. Cipelletti and D. A. Weitz, Faraday Discuss., 2003, 123, 1–12 RSC.
- R. Borrega, M. Cloitre, I. Betremieux, B. Ernst and L. Leibler, Europhys. Lett., 1999, 47, 729–735 CrossRef CAS.
- P. Menut, S. Seiffert, J. Sprakel and D. A. Weitz, Soft Matter, 2012, 8, 156–164 RSC.
- H. Bachman, A. C. Brown, K. C. Clarke, K. S. Dhada, A. Douglas, C. E. Hansen, E. Herman, J. S. Hyatt, P. Kodlekere, Z. Meng, S. Saxena, M. W. Spears, N. Welsch and L. A. Lyon, Soft Matter, 2015, 11, 2018–2028 RSC.
- A. Le Grand and G. Petekidis, Rheol. Acta, 2008, 47, 579–590 CrossRef CAS.
- P. Lefrançois, E. Ibarboure, B. Payré, E. Gontier, J.-F. Le Meins and C. Schatz, J. Appl. Polym. Sci., 2015, 132, 1–7 CrossRef.
- L. Boulmedarat, J. L. Grossiord, E. Fattal and A. Bochot, Int. J. Pharm., 2003, 254, 59–64 CrossRef CAS.
- G. Bonacucina, S. Martelli and G. F. Palmieri, Int. J. Pharm., 2004, 282, 115–130 CrossRef CAS.
- S. J. Curran, R. E. Hayes, A. Afacan, M. C. Williams and P. A. Tanguy, J. Food Sci., 2002, 67, 176–180 CrossRef CAS.
- J. M. Piau, J. Nonnewton. Fluid Mech., 2007, 144, 1–29 CrossRef CAS.
- T. Divoux, D. Tamarii, C. Barentin and S. Manneville, Phys. Rev. Lett., 2010, 104, 1–4 CrossRef.
- F. K. Oppong and J. R. de Bruyn, Rheol. Acta, 2011, 50, 317–326 CrossRef CAS.
- J. O. Carnali and M. S. Naser, Colloid Polym. Sci., 1992, 270, 183–193 CrossRef CAS.
- D. Lee, I. A. Gutowski, A. E. Bailey, L. Rubatat, J. R. de Bruyn and B. J. Frisken, Phys. Rev. E: Stat., Nonlinear, Soft Matter Phys., 2011, 83, 031401 CrossRef.
- I. A. Gutowski, D. Lee, J. R. de Bruyn and B. J. Frisken, Rheol. Acta, 2012, 51, 441–450 CrossRef CAS.
- B. D. Jofore, P. Erni, G. Vleminckx, P. Moldenaers and C. Clasen, Rheol. Acta, 2015, 54, 581–600 CrossRef CAS.
- T. Bhattacharjee, C. P. Kabb, C. S. O'Bryan, J. M. Urueña, B. S. Sumerlin, W. G. Sawyer and T. E. Angelini, Soft Matter, 2018, 14, 1559–1570 RSC.
- B. Barry and M. Meyer, Int. J. Pharm., 1979, 2, 1–25 CrossRef CAS.
- R. J. Ketz, R. K. Prud'homme and W. W. Graessley, Rheol. Acta, 1988, 27, 531–539 CrossRef CAS.
- T. Divoux, V. Grenard and S. Manneville, Phys. Rev. Lett., 2013, 110, 018304 CrossRef.
- M. Dinkgreve, M. Fazilati, M. M. Denn and D. Bonn, J. Rheol., 2018, 62, 773–780 CrossRef CAS.
- G. J. Donley, J. R. de Bruyn, G. H. McKinley and S. A. Rogers, J. Nonnewton. Fluid Mech., 2019, 264, 117–134 CrossRef CAS.
- J. Y. Kim, J. Y. Song, E. J. Lee and S. K. Park, Colloid Polym. Sci., 2003, 281, 614–623 CrossRef CAS.
- Z. Shao, A. S. Negi and C. O. Osuji, Soft Matter, 2013, 9, 5492–5500 RSC.
- R. Barreiro-Iglesias, C. Alvarez-Lorenzo and A. Concheiro, Int. J. Pharm., 2003, 258, 165–177 CrossRef CAS.
- L. L. Hench, J. Mater. Sci.: Mater. Med., 2006, 17, 967–978 CrossRef CAS.
- P. R. Varges, C. M. Costa, B. S. Fonseca, M. F. Naccache and P. R. De Souza Mendes, Fluids, 2019, 4, 1–20 CrossRef.
- S. Migliozzi, P. Angeli and L. Mazzei, Colloids Surf., A, 2019, 577, 84–95 CrossRef CAS.
- J. S. Chu, D. M. Yu, G. L. Amidon, N. D. Weiner and A. H. Goldberg, Pharm. Res., 1992, 9, 1659–1663 CrossRef CAS.
- K. Miyazaki, H. M. Wyss, D. A. Weitz and D. R. Reichman, Europhys. Lett., 2006, 75, 915–921 CrossRef CAS.
- V. Carrier and G. Petekidis, J. Rheol., 2009, 53, 245–273 CrossRef CAS.
- N. Koumakis and G. Petekidis, Soft Matter, 2011, 7, 2456–2470 RSC.
- E. M. Furst and J. P. Pantina, Phys. Rev. E: Stat., Nonlinear, Soft Matter Phys., 2007, 75, 050402 CrossRef.
- K. N. Pham, G. Petekidis, D. Vlassopoulos, S. U. Egelhaaf, W. C. K. Poon and P. N. Pusey, J. Rheol., 2008, 52, 649–676 CrossRef CAS.
- C. N. Likos, Phys. Rep., 2001, 348, 267–439 CrossRef CAS.
- A. Laguecir, S. Ulrich, J. Labille, N. Fatin-Rouge, S. Stoll and J. Buffle, Eur. Polym. J., 2006, 42, 1135–1144 CrossRef CAS.
- O. H. Hughes and P. Bartlett, personal communication.
- B. Géraud, L. Jørgensen, C. Ybert, H. Delanoë-Ayari and C. Barentin, Eur. Phys. J. E: Soft Matter Biol. Phys., 2017, 40, 1–10 CrossRef.
- I. W. Hamley, Introduction to Soft Matter, John Wiley & Sons, Ltd, Chichester, 2007 Search PubMed.
- P. Sollich, Phys. Rev. E: Stat. Phys., Plasmas, Fluids, Relat. Interdiscip. Top., 1998, 58, 738–759 CrossRef CAS.
- A. J. Liu, S. Ramaswamy, T. G. Mason, H. Gang and D. A. Weitz, Phys. Rev. Lett., 1996, 76, 3017–3020 CrossRef CAS.
- J. J. Liétor-Santos, B. Sierra-Martín and A. Fernández-Nieves, Phys. Rev. E: Stat., Nonlinear, Soft Matter Phys., 2011, 84, 1–4 CrossRef.
- G. M. Conley, C. Zhang, P. Aebischer, J. L. Harden and F. Scheffold, Nat. Commun., 2019, 10, 1–8 CrossRef CAS.
- A. Ikeda, L. Berthier and P. Sollich, Soft Matter, 2013, 9, 7669–7683 RSC.
- F. Di Lorenzo and S. Seiffert, Macromolecules, 2013, 46, 1962–1972 CrossRef CAS.
- D. A. Sessoms, I. Bischofberger, L. Cipelletti and V. Trappe, Philos. Trans. R. Soc., A, 2009, 367, 5013–5032 CrossRef CAS.
- T. G. Mason and D. A. Weitz, Phys. Rev. Lett., 1995, 75, 2770–2773 CrossRef CAS.
- S. E. Paulin, B. J. Ackerson and M. S. Wolfe, J. Colloid Interface Sci., 1996, 178, 251–262 CrossRef CAS.
- T. G. Mason, M. D. Lacasse, G. S. Grest, D. Levine, J. Bibette and D. A. Weitz, Phys. Rev. E: Stat. Phys., Plasmas, Fluids, Relat. Interdiscip. Top., 1997, 56, 3150–3166 CrossRef CAS.
- F. Scheffold, P. Díaz-Leyva, M. Reufer, N. Ben Braham, I. Lynch and J. L. Harden, Phys. Rev. Lett., 2010, 104, 1–4 CrossRef.
- H. Senff and W. Richtering, J. Chem. Phys., 1999, 111, 1705–1711 CrossRef CAS.
- M. Laurati, G. Petekidis, N. Koumakis, F. Cardinaux, A. B. Schofield, J. M. Brader, M. Fuchs and S. U. Egelhaaf, J. Chem. Phys., 2009, 130, 134907 CrossRef CAS.
- A. Ghosh, G. Chaudhary, J. G. Kang, P. V. Braun, R. H. Ewoldt and K. S. Schweizer, Soft Matter, 2019, 15, 1038–1052 RSC.
- J. R. Seth, M. Cloitre and R. T. Bonnecaze, J. Rheol., 2006, 50, 353–376 CrossRef CAS.
- M. Cloitre, R. Borrega, F. Monti and L. Leibler, Phys. Rev. Lett., 2003, 90, 068303 CrossRef.
- M. Dinkgreve, J. Paredes, M. M. Denn and D. Bonn, J. Nonnewton. Fluid Mech., 2016, 238, 233–241 CrossRef CAS.
- F. Rouyer, S. Cohen-Addad and R. Höhler, Colloids Surf., A, 2005, 263, 111–116 CrossRef CAS.
- K. N. Nordstrom, E. Verneuil, P. E. Arratia, A. Basu, Z. Zhang, A. G. Yodh, J. P. Gollub and D. J. Durian, Phys. Rev. Lett., 2010, 105, 1–4 CrossRef.
- B. M. Erwin, M. Cloitre, M. Gauthier and D. Vlassopoulos, Soft Matter, 2010, 6, 2825–2833 RSC.
- J. R. Seth, L. Mohan, C. Locatelli-Champagne, M. Cloitre and R. T. Bonnecaze, Nat. Mater., 2011, 10, 838–843 CrossRef CAS.
- M. Laurati, S. U. Egelhaaf and G. Petekidis, J. Rheol., 2011, 55, 673–706 CrossRef CAS.
- R. Buscall, P. D. Mills, R. F. Stewart, D. Sutton, L. R. White and G. E. Yates, J. Nonnewton. Fluid Mech., 1987, 24, 183–202 CrossRef CAS.
- S. A. Shah, Y. L. Chen, K. S. Schweizer and C. F. Zukoski, J. Chem. Phys., 2003, 119, 8747–8761 CrossRef CAS.
- M. Siebenbürger, M. Fuchs, H. Winter and M. Ballauff, J. Rheol., 2009, 53, 707–726 CrossRef.
- M. Mooney, J. Colloid Sci., 1951, 6, 162–170 CrossRef CAS.
- G. K. Batchelor, J. Fluid Mech., 1977, 83, 97–117 CrossRef.
- P. Olsson and S. Teitel, Phys. Rev. Lett., 2012, 109, 1–5 CrossRef.
- T. Liu, F. Khabaz, R. T. Bonnecaze and M. Cloitre, Soft Matter, 2018, 14, 7064–7074 RSC.
Footnote |
† Electronic supplementary information (ESI) available: Details of sample preconditioning; additional confocal images and summary of all concentrations tested; derivative of the loss moduli close to the jamming transition and summary of the evolution of G′ and G′′ with Carbopol concentration; trend of the loss tangents tan![[thin space (1/6-em)]](https://www.rsc.org/images/entities/char_2009.gif) δ with Carbopol concentration; graphical representation of the determination of the yield strain γy obtained from LAOS; discrepancy between σy and σB as a function of Carbopol apparent volume fraction; Carreau-Yasuda fitting parameters; reversibility of the yielding behaviour near the jamming transition; determination of Mooney's equation parameters. See DOI: 10.1039/d0sm01196g δ with Carbopol concentration; graphical representation of the determination of the yield strain γy obtained from LAOS; discrepancy between σy and σB as a function of Carbopol apparent volume fraction; Carreau-Yasuda fitting parameters; reversibility of the yielding behaviour near the jamming transition; determination of Mooney's equation parameters. See DOI: 10.1039/d0sm01196g |
| This journal is © The Royal Society of Chemistry 2020 |

