 Open Access Article
Elastic stresses reverse Ostwald ripening†
Kathryn A.
Rosowski
a,
Estefania
Vidal-Henriquez
 b,
David
Zwicker
 b,
Robert W.
Style
 *a and
Eric R.
Dufresne
 *a
*a
aDepartment of Materials, ETH Zürich, 8093 Zürich, Switzerland. E-mail: robert.style@mat.ethz.ch; eric.dufresne@mat.ethz.ch
bMax Planck Institute for Dynamics and Self-Organization, 37077, Göttingen, Germany
First published on 4th June 2020
Abstract
When liquid droplets nucleate and grow in a polymer network, compressive stresses can significantly increase their internal pressure, reaching values that far exceed the Laplace pressure. When droplets have grown in a polymer network with a stiffness gradient, droplets in relatively stiff regions of the network tend to dissolve, favoring growth of droplets in softer regions. Here, we show that this elastic ripening can be strong enough to reverse the direction of Ostwald ripening: large droplets can shrink to feed the growth of smaller ones. To numerically model these experiments, we generalize the theory of elastic ripening to account for gradients in solubility alongside gradients in mechanical stiffness.
I Introduction
In a conventional emulsion, the long term-stability of droplets is typically limited by their interfacial energy. Over time, the size distribution of droplets coarsens, with smaller drops disappearing in favor of larger ones.1 The fastest route to coarsening is the direct coalescence of droplets. However, when coalescence is suppressed – typically by surfactants – Ostwald ripening takes over.2 In this process, summarized in Fig. 1A, small droplets tend to shrink by dissolution and large ones tend to grow by condensation. This is driven by differences in the droplets’ Laplace pressure, P = 2ϒ/R, where ϒ is the surface tension and R is the droplet radius.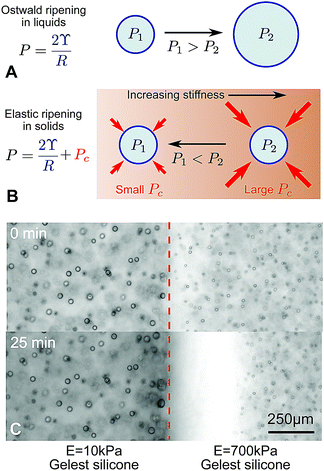 | ||
| Fig. 1 Ostwald ripening in liquids and elastic ripening in polymer networks. (A) and (B) Schematic diagrams summarizing the key differences between Ostwald ripening and elastic ripening.3 Here, Pc ∼ E is the cavitation pressure. (C) In substrates with a gradient in stiffness (here a step change from E = 10–700 kPa), but with otherwise identical properties, droplets ripen from the stiffer side to the softer side (data from ref. 3). | ||
This picture changes significantly when droplets form by nucleation and growth in a polymer network. In homogeneous networks, these droplets tend to be monodisperse and very stable, with smaller droplets appearing in stiffer networks.4 When droplets exclude the polymer network, they push the network outward as they grow. In response, the network squeezes the droplets. This both suppresses droplet condensation,3 and increases the droplet's internal pressure by an amount comparable to the network's Young modulus, E.5–7 This increase in pressure can potentially far exceed the Laplace pressure. Thus, when the polymer network has heterogeneous mechanical properties, the elastic contribution to droplet pressure is heterogeneous and can drive transport of material from droplets in stiff regions to droplets in soft regions, summarized in Fig. 1B.3 Like Ostwald ripening, this ‘elastic ripening’ is mediated by the transport of material between droplets in the dilute phase. Related phenomena have been observed in the nucleus of living cells.8
Previous demonstrations of elastic ripening, like that in Fig. 1C, have superficially resembled Ostwald ripening, because large droplets (in soft regions of the network), grew at the expense of small droplets (in stiff regions of the network). Thus, the establishment of elastic stresses as the driving force for ripening relied on comparisons across experiments with varying elastic moduli, and comparisons to numerical models.
Here, we demonstrate that elastic ripening phenomena can qualitatively differ from classic Ostwald ripening. In particular, we demonstrate the growth of small droplets, fed by the dissolution of large ones. Experimentally, this is achieved by coupling two different families of silicone gels, which have different thermodynamic and transport properties at the same elastic modulus. These new results demand a generalization of the model for elastic ripening. In particular, gradients in solubility must be accounted for. With this generalization, numerical simulations capture essential features of experimental observations, using experimentally measured properties.
II Experimental results
We study elastic ripening in a system of phase-separated fluorinated oil (Fluorinert FC-770) droplets in silicone gels. The gels are saturated in a bath of fluorinated oil at 40 °C over a few days, then cooled passively to room temperature (22–23 °C) over several minutes. As the samples cool, the solubility of the fluorinated oil decreases, and droplets grow in the gels.4 The silicone network is excluded from the droplets, so they grow by pushing open holes in the gel.7To create stiffness gradients, we make two different silicones side by side. We first cure a 3–5 mm layer of the stiffer silicone in a polystyrene Petri dish (Greiner). Half of this is cut out with a scalpel, pulled off the dish, and placed in half of a new, glass-bottomed dish (MatTek). The softer silicone is then poured into the other side of the dish and allowed to cure.3 When we drive phase separation by cooling, droplets on each side of the sample grow to a uniform distribution, with a sharp transition between them (Fig. 1C). After relatively fast droplet formation, we observe slow evolution of the droplets near the interface.
In previous experiments,3 we observed that smaller droplets, on the stiffer side, dissolved and fed the growth of larger droplets, on the softer side (e.g.Fig. 1C). While resembling familiar Ostwald ripening, due to surface tension, we concluded that ripening was driven by gradients in the stiffness of the polymer network. This conclusion was based on an observed increase of the ripening rate with the stiffness difference and comparison with numerical models. Here, we challenge this interpretation by considering ripening across a broader range of silicone samples.
We use two different families of silicone gels, as described in the Materials and Methods. ‘Gelest’ silicones are fabricated by mixing together functionalized silicone polymers, crosslinker, and a platinum catalyst following.3 ‘Sylgard’ silicones are fabricated with a popular commercial kit, Sylgard 184. Chemically, these are essentially the same as the Gelest silicones, but additionally contain a significant quantity of silica nanoparticle filler.9 With both types of silicone, we can achieve a range of Young's moduli, E, from tens to hundreds of kPa.
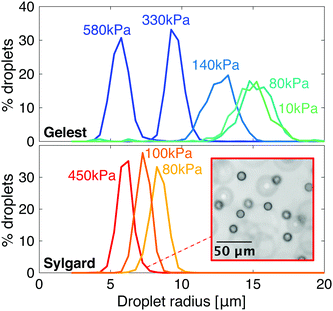
Despite some similarities, these two families of silicones show quantitative differences in their phase-separation behavior. In particular, condensed droplets of fluorinated oil have different sizes at the same network stiffness, as shown in Fig. 2. As the stiffness of Gelest networks increases from 10 to 580 kPa, the mean droplet radius reduces from 14.9 ± 1.4 μm to 5.7 ± 0.7 μm. As the stiffness of the Sylgard networks increases from 80 to 450 kPa, the mean droplet radius reduces slightly from 8.3 ± 0.6 μm to 6.0 ± 0.5 μm. Note that these radii are the final, stable sizes that droplets grow to when the homogeneous silicones fully cool to room temperature after saturation at 40 °C.
In samples made from only one of these silicone families, elastic ripening and Ostwald ripening proceed in the same direction. This is because the droplet size generically decreases with the stiffness. With two different families of silicone, we can remove this limitation, and explore combinations of materials where elastic and Ostwald ripening alternatively reinforce or oppose each other.
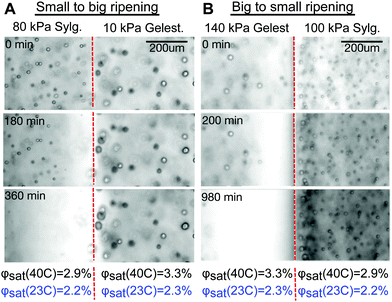
An example where Ostwald and elastic ripening reinforce each other is shown in Fig. 3A and Movie S1 (ESI†). Here, stiffer Sylgard silicone (E = 80 kPa, mean droplet size 8.4 μm) is in contact with softer Gelest silicone (E = 10 kPa, mean droplet size 14.9 μm). Consistent with previous results, smaller fluorinated oil droplets on the stiff side shrink while feeding the growth of larger droplets on the soft side. The direction of ripening is consistent with both Ostwald and elastic ripening.
An example where elastic forces oppose Ostwald ripening is shown in Fig. 3B and Movie S2 (ESI†). Here, stiff Gelest silicone (E = 140 kPa, mean droplet size 12.7 μm) is in contact with soft Sylgard silicone (E = 100 kPa, mean droplet size 7.3 μm). In this case, the larger droplets near the interface on the stiff side shrink while small droplets on the soft side grow. This is the opposite of the trend expected from Ostwald ripening, and provides a convincing visual case for elastic ripening.
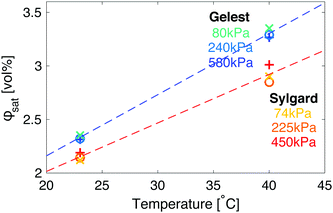
An interesting complication in the interpretation of the data in Fig. 3 arises due to the differences in the solubility of fluorinated oil on the two sides. In both silicones, the saturation concentration, ϕsat, increases with the temperature, but does not change significantly with the elastic modulus (Fig. 4). However, fluorinated oil has significantly higher solubility in the Gelest than Sylgard silicones, Fig. 4. Additionally, the solubility of fluorinated oil is more temperature sensitive in Gelest than in Sylgard. In practice, this means that when the temperature drops, the Gelest samples become more strongly supersaturated than the Sylgard ones. As we will see below, these factors play important roles in understanding the observed ripening behaviour.
III Theory and simulation
In the classic description of Ostwald ripening10 and initial descriptions of elastic ripening,11 the concentration, ϕ, of solute near the surface of a droplet is pinned to its equilibrium value, which increases with the internal pressure of the droplet. Then, simple diffusion drives a flux![[J with combining right harpoon above (vector)]](https://www.rsc.org/images/entities/i_char_004a_20d1.gif) of solute down concentration gradients according to Fick's law,
of solute down concentration gradients according to Fick's law,  , where D is the diffusivity of the oil in the dilute phase.
In our experiments, solute transport occurs in gels with a heterogeneous saturation concentration. In such cases, one needs to take a more general approach, where fluxes are driven by gradients in chemical potential, μ:
 | (1) |
μ = kBT![[thin space (1/6-em)]](https://www.rsc.org/images/entities/char_2009.gif) log(ϕ/ϕsat). log(ϕ/ϕsat). | (2) |
In the droplet phase, the chemical potential is simply related to the pressure, μ ≈ P/nL.13 Here, nL is the number density of molecules in the droplet phase. Differences in chemical potential between droplets are thus equivalent to pressure differences, and eqn (1) matches our expectation that solute should be driven from high pressure to low pressure.
For droplets in an elastic network, the pressure within the droplet has the form,
 | (3) |
 | (4) |
With this simple extension of ripening theory, numerical simulations capture essential features of the experiments, as shown in Fig. 3. We randomly place droplets on either side of the sample, with density and size distributions matching the measured experimental results. Since the droplets equilibrate quickly with their surrounding, we use the chemical potential associated with the pressure P given by eqn (3) to calculate the concentration ϕ using eqn (2). Finally, we model diffusive flux between droplets by combining eqn (1) and (2) with a conservation law, as described in the Materials and Methods. Values of D, ϕsat and E are taken directly from the measured values.
The results, shown in Fig. 5 and Movies S3 and S4 (ESI†), are in qualitative agreement with the experiments. The left-hand column shows results of the simulation of the experiment of Fig. 3A. As in the experiment, we see depletion of the droplets in the stiffer Sylgard, and growth of droplets in the softer Gelest adjacent to the interface. Interestingly, we see that ϕ is always larger on the softer side than on the stiffer side, so diffusion progresses up concentration gradients. This is due to the differences in ϕsat between the two sides. When we account for this in the chemical potential, viaeqn (2), we verify that transport occurs down chemical potential gradients, as expected. The right-hand column of the figure simulates the experiment of Fig. 3B. Again, we see the ripening from the stiff side to the soft side. However, in this case, ripening occurs from larger droplets to smaller droplets – the opposite direction to what is usually expected.
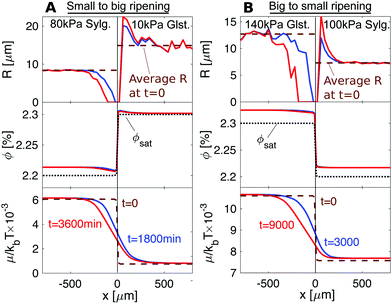 | ||
| Fig. 5 Numerical simulations of the experimental setups presented in Fig. 3. Top: Droplet radius. Middle: Concentration in the dilute phase, ϕ. Bottom: Chemical potential, μ. (A) For 80 kPa Sylgard next to 10 kPa Gelest, elastic ripening moves against concentration gradients. (B) For 140 kPa next to 100 kPa Sylgard, elastic ripening goes against classical Ostwald ripening. | ||
While the simulations capture the essential experimental trends, transport in experiments is approximately ten times faster than expected from simulations. The origin of this discrepancy remains elusive.
IV Conclusions
We have demonstrated that elastic stresses in polymer networks can reverse the direction of droplet ripening. To understand these results, we have generalized the theory of elastic ripening to account for simultaneous gradients of elasticity and solubility. In these cases, the simple picture of diffusive transport down a concentration gradient must be set aside in favor of a more general approach, where transport occurs along gradients in the chemical potential. Qualitatively, the direction of transport can be predicted simply by considering the internal pressure of the droplets. Since the chemical potential of the pure liquid droplets increases with their pressure, oil is always transported from high pressure regions to low pressure regions. For droplets grown in a polymer network, their pressure generally has contributions from both surface tension and compressive network stresses. For the cases here, the latter is much higher than the former. Quantitative prediction of the rate of ripening further requires knowledge of the saturation concentrations, initial droplet density and size distribution, and diffusion coefficients of dissolved oil in the networks (c.f.ref. 11).These results help to lay the foundations for the analysis of phase separation in complex, heterogeneous environments. Our experiments and theory are inspired by recent observations of phase separation in living cells (e.g.ref. 8 and 16). In that context, specific macromolecules, including nucleic acids and proteins, segregate into functional domains within the cytoplasm and nucleoplasm.17–20 The working model for interpreting these phenomena is the phase separation of two-component fluids. While this captures some of the basic phenomenology, recent theories aimed to account for activity,21,22 large-scale concentration gradients,23,24 complex compositions,25 and rheology.4,11,26–28 Our work further establishes a general framework for evaluating the role of a passive network in crowded systems (see also ref. 29). Note that we assume that our system remains near equilibrium and that the rheology of the continuous phase can be reduced to a single, static, inflation pressure. Thus, these results should not be directly applied to complex living systems without caution.
We also anticipate that these results may be relevant to several related systems. For example, this system has much in common with the volumetric phase separation that can occur when crosslinked hydrogels go through deswelling transitions,30–33 giving rise to phase-separated regions of collapsed and non-collapsed gel. In this case, our results suggest the possibility of interesting ripening behaviour in the presence of network heterogeneities. Similarly, there are strong ties to the stabilisation of foams by bulk or interfacial elasticity,34,35 temporary elastic stabilisation during viscoelastic phase separation,26 and in the design of other phase-separation processes in materials near equilibrium. These include the production of porous membranes and scaffolds,36 the formation of segregated ice during the processing of frozen foods (e.g.ref. 37), in cryopreservation,38 and other processes where freezing causes material damage to porous materials (e.g.ref. 39).
V Materials and methods
A. Preparation of silicone gels
To create ‘Gelest’ silicones, we follow the recipe in ref. 40, divinyl-terminated polydimethylsiloxane chains (DMS-V31, Gelest), cross-linker (HMS-301, Gelest), and catalyst (SIP6831.2, Gelest) are mixed thoroughly. The mixture is degassed, and cured at 60 °C for at least one week. By changing the ratio of chains to crosslinker, while keeping the concentration of catalyst consistent (at 0.0019 volume percent), the gel's Young modulus can be tuned.To create ‘Sylgard’ silicones, we use the commercial brand Sylgard 184 (Dow). The base is mixed with curing agent, using different ratios to attain different stiffnesses. The mixture is degassed thorougly and cured at 40–60 °C for at least one week.
For both silicones, the Young's modulus, E, is measured by indentation following the procedure in ref. 40. We slowly indent bulk samples with a cylindrical, flat-punch indenter with a 1 mm contact radius, and calculate E from the initial slope of the force–indentation curve. We never see creep, and there is no viscous dissipation and no frequency-dependence of E below indentation speeds of 0.1 mm s−1.
B. Measurement solute of ϕsat and D
Silicone gels were prepared as a thin layer in 50 mm diameter glass-bottom Petri dishes (MatTek). We measured the mass of the gel with a microbalance before pouring a bath of fluorinated oil on top and allowing it to diffuse into the gel (either held at room temperature or at 40 °C). Periodically, we removed the excess oil and recorded the mass of dissolved oil. After around 30 hours for Gelest gels, and 60 hours for Sylgard gels, the weight plateaued as the gels reached saturation, allowing us to calculate ϕsat in vol%.The diffusion coefficient, D, was calculated following.3 Briefly, for an infinitely thick layer of silicone, covered in a layer of fluorinated oil, we expect the concentration profile (in terms of mass per volume) to follow
 | (5) |
moil(t) = 2![[thin space (1/6-em)]](https://www.rsc.org/images/entities/char_2009.gif) rdish2ceq(πDt)1/2 rdish2ceq(πDt)1/2 | (6) |
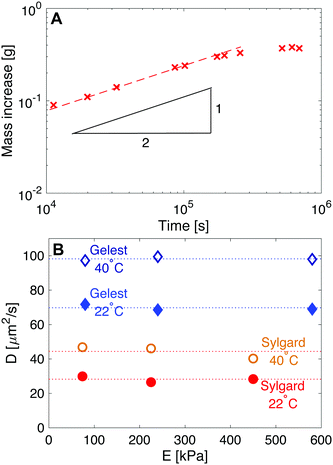 | ||
| Fig. 6 Measuring the diffusivity of fluorinated oil in silicone. (A) Here, Sylgard silicone with E = 230 kPa is immersed in fluorinated oil and weighed at regular intervals to determine the uptake in mass, as shown. Initially the uptake follows moil ∼ t1/2, as expected from eqn (6). Subsequently, moil plateaus at the saturation concentration. The red dashed line shows a fit with slope 1/2. (B) Plots of diffusivity vs. E show how D is larger in Gelest silicones than in Sylgard silicones. D is also independent of stiffness for the two silicone families, and increases with temperature. | ||
C. Numerical simulations
In order to simulate this system we adapted our elastic ripening model previously studied in ref. 11 to account for materials with different saturation concentrations ϕsat. Therefore, we describe the dynamics of droplets embedded in a diluted concentration field ϕ. Each droplet is characterized by its position![[x with combining right harpoon above (vector)]](https://www.rsc.org/images/entities/i_char_0078_20d1.gif) i and radius Ri and follows the dynamical equation22
i and radius Ri and follows the dynamical equation22 | (7) |
ϕcond = ϕsat![[thin space (1/6-em)]](https://www.rsc.org/images/entities/char_2009.gif) exp(P/nLkBT). exp(P/nLkBT). | (8) |
![[x with combining right harpoon above (vector)]](https://www.rsc.org/images/entities/i_char_0078_20d1.gif) i and take only the leading order term. The conservation law for the solute in the dilute phase is given by11
i and take only the leading order term. The conservation law for the solute in the dilute phase is given by11 | (9) |
with Δ = 5 μm. The saturation concentration ϕsat was model analogously following the same curve.
We initialize the system by randomly placing droplets according to experimental density measurements.4 The droplet radii are randomly drawn from a Gaussian distribution following the data shown in Fig. 2. The dilute phase ϕ is initialized at ϕ = ϕcond to avoid initial droplet growth. In our simulations we assumed a densely packed droplet phase ϕin = 1, other parameters are α = 0.5, nLkBT = 11 MPa and ϒ = 4 mN m−2.
Conflicts of interest
There are no conflicts to declare.Acknowledgements
We thank Tianqi Sai for help with measurement of diffusivity and saturation concentration.References
- P.-G. de Gennes, F. Brochard-Wyart and D. Quere, Capillarity and Wetting Phenomena: Drops, Bubbles, Pearls, Waves, Springer, 2004 Search PubMed.
- M. Cates, Soft Interfaces: Lecture Notes of the Les Houches Summer School: Volume 98, July 2012, 2017, vol. 98, p. 317 Search PubMed.
- K. A. Rosowski, T. Sai, E. Vidal-Henriquez, D. Zwicker, R. W. Style and E. R. Dufresne, Nat. Phys., 2020, 1–4 Search PubMed.
- R. W. Style, T. Sai, N. Fanelli, M. Ijavi, K. Smith-Mannschott, Q. Xu, L. A. Wilen and E. R. Dufresne, Phys. Rev. X, 2018, 8, 011028 Search PubMed.
- S. B. Hutchens, S. Fakhouri and A. J. Crosby, Soft Matter, 2016, 12, 2557–2566 RSC.
- S. Raayai-Ardakani, D. R. Earl and T. Cohen, Soft Matter, 2019, 15, 4999–5005 RSC.
- J. Y. Kim, Z. Liu, B. M. Weon, T. Cohen, C.-Y. Hui, E. R. Dufresne and R. W. Style, Sci. Adv., 2020, 6(13), eaaz0418, DOI:10.1126/sciadv.aaz0418.
- Y. Shin, Y.-C. Chang, D. S. W. Lee, J. Berry, D. W. Sanders, P. Ronceray, N. S. Wingreen, M. Haataja and C. P. Brangwynne, Cell, 2018, 175, 1481–1491 CrossRef CAS PubMed.
- J. N. Lee, X. Jiang, D. Ryan and G. M. Whitesides, Langmuir, 2004, 20, 11684–11691 CrossRef CAS PubMed.
- P. W. Voorhees, J. Stat. Phys., 1985, 38, 231–252 CrossRef.
- E. Vidal-Henriquez and D. Zwicker, 2020, arXiv preprint arXiv:2001.11752.
- P. J. Flory and J. Rehner Jr, J. Chem. Phys., 1943, 11, 512–520 CrossRef CAS.
- Q. Liu and Z. Suo, Extreme Mech. Lett., 2016, 7, 27–33 CrossRef.
- A. N. Gent and C. Wang, J. Mater. Sci., 1991, 26, 3392–3395 CrossRef.
- J. A. Zimberlin, N. Sanabria-DeLong, G. N. Tew and A. J. Crosby, Soft Matter, 2007, 3, 763–767 RSC.
- F. G. Quiroz, V. F. Fiore, J. Levorse, L. Polak, E. Wong, H. A. Pasolli and E. Fuchs, Science, 2020, 367(6483), eaax9554, DOI:10.1126/science.aax9554.
- S. Alberti and A. A. Hyman, BioEssays, 2016, 38, 959–968 CrossRef CAS PubMed.
- C. P. Brangwynne, C. R. Eckmann, D. S. Courson, A. Rybarska, C. Hoege, J. Gharakhani, F. Jülicher and A. A. Hyman, Science, 2009, 324, 1729–1732 CrossRef CAS PubMed.
- A. A. Hyman, C. A. Weber and F. Jülicher, Annu. Rev. Cell Dev. Biol., 2014, 30, 39–58 CrossRef CAS PubMed.
- Y. Shin and C. P. Brangwynne, Science, 2017, 357, eaaf4382 CrossRef PubMed.
- D. Zwicker, M. Decker, S. Jaensch, A. A. Hyman and F. Jülicher, Proc. Natl. Acad. Sci. U. S. A., 2014, 111, E2636–E2645 CrossRef CAS PubMed.
- C. A. Weber, D. Zwicker, F. Jülicher and C. F. Lee, Rep. Prog. Phys., 2019, 82, 064601 CrossRef CAS PubMed.
- C. A. Weber, C. F. Lee and F. Jülicher, New J. Phys., 2017, 19, 053021 CrossRef.
- S. Saha, C. A. Weber, M. Nousch, O. Adame-Arana, C. Hoege, M. Y. Hein, E. Osborne-Nishimura, J. Mahamid, M. Jahnel and L. Jawerth, et al. , Cell, 2016, 166, 1572–1584 CrossRef CAS PubMed.
- W. M. Jacobs and D. Frenkel, Biophys. J., 2017, 112, 683–691 CrossRef CAS PubMed.
- H. Tanaka, J. Phys.: Condens. Matter, 2000, 12, R207 CrossRef CAS.
- M. G. Hennessy, A. Münch and B. Wagner, Phys. Rev. E, 2020, 101, 032501 CrossRef PubMed.
- B. Mukherjee and B. Chakrabarti, 2019, arXiv preprint arXiv:1907.04014.
- M. Kothari and T. Cohen, 2020, arXiv preprint arXiv:2004.13238.
- T. Tanaka, G. Swislow and I. Ohmine, Phys. Rev. Lett., 1979, 42, 1556 CrossRef CAS.
- K. Sekimoto, N. Suematsu and K. Kawasaki, Phys. Rev. A: At., Mol., Opt. Phys., 1989, 39, 4912 CrossRef CAS PubMed.
- A. Onuki and S. Puri, Phys. Rev. E: Stat. Phys., Plasmas, Fluids, Relat. Interdiscip. Top., 1999, 59, R1331 CrossRef CAS.
- H. Takeshita, T. Kanaya, K. Nishida and K. Kaji, Macromolecules, 2001, 34, 7894–7898 CrossRef CAS.
- W. Kloek, T. van Vliet and M. Meinders, J. Colloid Interface Sci., 2001, 237, 158–166 CrossRef CAS PubMed.
- E. Rio, W. Drenckhan, A. Salonen and D. Langevin, Adv. Colloid Interface Sci., 2014, 205, 74–86 CrossRef CAS PubMed.
- Y. Yang, J. Zhao, Y. Zhao, L. Wen, X. Yuan and Y. Fan, J. Appl. Polym. Sci., 2008, 109, 1232–1241 CrossRef CAS.
- S. Van Buggenhout, M. Lille, I. Messagie, A. Van Loey, K. Autio and M. Hendrickx, Eur. Food Res. Technol., 2006, 222, 543–553 CrossRef.
- J. O. Karlsson and M. Toner, Biomaterials, 1996, 17, 243–256 CrossRef CAS PubMed.
- J. M. H. Schollick, R. W. Style, A. Curran, J. S. Wettlaufer, E. R. Dufresne, P. B. Warren, K. P. Velikov, R. P. A. Dullens and D. G. A. L. Aarts, J. Phys. Chem. B, 2016, 120, 3941–3949 CrossRef CAS PubMed.
- R. W. Style, R. Boltyanskiy, B. Allen, K. E. Jensen, H. P. Foote, J. S. Wettlaufer and E. R. Dufresne, Nat. Phys., 2015, 11, 82–87 Search PubMed.
Footnote |
| † Electronic supplementary information (ESI) available: Supplementary Movie 1: elastic ripening from small to big. Movie showing progression of the ripening experiment in Fig. 3A. Images are taken at 5 minutes intervals. Supplementary Movie 2: elastic ripening from big to small. Movie showing progression of the ripening experiment in Fig. 3B. Images are taken at 5 minutes intervals. Supplementary Movie 3: simulated elastic ripening from small to big. 2D projection of a numerical simulation with Gelest (ϕsat = 0.023 and E = 10 kPa) on the left, and Sylgard (ϕsat = 0.022 and E = 80 kPa) on the right. Chemical potential μ is shown as a density plot with colorbar at the right side. Supplementary Movie 4: simulated elastic ripening from big to small. 2D projection of a numerical simulation with Gelest (ϕsat = 0.023 and E = 140 kPa) on the left, and Sylgard (ϕsat = 0.022 and E = 100 kPa) on the right. Chemical potential μ is shown as a density plot with colorbar at the right side. See DOI: 10.1039/d0sm00628a |
| This journal is © The Royal Society of Chemistry 2020 |

